A group of traders spent an hour arguing about which stock would post the biggest jump after earnings this week. They picked CoreWeave. Then, asked which way CoreWeave would actually move, the same group could not say it expected the stock to rise.
That tension is the reason this experiment is worth your time. CoreWeave is scheduled to report third-quarter results after the US market close today, 10 November 2026. Its options are priced for one of the widest earnings swings among large US technology names.
Crowd sentiment tools are increasingly marketed as an edge around events like this. Before you lean on one, you need to know what kind of signal it produces and how it sits against the numbers already priced into the options market.
Here is what the experiment can tell you before a high-volatility report like CoreWeave earnings, and where its usefulness runs out.
How did a swarm of traders and AI co-agents reach a view on CoreWeave?
If you had watched the session, you would have seen a dashboard. Bars for each answer rose and fell as small groups debated, with support shifting from one option to another in real time.
According to the broadcast account, Tastylive and Unanimous AI ran the deliberation on the Thinkscape platform at the market close on a Thursday, the week before the segment aired. David Baltax of Unanimous AI presented alongside Tastylive host Ilia. Unanimous AI builds software that links groups of people so they can reason together in real time.
The broadcast described the setup this way:
- About 50-51 Tastylive community members took part
- Participants were split across 19 connected rooms of roughly four to six people each
- Each room had two AI co-agents, named Kit and Scout
- A live dashboard tracked support for each option as the discussion moved
- The group worked through three questions
The small rooms were deliberate. The presenters said research points to four to seven people as the best size for discussion, because larger groups tend to be dominated by the loudest or highest-status voices.
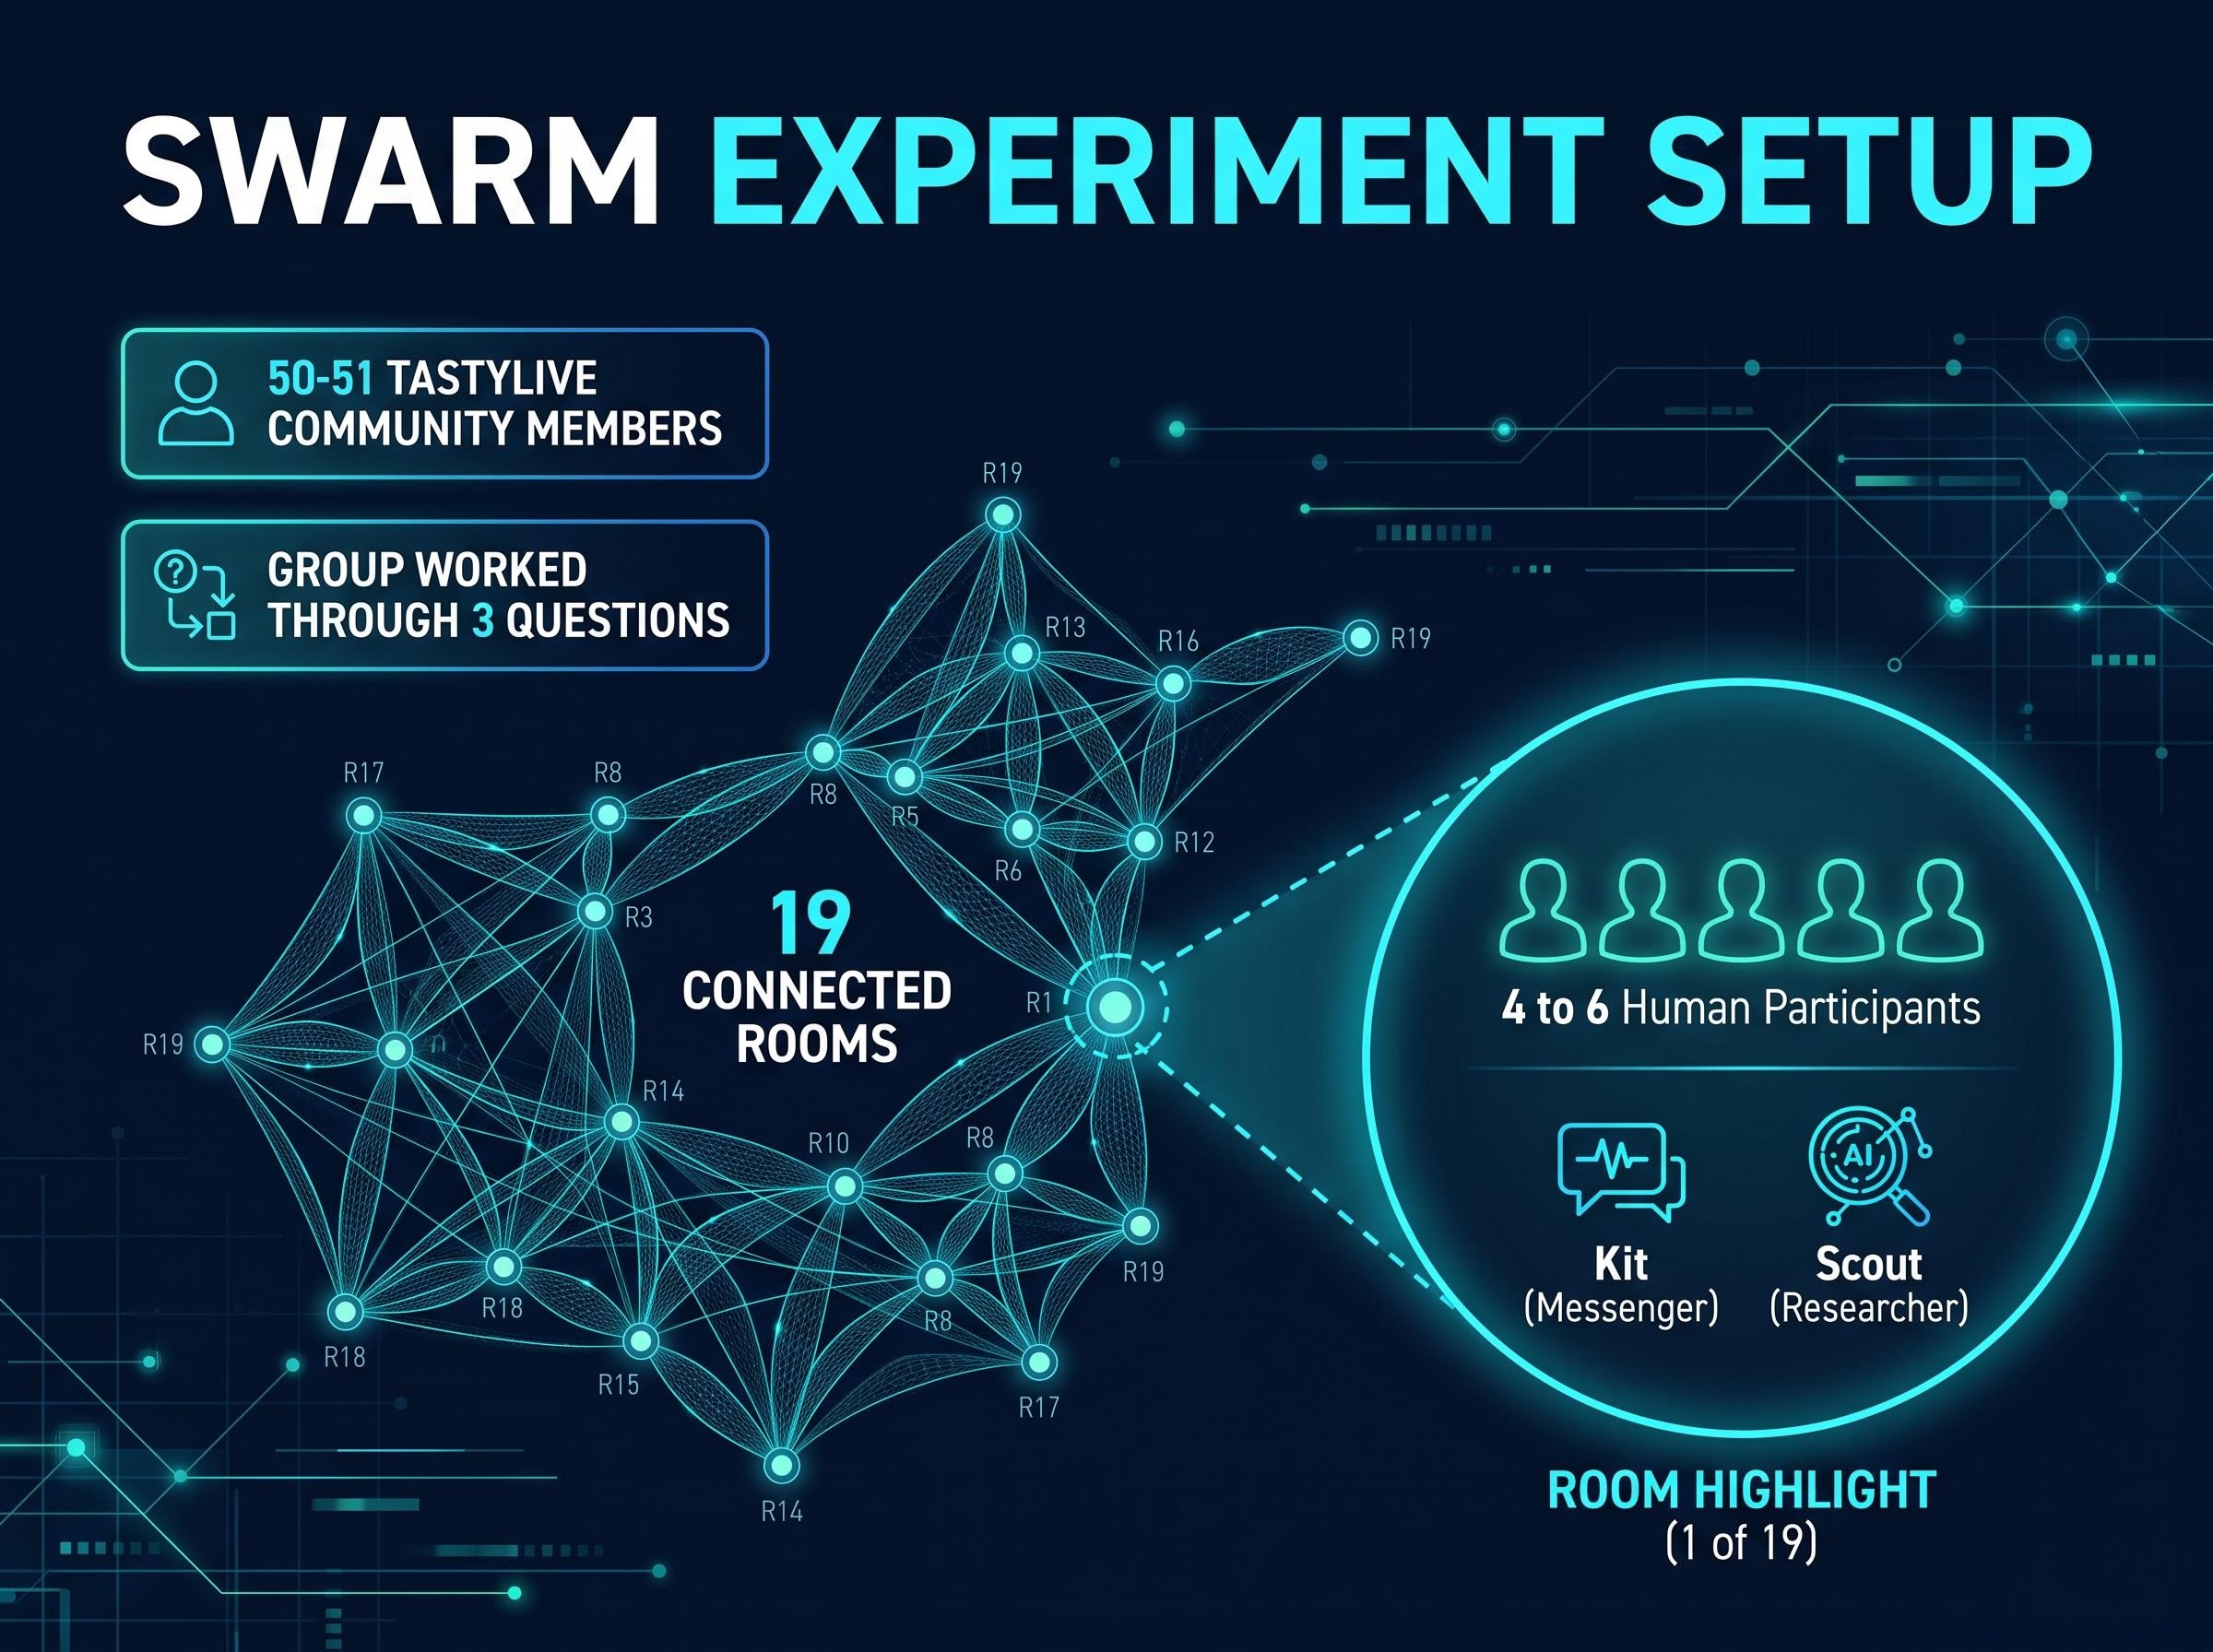
The Unanimous AI setup split 50-51 Tastylive members into 19 connected rooms to debate 3 questions with AI agents.
These session details come from the broadcast itself and were not independently corroborated in public sources.
What Kit and Scout actually do
Kit is a messenger. It tracks the main arguments in its room and passes them to sister agents in other rooms, which raise those ideas in conversation. A good point made in room three can surface in room fifteen.
Scout is a researcher. It retrieves information a group asks for, such as statistics or background on a company. Baltax said both agents support the human participants and do not steer the conversation.
Because people had to explain their reasoning and answer challenges, the output shows how firmly views were held, which a simple poll hides. You should still treat it as a snapshot of sentiment, not a verdict.
When big ASX news breaks, our subscribers know first
What did the group conclude about CoreWeave earnings and the S&P 500?
The first question asked which of five companies reporting that week would post the biggest positive move within 24 hours of earnings: Rocket Lab, Take-Two, CoreWeave, Nebius or Applied Materials.
Every name drew early support. As the debate ran, the AI compute names (CoreWeave, Nebius and Applied Materials) pulled away from the other two, and CoreWeave finished on top. Participants pointed to its unusually high implied volatility, its record of large post-earnings swings, strong AI compute demand, revenue growth, a large backlog and room to rebound after a recent sell-off. They also flagged debt, heavy investment spending and possible regulatory change as headwinds.
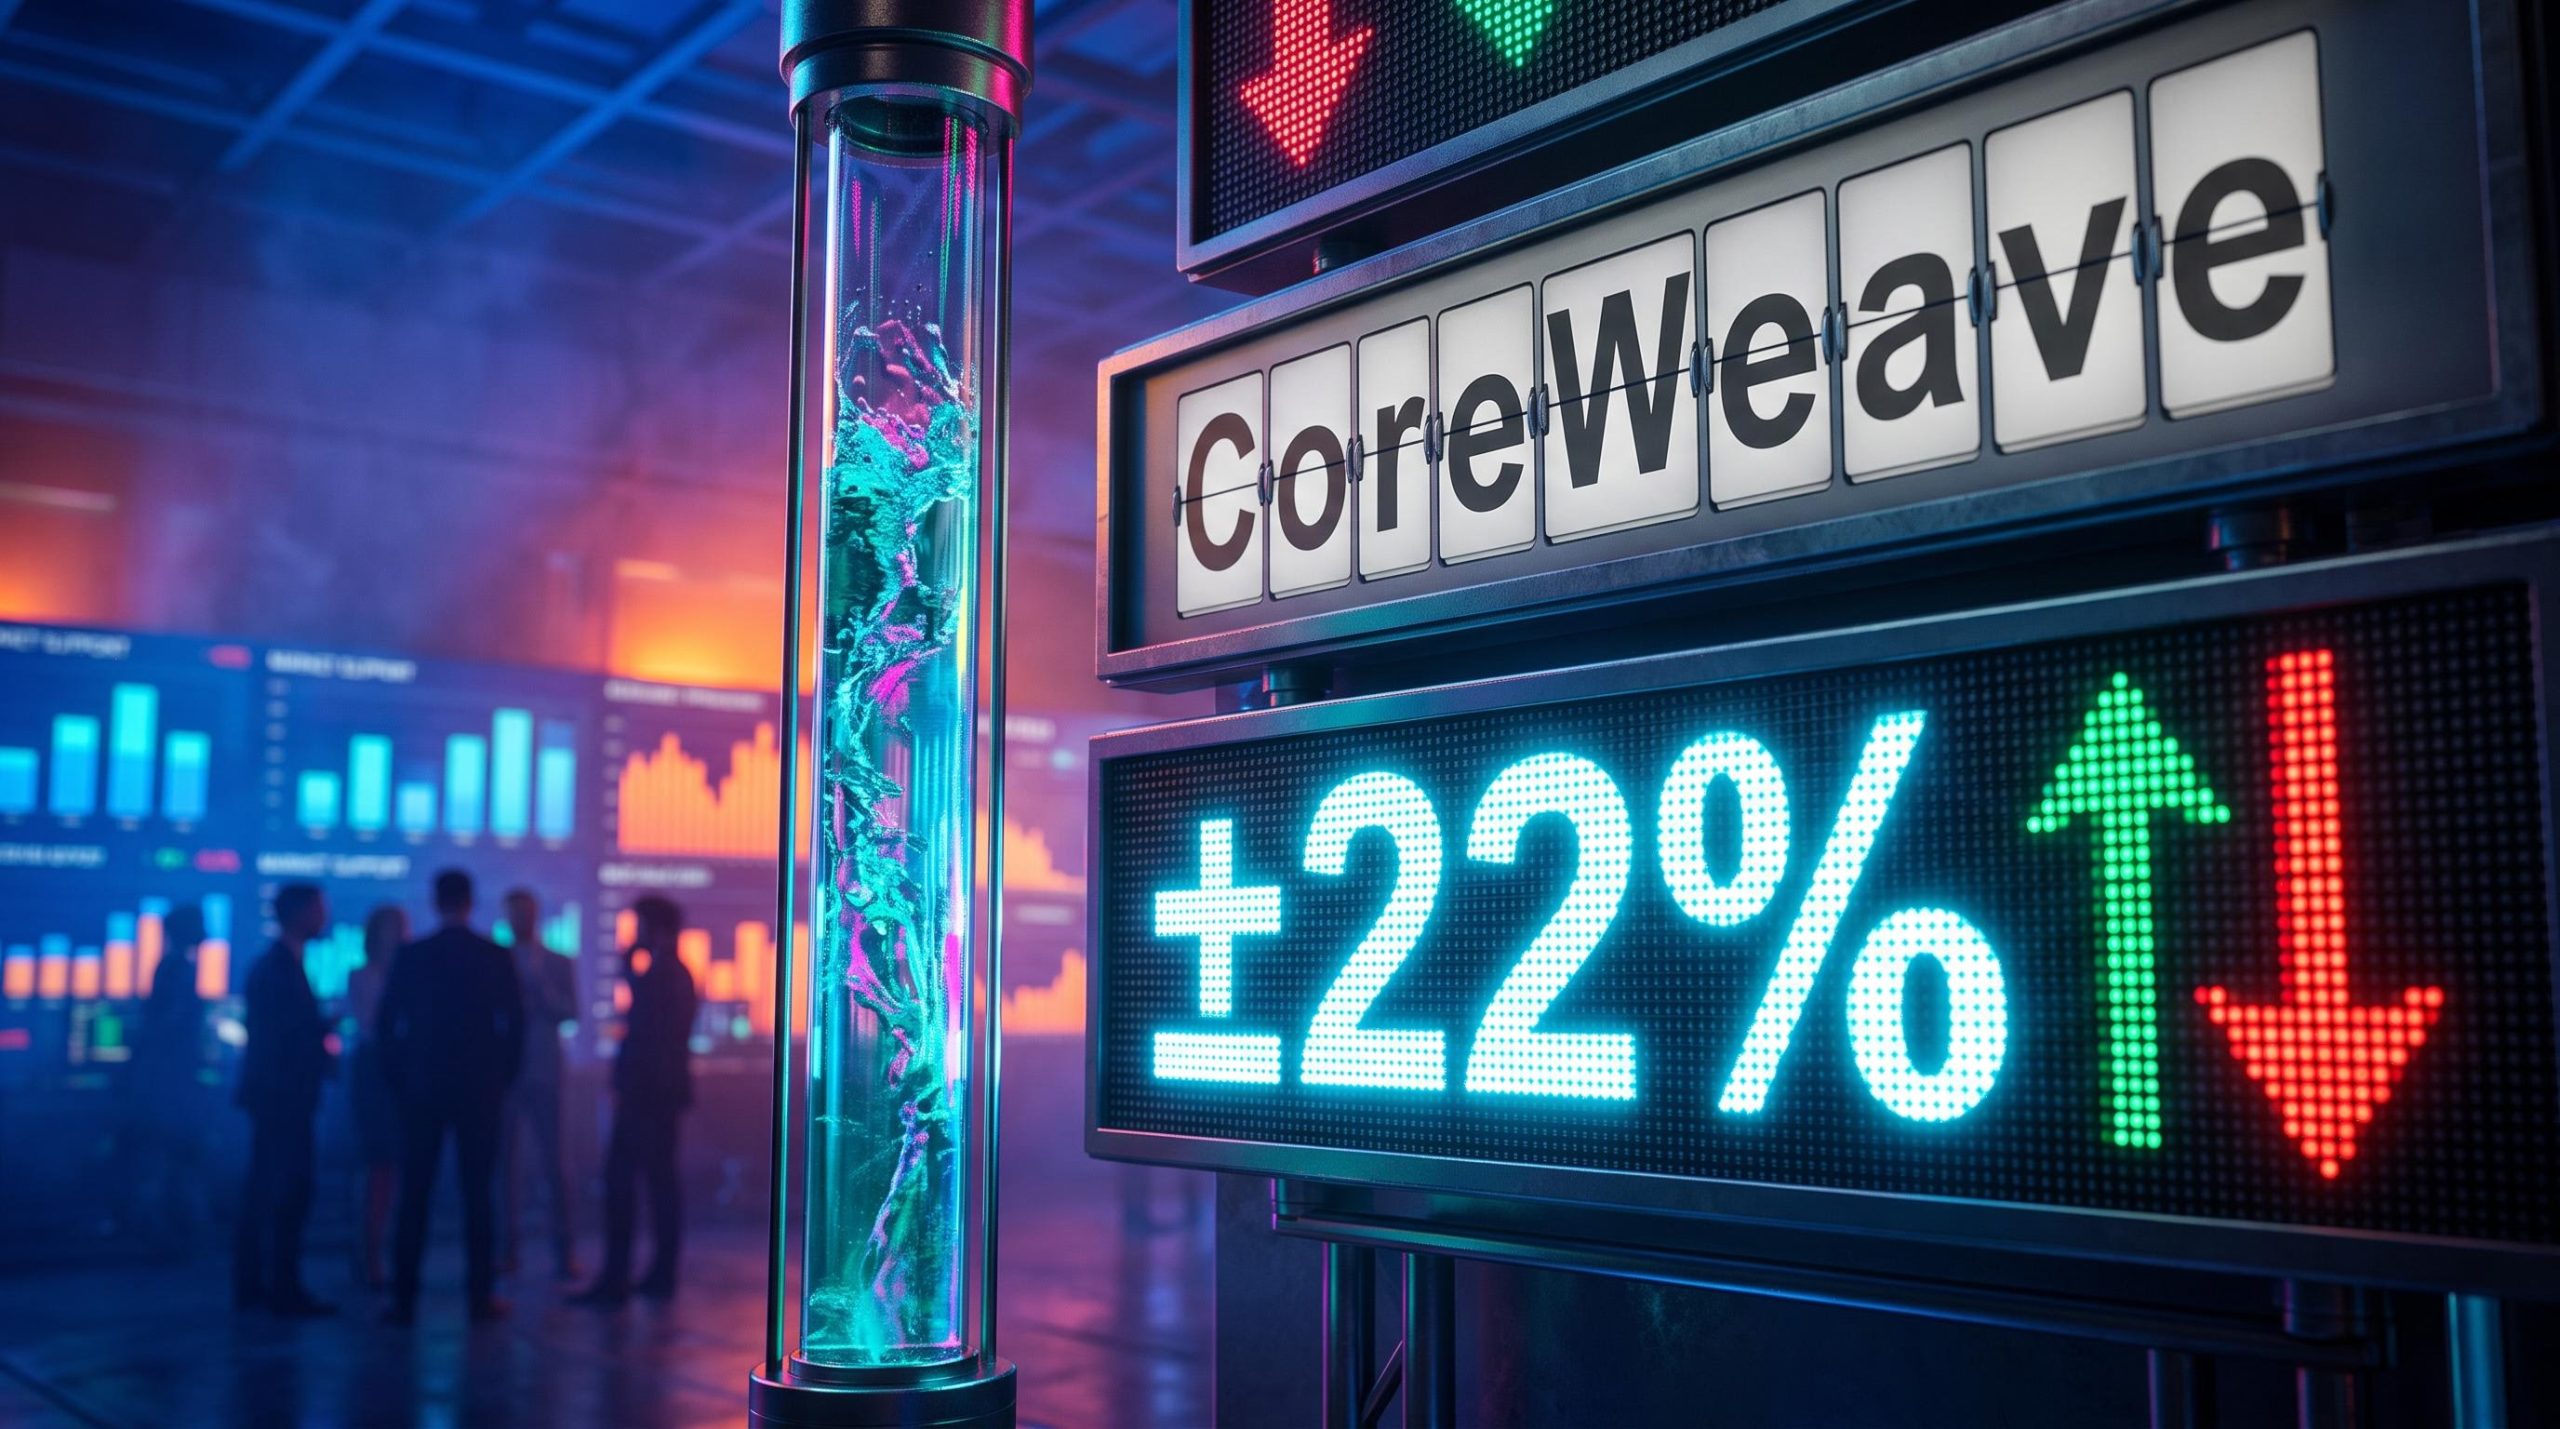
The second question asked which way CoreWeave would move. The group’s answer: either way, but within the roughly 22% implied band. Initial support for both up and down narrowed as arguments were traded, without one side winning clearly.
The disconnect The crowd named CoreWeave the likeliest of five stocks to jump, yet could not say it expected the stock to rise. Many participants appear to have read the first question as “biggest move in either direction”.
The hosts acknowledged that how a question is worded shapes the answer. By the time the segment aired, CoreWeave’s implied move had eased to about 16.1% (roughly $7.90) following a market rebound.
The third question asked whether the S&P 500 would finish the week above the prior Friday’s close. The group leaned slightly higher with low conviction, citing seasonal strength and the chance of a bounce after a heavy sell-off. Market data confirms that backdrop: the index fell 4.36% on 5 November, closing at 7,353.73, and the week ending 6 November closed down 0.31% despite a rebound. The broadcast’s day-by-day description does not fully match this data.
| Question | Group result | Conviction and notes |
|---|---|---|
| Biggest positive post-earnings move of five | CoreWeave | AI compute names separated; many read it as “biggest move either way” |
| CoreWeave direction | Either way, within the ~22% band | Support for up and down narrowed without a clear winner |
| S&P 500 weekly outlook | Slightly higher | Low conviction; seasonality and rebound cited |
The takeaway for you is simple. The crowd identified where the volatility is likely to be, not which way it will break.
What does an implied move of 16% to 22% actually mean?
If you read a 20% implied move as a prediction that CoreWeave will rise 20%, you have misread it. That number describes how wide the range of outcomes could be, not where the price will land.
Reading options market signals correctly means treating straddle prices and skew as a record of positioning and risk economics, so a wide implied band tells you how much protection traders are paying for, not which way the stock is expected to break.
Implied volatility is the level of future price movement that option prices suggest traders expect. The expected move is commonly estimated from the price of an at-the-money straddle, which is a call and a put bought at the current share price. A one-standard-deviation move is conventionally read as a range covering roughly two-thirds of likely outcomes.
Option premiums usually climb before earnings and drop sharply once the result is out. That drop is called IV crush, and it is why buying options after an event has passed is cheaper than buying them beforehand.
Published estimates for this report vary by method and timing: about 20.89% (TradingView/Benzinga), 19.76% (Benzinga) and about 13% (Bloomberg data via Investing.com). TradingNews put CoreWeave’s average absolute move over the prior four quarters at about 16.75%.
| Earnings date | Actual move | Implied move | Actual vs implied |
|---|---|---|---|
| 14 May 2025 | +21.1% | 15.1% | Larger |
| 12 August 2025 | +11.1% | 14.3% | Smaller |
| 10 November 2025 | -33.9% | 12.2% | Larger |
| 26 February 2026 | -16.6% | 15.2% | Larger |
| 7 May 2026 | 0.0% | 13.2% | Smaller |
| 11 August 2026 | +25.6% | 11.7% | Larger |
Source: Investing.com. The actual move beat the implied move in four of six reports, with two large drops and two large gains among them. For you, that means the options market has been wrong in both directions, so direction needs separate evidence. Past performance does not guarantee future results.
Why the numbers keep surprising
CoreWeave’s swings come from a business pulling hard in two directions at once:
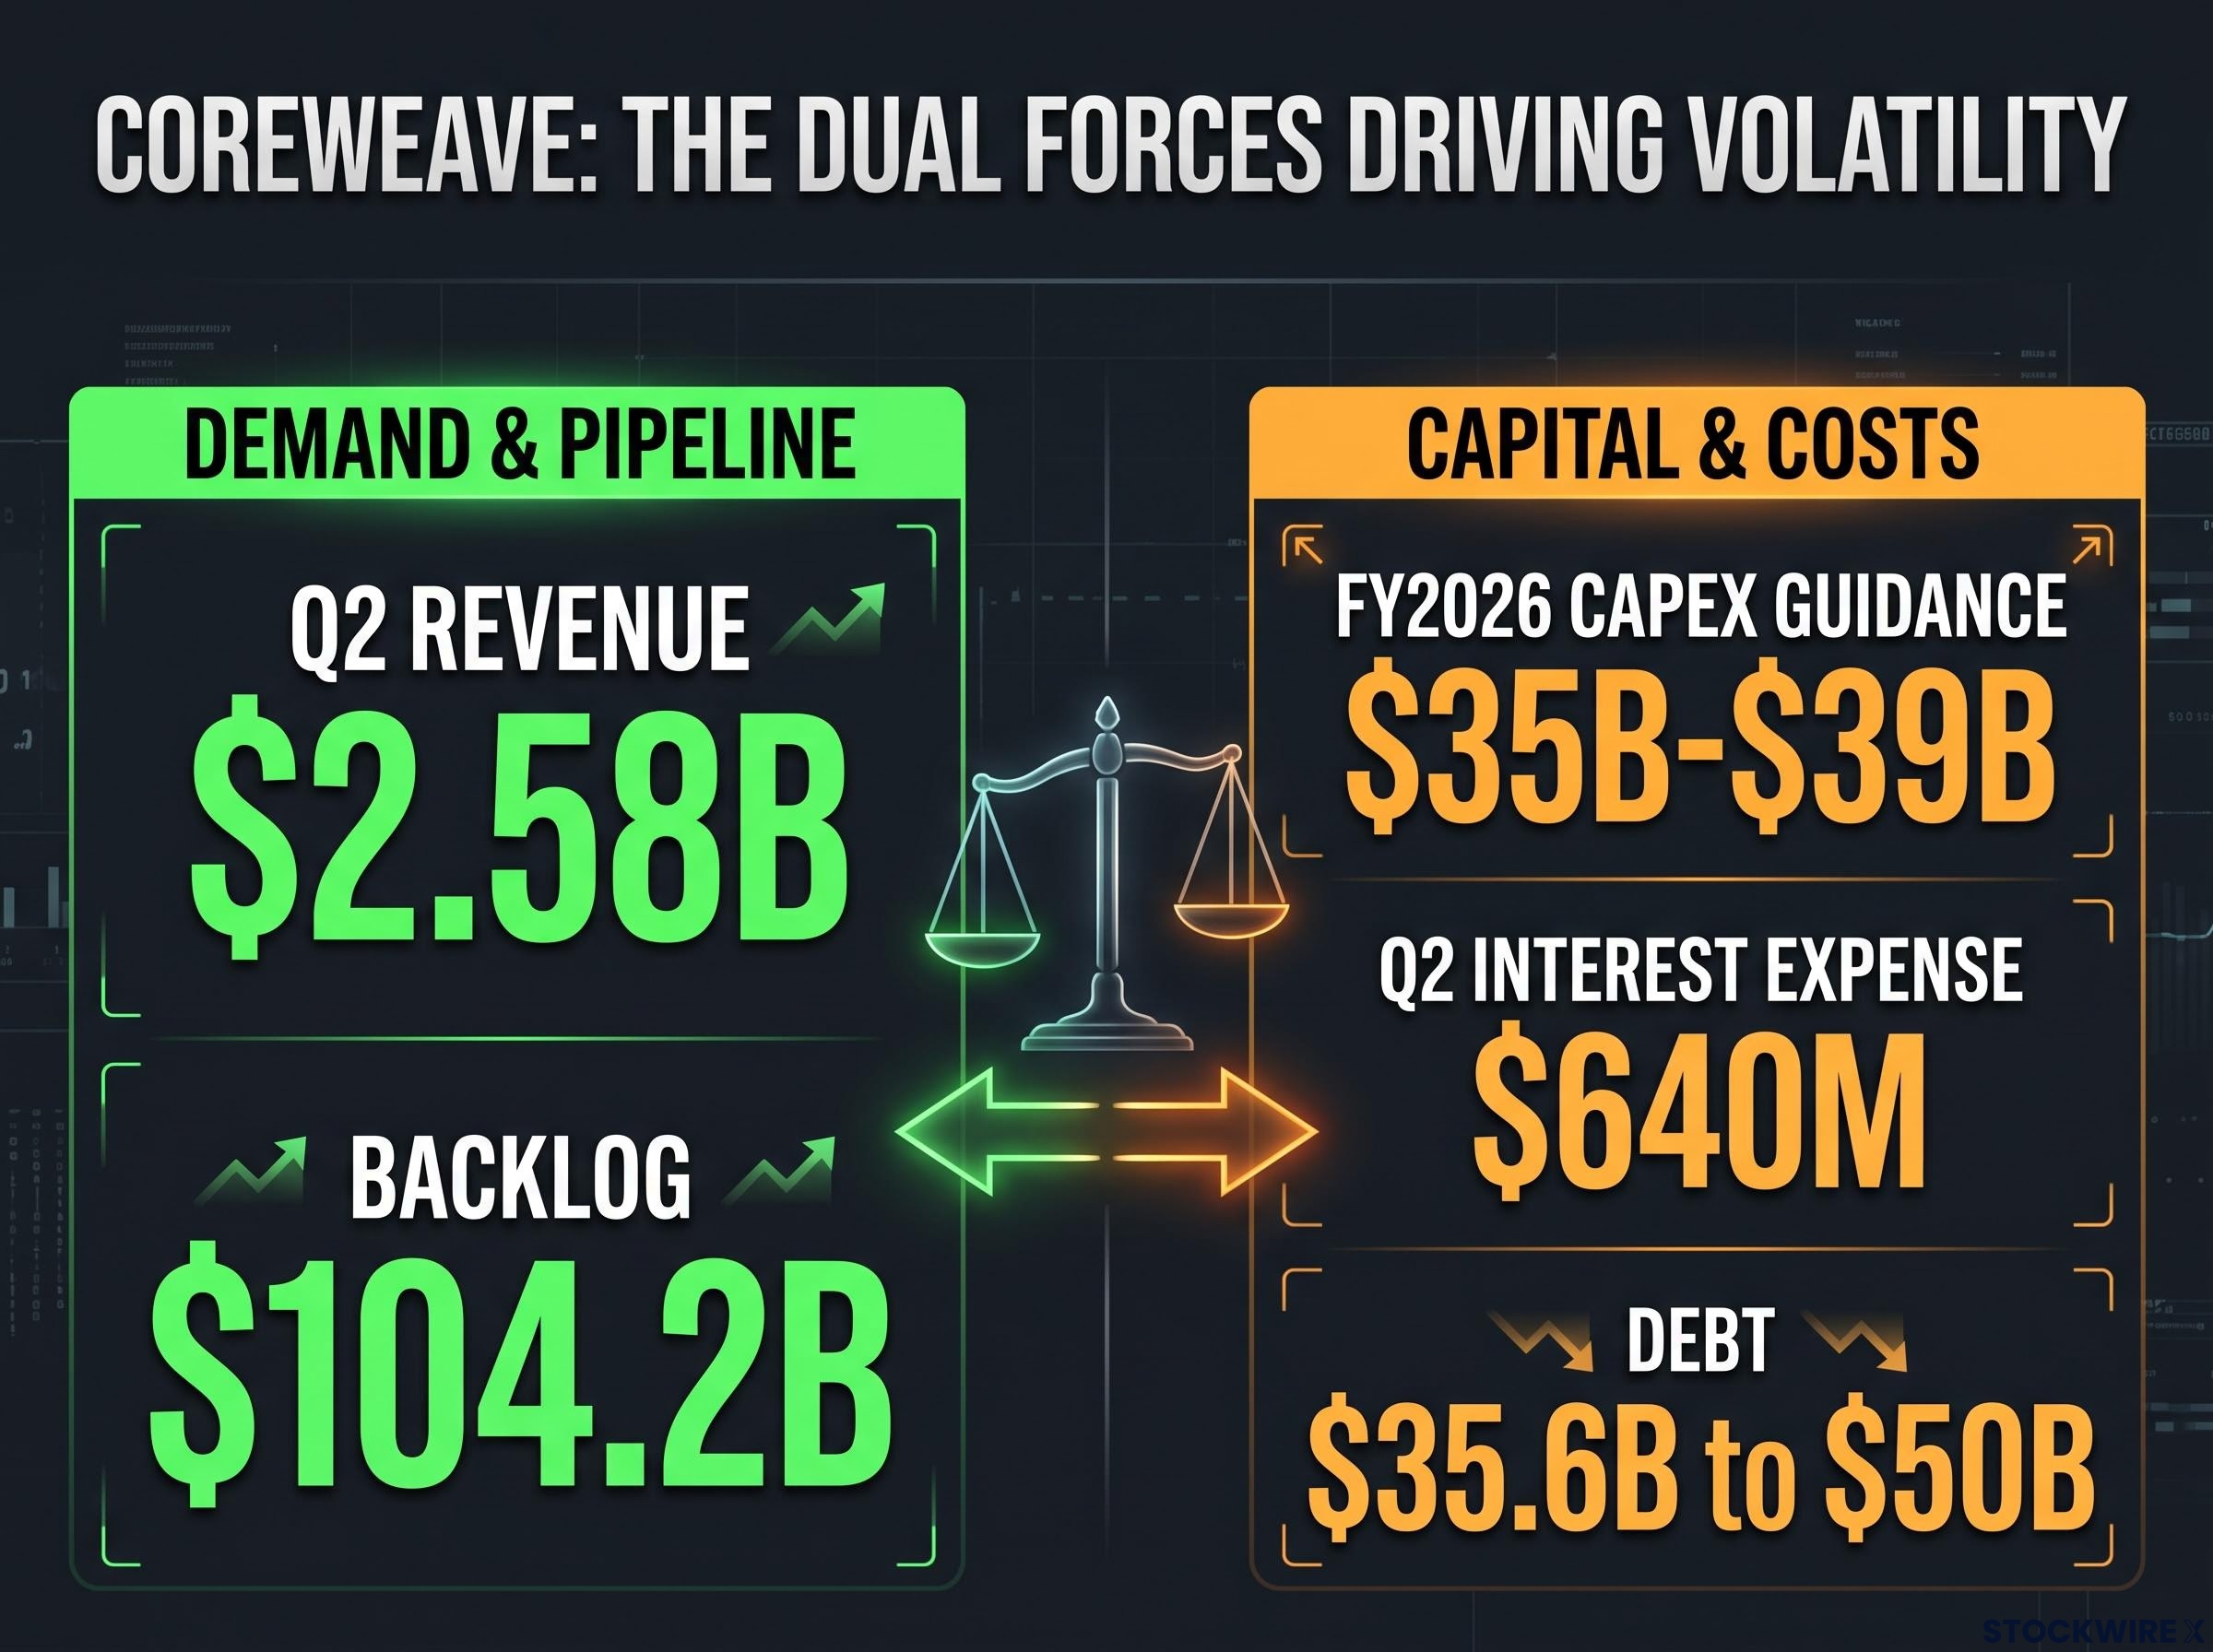
CoreWeave balances massive demand metrics like a $104.2B backlog against staggering costs like $35B-$39B in FY2026 Capex guidance.
- Demand: Reuters reported Q2 revenue of $2.58B on 11 August 2026, more than double a year earlier; sceptics note revenue depends on customers taking delivery on time.
- Backlog: About $104.2B at 30 June, per Reuters; backlog is not yet recognised revenue and relies on construction and power coming online.
- Capex: Guidance for FY2026 rose to $35B-$39B, according to Reuters; that expands capacity but raises funding needs.
- Financing: TheStreet reported Q2 interest expense of $640M on 9 November 2026; debt figures differ by measure, from about $35.6B in principal to near $50B in other Reuters reporting.
Each report forces the market to reprice all of these at once, which is why the reaction can dwarf what options anticipated.
Is crowd consensus a confirming signal or a contrarian one, and how far can you trust it?
The same consensus can be read three ways, and each points you towards a different conclusion:
- Already priced in: A big expected move needs an unusually big surprise to exceed it. The hosts said the CoreWeave consensus may already be priced in, which could make the other side cheaper.
- Confirming signal: High implied volatility may correctly reflect real uncertainty about earnings, financing and guidance.
- Contrarian signal: When options are expensive and positioning is one-sided, a merely good result can disappoint.
A swarm is different from a poll because participants signal how strongly they hold a view and respond to each other as it shifts. Unanimous AI has published studies showing gains from this approach, though they were run by or with the company and do not validate this CoreWeave session.
| Study | Individual accuracy | Swarm accuracy |
|---|---|---|
| Financial forecasting (four indices, 14 weeks) | 61% | 77% |
| English Premier League (50 games) | 55% | 72% |
| College football (10 games) | 50% (poll 60%) | 70% |
Ilia argued that understanding how crowds respond to news beats macro or market-structure insight, because reactions turn on mood.
The hosts’ view Bulls might buy a CoreWeave dip; bears might see the remaining optimistic holders as fuel for further selling. Same sentiment, opposite trades.
Where sentiment tools fall short
Daniel Kahneman’s work shows groups stay vulnerable to availability, anchoring and overconfidence. Philip Tetlock’s research on superforecasting stresses calibration and frequent updating, habits a swarm may amplify but cannot create. The limits are concrete:
- Selection bias: Volunteers from an options-trading community lean towards high-volatility names.
- Small sample: Around 50 people is a useful signal, not a robust forecast.
- Correlated information: If everyone read the same headlines, the crowd simply echoes them more confidently.
- Direction versus magnitude: This session found size, not direction.
- Replication: Favourable results come largely from company-linked studies.
- Costs: No edge is guaranteed after spreads and expensive options.
Other tools carry similar caveats. The AAII survey measures opinion, not positioning; put/call ratios and skew can reflect hedging as much as conviction. November’s average S&P 500 gain of about 1.8%-1.9% since 1950 is a weak prior, and this November opened with a 4.36% one-day fall.
The hosts said results may differ in busier weeks and plan to repeat the exercise. Treat crowd sentiment as one input on risk and positioning, never a standalone trade signal, and size your decisions with that in mind.
What to watch once CoreWeave reports
The crowd’s view (big mover, uncertain direction) matched the evidence. Options pricing and CoreWeave’s own history support expecting an exceptional move, not forecasting which way it goes.
Q3 actuals, the 24-hour reaction and the S&P 500’s weekly outcome were not available at the time of writing and are not asserted here. Once the numbers land, check three things:
- Realised versus implied: Did the move exceed the roughly 16%-21% band, as it has in four of six prior reports?
- Guidance and financing: Watch capex plans and any commentary on debt and funding costs.
- Volatility collapse: See whether implied volatility falls sharply after the report.
When sentiment and options pricing agree on size but not direction, your real decision is how much risk to carry into the event, not which way to bet.
This article is for informational purposes only and should not be considered financial advice. Investors should conduct their own research and consult with financial professionals before making investment decisions.