China’s factories slipped back into contraction in October, and the miss was bigger than forecasters expected. Yet the Australian dollar, the currency most often traded as a China proxy, barely moved: AUD/USD slipped just 0.06% to 0.7028, according to FXStreet. The idea that bad China PMI data automatically sinks the Aussie took a quiet knock.
The National Bureau of Statistics (NBS) released the figures on Saturday 31 October 2026. The Reserve Bank of Australia (RBA) hands down its rate decision tomorrow, 3 November, and that timing is a large part of the story.
For anyone holding Australian dollar exposure, the gap between the data and the price is useful. That includes investors with offshore assets, importers paying in US dollars and travellers planning a trip.
Here is a practical way to judge whether the next China release deserves your attention, or whether something else is driving the currency.
What did China’s October PMI actually show?
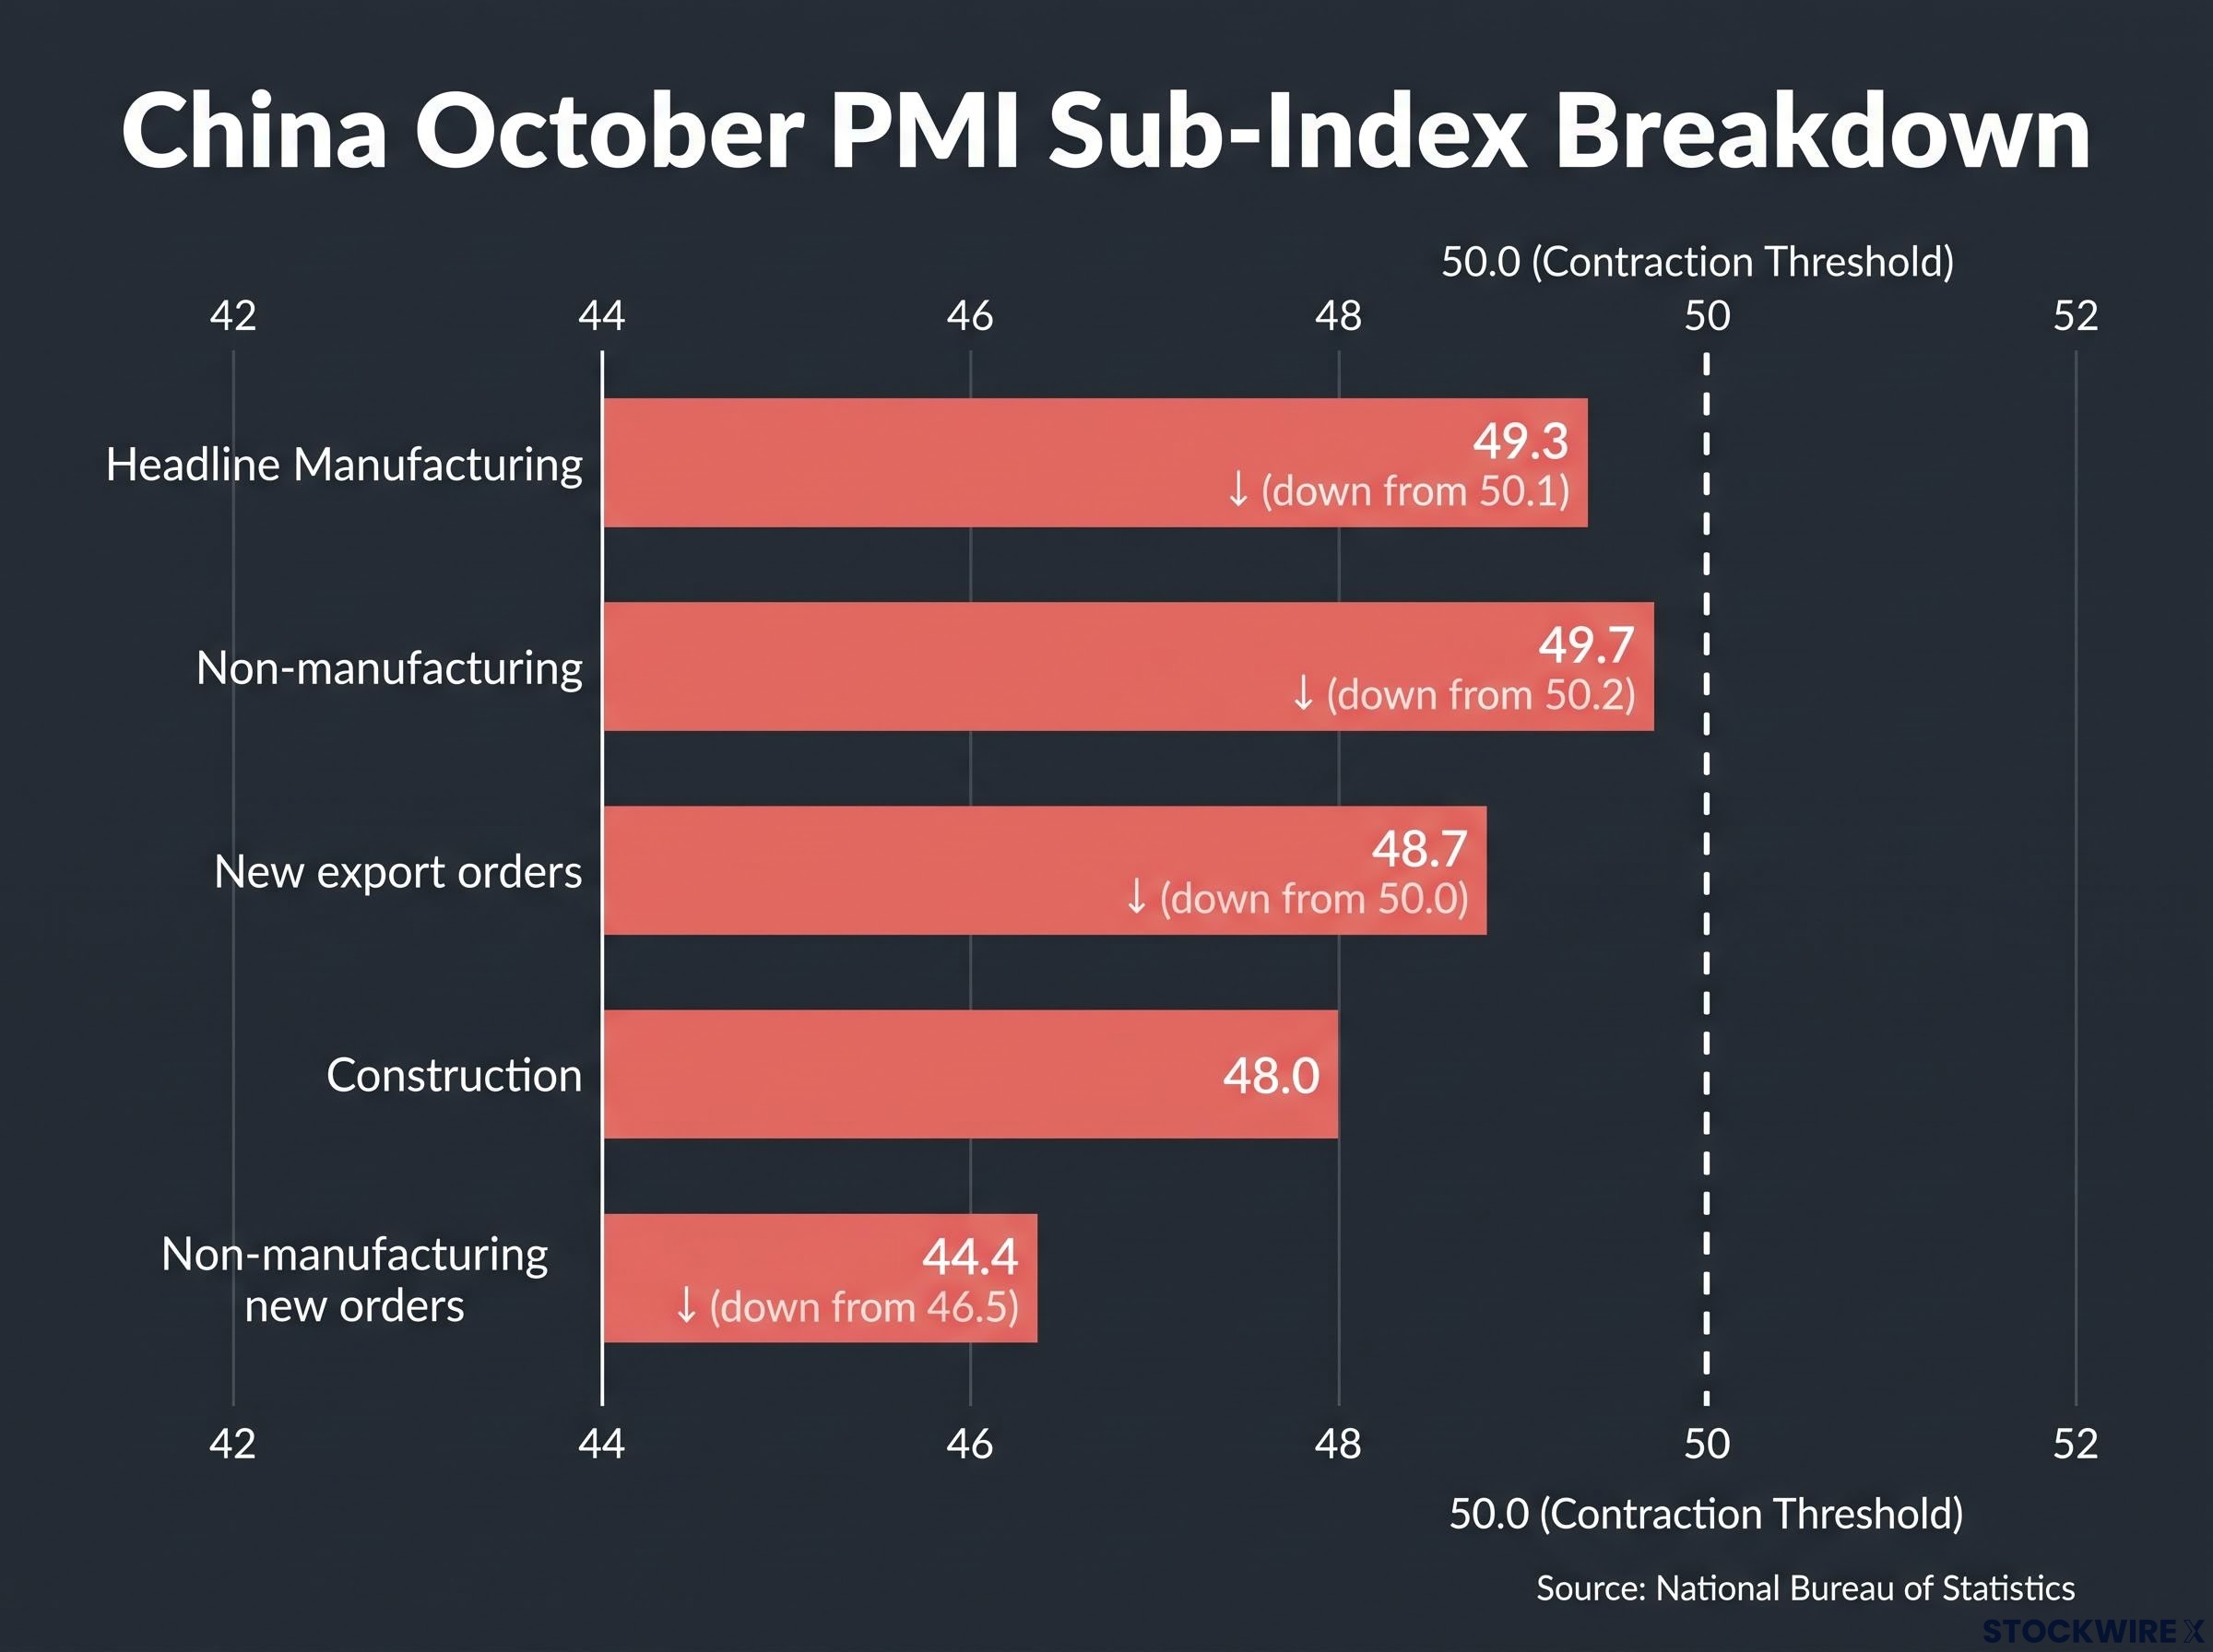
The headline came first. The official manufacturing purchasing managers’ index (PMI) fell to 49.3 from 50.1 in September, below the 50.0 consensus. A PMI is a monthly survey of business managers, and a reading under 50 signals that activity is shrinking. Reuters counted this as the third contraction in four months.
The services side followed it down. The non-manufacturing PMI eased to 49.7 from 50.2, and the composite output index dropped to 49.7 from 50.7. ING had expected only a mild softening, to 49.8 and 50.1, so the result was a larger downside surprise than forecast.
The sub-indexes are where the picture sharpens.
The habit of reading PMI data by sub-index rather than headline is what separates a useful signal from noise; new orders and prices usually lead, while the composite number simply averages everything together.
| Indicator | October | September | Signal for commodity demand |
|---|---|---|---|
| Manufacturing new orders | 49.4 | Higher (down 1.1 points) | Softer pipeline of factory work |
| Manufacturing production | 49.8 | Higher (down 1.9 points) | Output edging into contraction |
| New export orders | 48.7 | 50.0 | Weaker external demand |
| Construction | 48.0 | Not specified | Direct negative for steel use |
| Non-manufacturing new orders | 44.4 | 46.5 | Deep weakness in forward demand |
Key figure: 48.7 New export orders fell from 50.0 to 48.7, a clear contraction in overseas demand for Chinese goods.
Services held at exactly 50.0, and Reuters noted the first month of a quarter typically runs weaker. Read together, the numbers describe lost momentum, not a collapse.
The weakness sits in construction and new orders, the parts of China’s economy that consume steel. That is the channel that matters most for iron ore, Australia’s largest export, and it is the one to watch in your own reading of the data.
When big ASX news breaks, our subscribers know first
Why did AUD/USD barely react?
The Aussie was trading near 0.7025 before the release, according to FXStreet and EconoTimes, and sat at 0.7028 afterwards. The exact intraday sequence was not independently confirmed, so the safest reading is that the move was marginal.
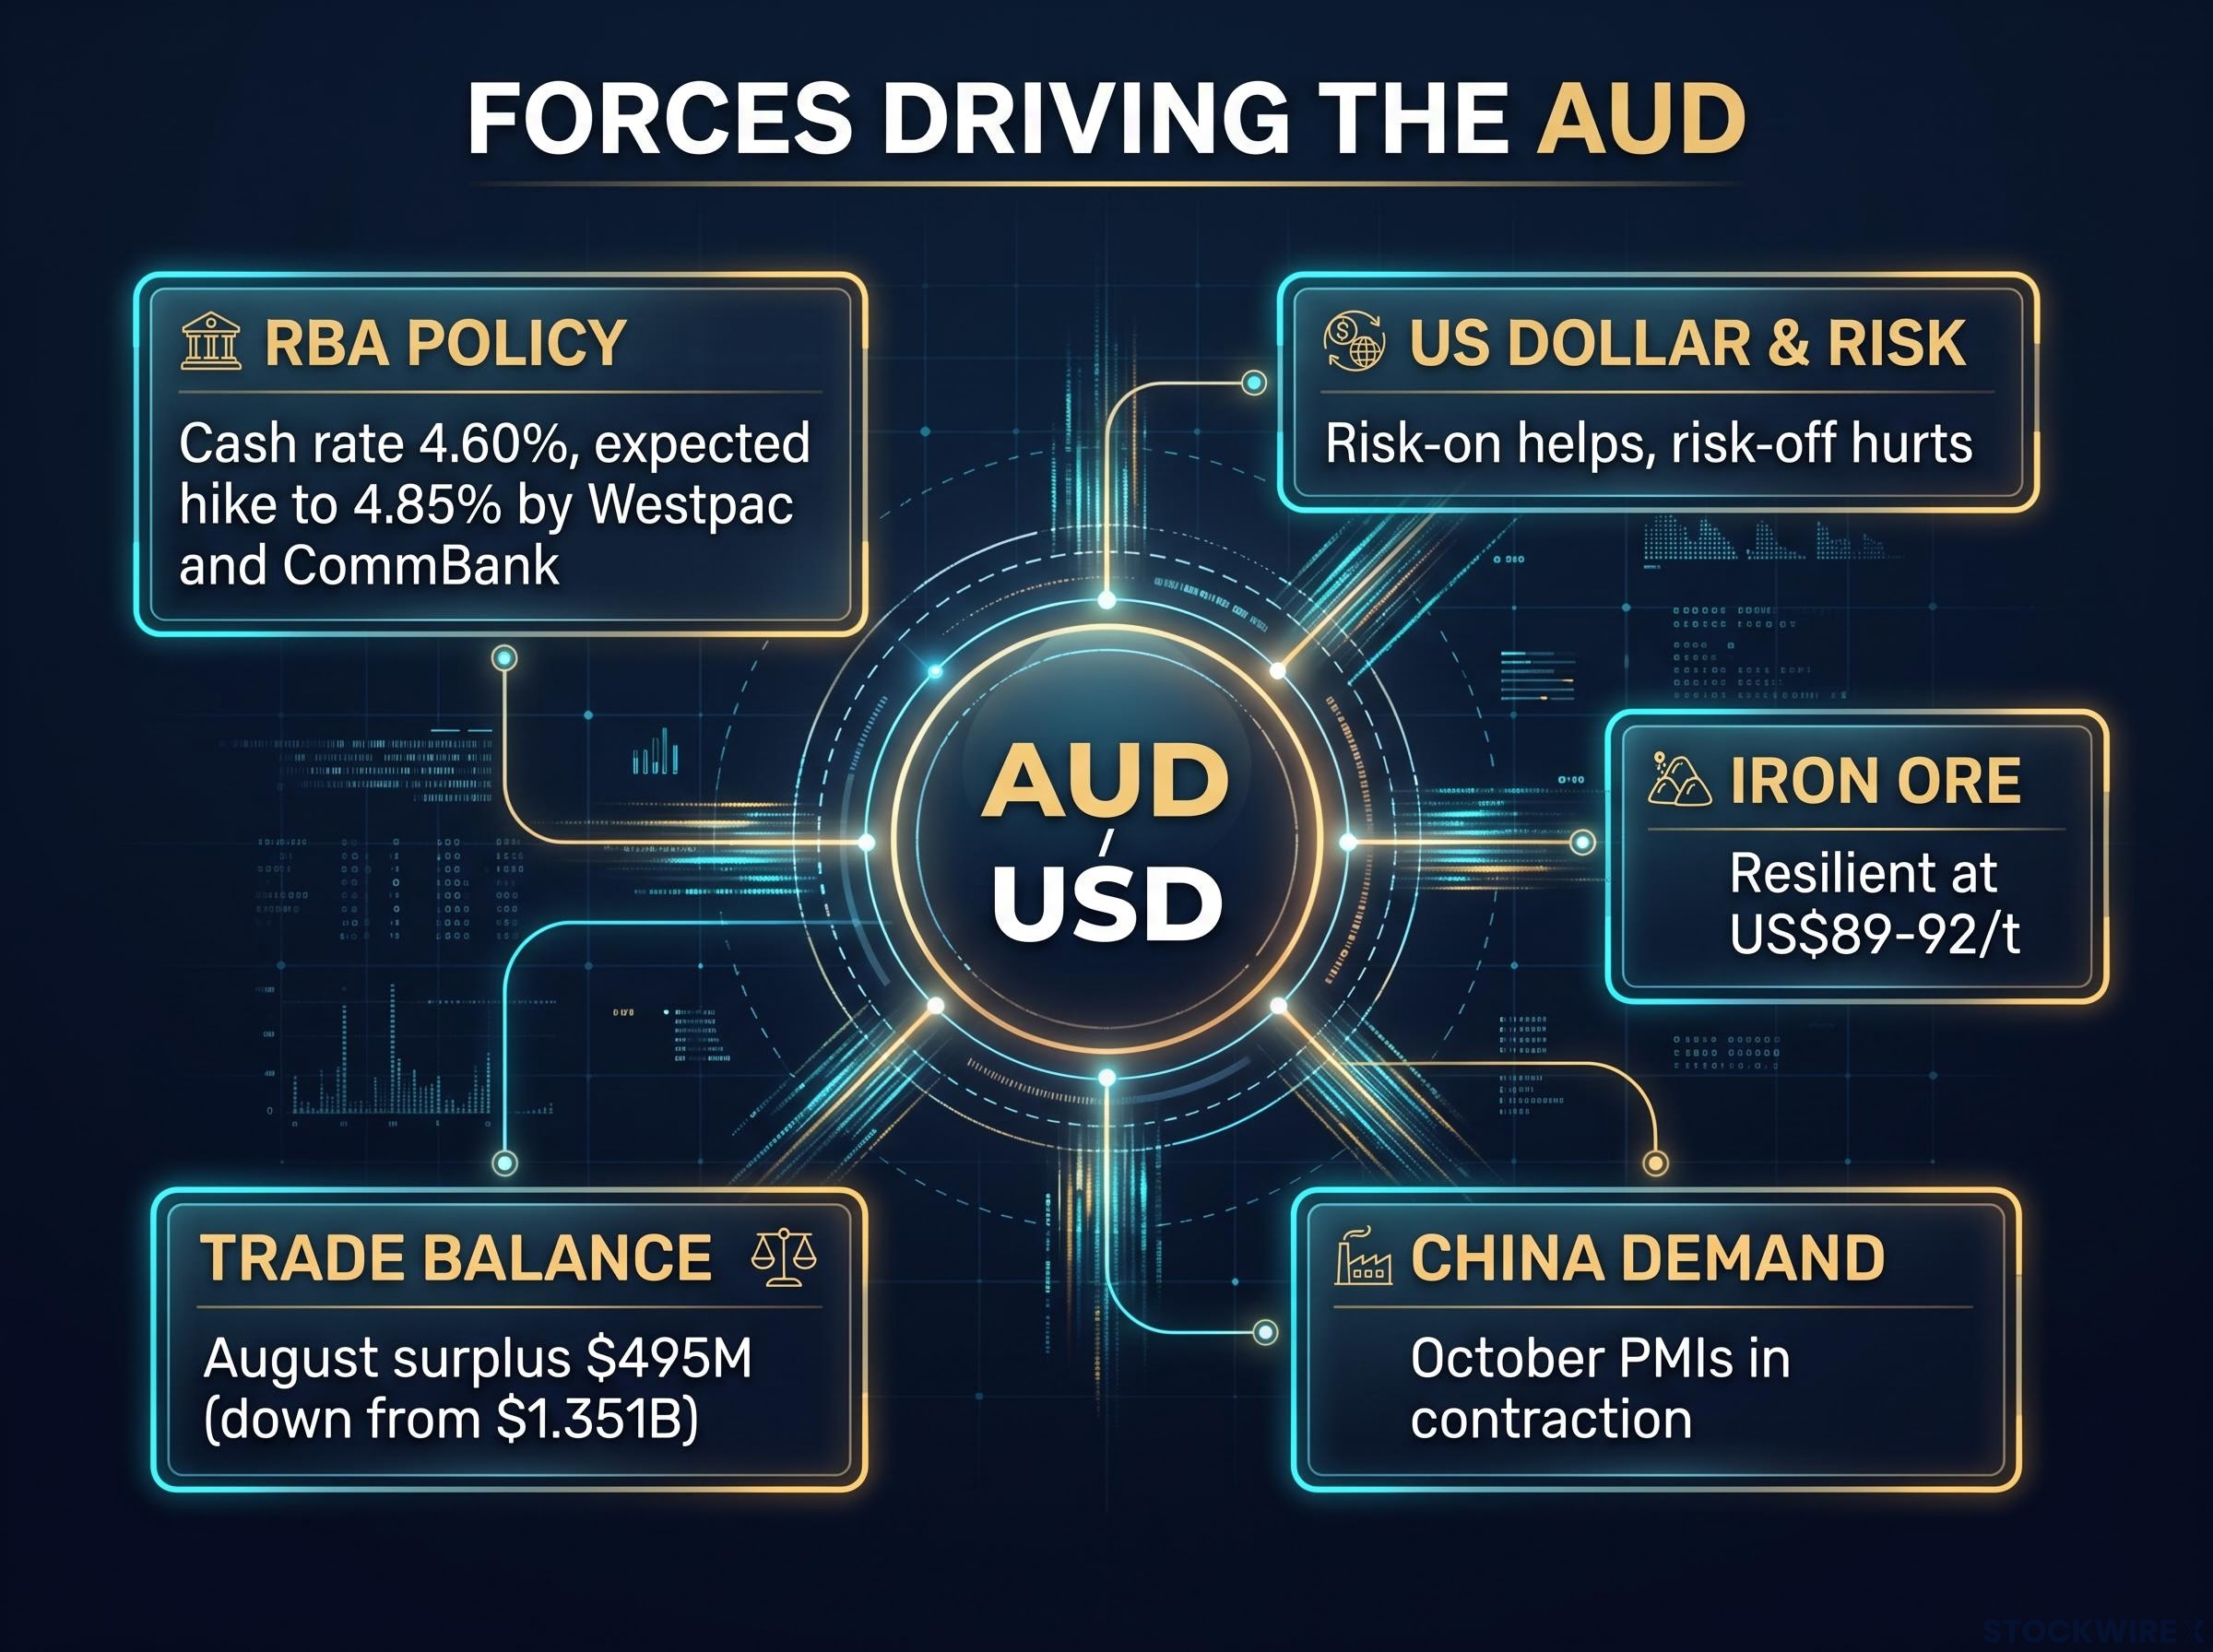
China’s data was competing with five other forces.
- RBA expectations dominated. Westpac and CommBank both expect a 25 basis point hike, from 4.60% to 4.85%, and the prospect of higher rates supports the currency.
- The miss was partly priced in. Forecasters such as ING had already pencilled in softer readings.
- The US dollar and yield gaps carry weight. AUD/USD responds to US rates and the expected spread between RBA and Federal Reserve policy.
- Iron ore held up. Singapore prices sat around US$89-92 a tonne, and Reuters reported September Chinese imports of 109.82 million tonnes, with January-September imports up 4.1% year-on-year.
- No policy shock arrived. Property weakness and soft household demand were already known, and the data could lift hopes of further support from Beijing.
The first reason does the heavy lifting. A basis point is one hundredth of a percentage point, so 25 basis points equals a quarter of a percentage point. When two of the big four banks expect the RBA to raise rates tomorrow, that yield support can easily absorb a weak overseas survey.
RBA forward guidance often moves the Aussie more than the cash rate change itself, because the statement can shift terminal rate pricing by up to 25 basis points and reprice yield support in a single session.
If you judge the Aussie only by China headlines, days like this will mislead you. Rate expectations and the US dollar can outweigh even a clear miss.
What really drives the Australian dollar?
The currency answers to several drivers at once, and their weight shifts over time. The table ranks them roughly by how much they are mattering this week.
| Driver | Effect on AUD | Current status |
|---|---|---|
| RBA policy | Higher relative rates support it | Cash rate 4.60%; hike to 4.85% expected by Westpac and CommBank |
| US dollar and risk sentiment | Risk-on helps; risk-off hurts | Competing influence on AUD/USD |
| Iron ore | Rising prices lift it | Around US$89-92/t, resilient |
| China demand | Weaker growth weighs on it | October PMIs in contraction |
| Trade balance | Surplus supports it | August surplus $495M, down from $1.351B |
The RBA targets inflation of 2-3%, and the cash rate has been 4.60% since 30 September 2026. Higher rates than other major central banks offer tend to draw money into Australian assets, which lifts the dollar.
China remains Australia’s largest trading partner. Iron ore exports were worth about $118 billion a year on 2021 data and $116.0 billion in the year to August 2026, up 0.9%, according to the WA Government. The trade balance, the gap between export and import values, shrank sharply in August, which leaves the currency leaning more on rates.
Is the AUD still a China proxy?
Partly, but less mechanically than during the commodity super-cycle, when Chinese construction and Australian export income moved almost in lockstep. Today the RBA, US dollar cycles and global risk appetite share the stage. The RBA itself reported roughly 5% trade-weighted appreciation in the Aussie since its previous statement, a measure against a basket of trading partners’ currencies.
Iron ore imports can also stay strong while the PMI weakens, because inventories, restocking and steel mill margins run on different timetables. Knowing which driver is dominant tells you whether a China miss is a genuine headwind for your AUD exposure or just background noise.
When does weak China data become a real AUD problem?
October’s print was noise for the currency this time. The harder question is what would change that, and the competing readings help answer it.
| Interpretation | Reasoning | Caveat |
|---|---|---|
| Genuine slowdown | Orders, exports, construction and services all softened | PMIs are noisy; quarter-opening months often run weak |
| Stimulus case strengthens | Falling orders and property softness raise pressure for support | Support may be gradual and targeted |
| PMI is an imperfect commodity guide | Iron ore imports stayed high | Lasting construction weakness would eventually bite |
| RBA and USD dominate | Expected hike to 4.85% adds yield support | A large China surprise can still hit risk appetite |
| Private surveys differ | RatingDog September readings of 52.1 and 51.6 | Different samples; divergence is information, not proof |
The RBA has described Chinese policy as “moderately accommodative”, while flagging weak household credit and ongoing property softness. That points to incremental support rather than a large package that would quickly revive steel demand.
The PBoC no-easing stance reinforces the RBA’s reading of incremental support, since a central bank endorsing slower credit growth is unlikely to deliver the kind of package that would quickly revive steel demand.
The real risk sits in construction at 48.0 and non-manufacturing new orders at 44.4. If that weakness flows through to lower steel output, falling iron ore imports, rising port stockpiles and worsening property figures, the transmission to the Aussie strengthens.
One weak PMI should shift your view only modestly. A run of weak property, steel and import data would justify treating downside risk to the dollar more seriously.
How to read the next China data release
The checklist below turns the analysis into a routine you can run on release morning.
| Release | What to examine |
|---|---|
| Official manufacturing PMI | New orders, export orders and production, not just the 50 line |
| Non-manufacturing PMI | Construction first, then services and new orders |
| Customs trade data | Iron ore and coal imports, export growth |
| Industrial production | Whether survey weakness shows up in actual output |
| Property data | Starts, sales and investment, which link to steel more directly than the PMI |
| Policy announcements | Whether support is broad or narrowly targeted |
Pair every China check with the Australian side of the ledger: RBA pricing, local inflation and jobs figures, US yields, iron ore prices and global risk appetite. A weak China survey often fades within a day if those variables point the other way.
Signals that turn a weak PMI into lasting pressure on the dollar:
- Falling steel production
- Lower iron ore imports or rising port inventories
- Weaker exports and industrial output
- Deteriorating property sales, starts or investment
- Policy signals that Beijing sees a deeper slowdown
Weak surveys matter most when hard data confirms them. Running this list means you judge each print by what it changes for iron ore and the RBA path, not by the headline alone.
Weighing China, iron ore and the RBA before the next move
October’s PMI was clearly negative for China’s growth story, with new orders, export orders and construction all soft. For the Australian dollar, it amounts to a moderate headwind rather than an automatic signal to expect a sharp fall.
Tomorrow’s RBA decision is the immediate test. If the bank delivers the hike Westpac and CommBank expect, yield support may keep China’s softness in the background. If it holds, the weak data could carry more weight.
If the RBA holds tomorrow, the question becomes whether it keeps its tightening bias or softens it, since a neutral signal can weaken the Aussie within the same session and give China’s soft data more weight.
After that, watch China’s hard data: steel output, iron ore imports and property figures. Those numbers, not the next survey alone, will tell you whether this slowdown is spreading into the demand that pays Australia’s export bill.
This article is for informational purposes only and should not be considered financial advice. Investors should conduct their own research and consult with financial professionals before making investment decisions.