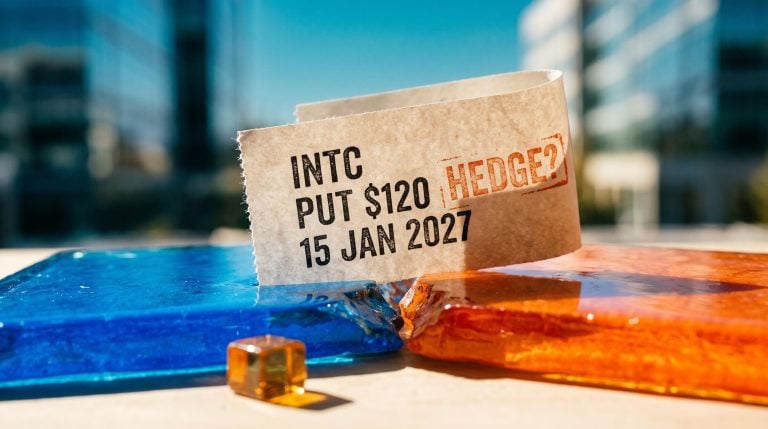
A 26% jump in quarterly revenue is not supposed to be followed by a 12% share price fall. Yet that is what happened to Meta Platforms, and the obvious explanation, that something broke in the business, misses the real signal. The market was not judging demand. It was judging how Meta plans to pay for artificial intelligence (AI), and whether today’s dip is a genuine buying opportunity depends on that question.
Meta reported Q3 2026 results on 21 October 2026. Shares closed near $697.52 that day and had slid to roughly $615-$620 by 28 October, according to Yahoo Finance, Admiral Markets and Morningstar.
The headline “$25 billion offering” is only one layer of a much larger financing structure. That structure, more than any ad metric, explains the selloff.
Here is a framework for working out whether this reset is a mispricing you can use or a fair repricing of new risks.
What actually spooked investors after a strong quarter?
Operating results
On demand, Meta delivered. Revenue reached $64.601 billion, up 26% year on year. Ad impressions rose 10% and the average price per ad climbed 14%, so Meta sold more ads at higher prices.
Margins told a different story. Morningstar put the adjusted operating margin at about 35%, down roughly 500 basis points (5 percentage points) year on year. The GAAP operating margin fell to 20% after a $9.9 billion legal charge.
The spending explains the squeeze. Q3 capital expenditure (capex, money spent on long-lived assets such as data centres) hit $34.9 billion, against $19.4 billion a year earlier, according to Fortune. Depreciation and amortisation rose to $7.154 billion from $4.963 billion, and 2026 capex guidance sits at $135-$145 billion, with no numerical forecast for 2027.
The financing signal
Meta has historically funded growth from operating cash flow and returned surplus cash through buybacks. Now it is selling shares.
| Item | Amount | Instrument | Timing/Note |
|---|---|---|---|
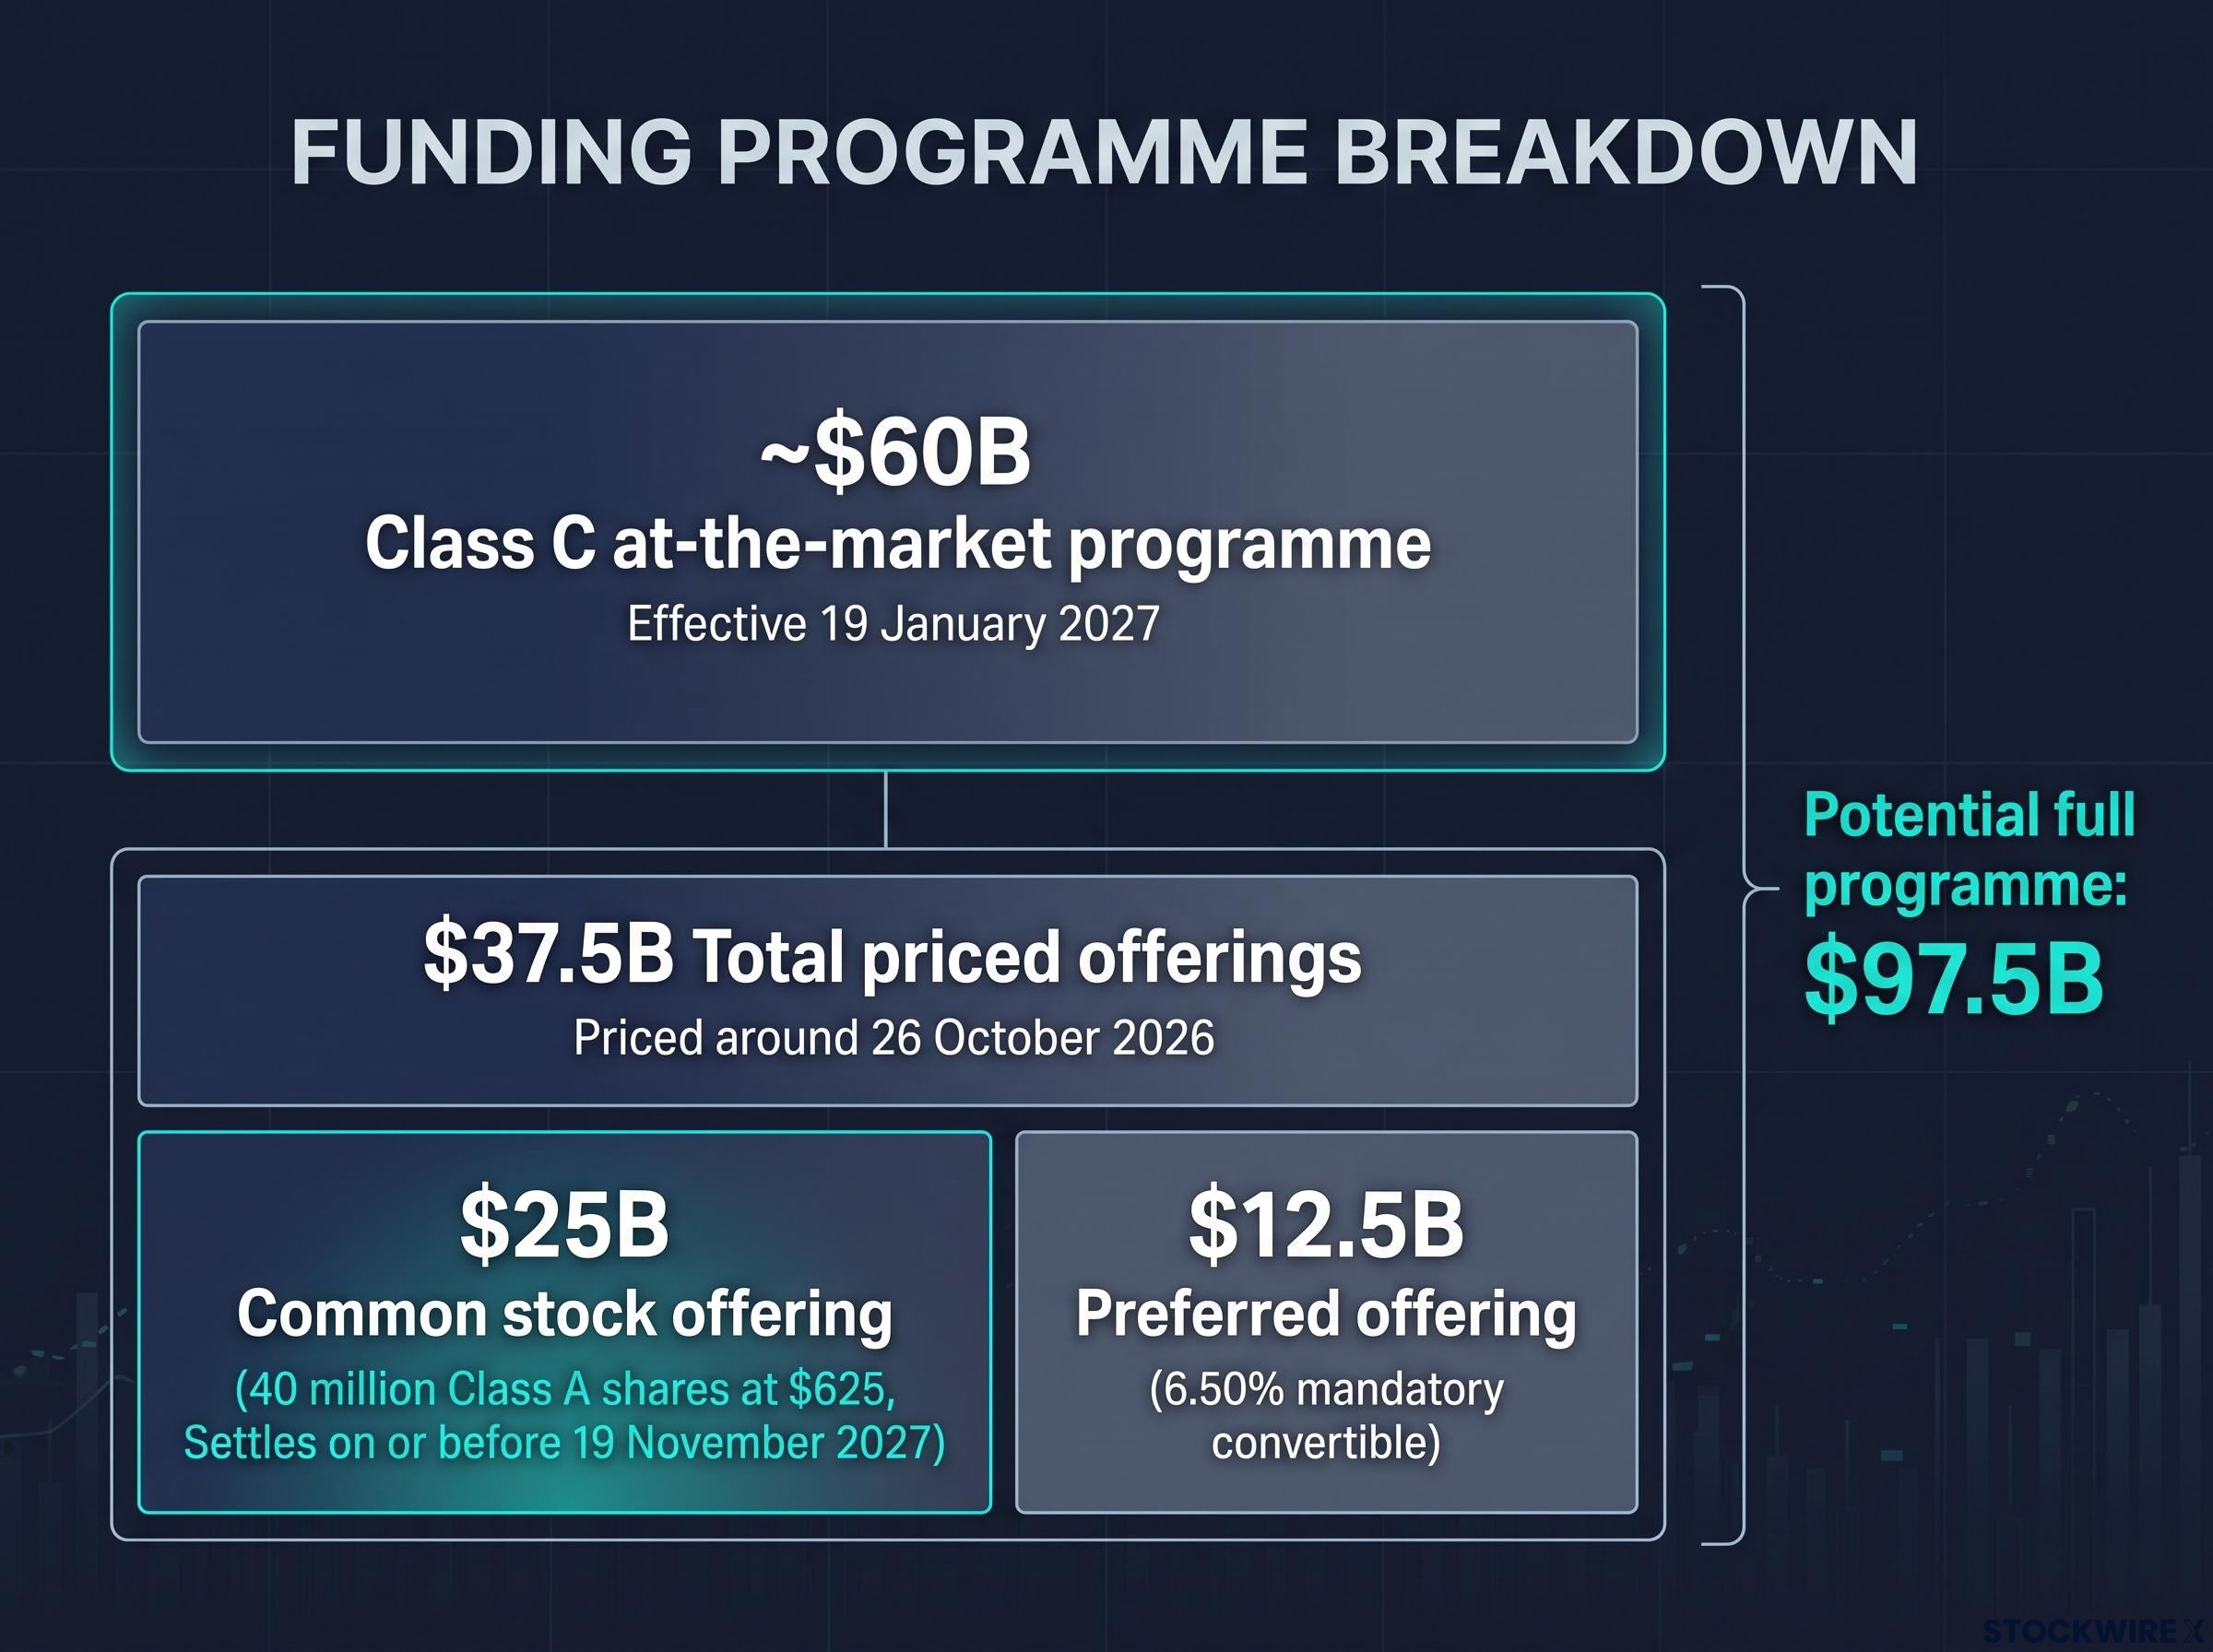
| Common stock offering | $25B | 40 million Class A shares at $625 | Forward sale, settles on or before 19 November 2027 |
| Preferred offering | $12.5B | 6.50% mandatory convertible preferred | Priced alongside common stock |
| Total priced offerings | $37.5B | Common plus preferred | Priced around 26 October 2026 |
| Potential full programme | $97.5B | Includes ~$60B Class C at-the-market programme | Class C effective 19 January 2027 |
The new Class C shares carry no votes, so Mark Zuckerberg’s control stays intact. They still add to the share count, though, which means each existing share owns a smaller slice of future earnings.
The practical cost of share dilution is that revenue growth of 26% can coexist with slower per-share earnings growth, so investors should measure the fully diluted share count in any valuation denominator before judging whether the raise is priced in.
A drop driven by funding structure and margins tells you the debate is about returns on capital. Judge the stock on that, not on ad demand.
When big ASX news breaks, our subscribers know first
How do you judge AI capex, depreciation and returns on a mega-cap?
Capex shows up first as a cash-flow figure, not a hit to profit. That timing gap is why spending can look harmless on one screen and painful on another.
When Meta buys servers or builds a data centre, the cost is capitalised, meaning it is recorded as an asset rather than an immediate expense. Depreciation then spreads that cost across the asset’s useful life, reducing reported profit each year. Spending today compresses earnings tomorrow, which is exactly what the jump in depreciation already shows.
Some returns are visible. Better AI ad ranking plausibly sits behind the 10% impression growth and 14% price gain. Others, such as frontier models, the Muse assistant and Meta’s “personal superintelligence” ambitions, remain hard to measure.
Muse drew more than 10 million users in the US and Canada within about six weeks, with roughly 25% using it on a given day, the Globe and Mail reported on 30 October 2026. Setup numbers, however, prove nothing yet about revenue, retention or margins.
Morningstar’s view Morningstar describes Meta’s monetisation beyond advertising as unproven, even as it forecasts compute and intelligence revenue rising from near $0 in 2026 to $40 billion by 2030.
Reality Labs adds pressure, with losses expected at $18-$19 billion in 2026 and about $15 billion in 2027. Morningstar notes a similar spending backlash in 2022, and hyperscalers were repeatedly sold off in 2025-2026 when capex outran monetisation. The difference now is that peers such as Microsoft and Alphabet leaned mostly on cash flow and debt, which made Meta’s equity raise read as a stronger signal.
Meta’s position is not unique: PIMCO estimates hyperscaler capex absorbing operating cash flow at 93-94%, up from 33-40% in 2022-2023, which leaves little room for buybacks and explains why equity issuance is becoming part of the funding mix.
When spending grows faster than earnings, investors pay a lower multiple until incremental revenue proves durable. That evidence is what would reverse the compression.
A five-step test
- Capex trend: Is spending accelerating, and is there a stated ceiling?
- Depreciation drag: Is depreciation growing faster than revenue?
- Visible returns: Are measurable gains, such as ad pricing, keeping pace?
- Funding source: Is the build-out paid from cash flow, debt or new shares?
- Management disclosure: Does the company give numbers for future spending and new revenue lines?
Treat user milestones as early evidence only. Anchor your view on whether incremental revenue is outgrowing depreciation.
Where do the bull and bear cases genuinely collide?
The bull case starts with a valuation gap. Morningstar’s Malik Ahmed Khan holds a $850 fair value, a 4-star rating, a wide moat and a high uncertainty rating, implying a 2026 adjusted price-to-earnings (P/E) ratio of 26x and enterprise value to adjusted EBITDA of 13x. Against a price near $615, that suggests meaningful upside.
Morningstar forecasts a 22% five-year sales growth rate and attributes the wide moat to network effects and intangible assets in the Family of Apps, while rating Reality Labs no moat. Meta ended fiscal 2025 with $82 billion in cash against $59 billion of debt, and guides Q4 revenue to $73-$76 billion.
The bear case is just as concrete. Total 2026 expenses are guided at $175-$179 billion, 2027 capex has no ceiling, dilution could reach $97.5 billion, and non-ad AI revenue is unproven.
Brokers have split along those lines:
- Piper Sandler (Thomas Champion): The raise clears an overhang by securing funding flexibility.
- William Blair: The offering may signal internal cash and debt capacity are insufficient for Meta’s AI plans.
- Mizuho, Canaccord Genuity, Wells Fargo, Citizens and Wedbush: Reported as keeping positive ratings, viewing dilution as manageable.
| Argument | Bull reading | Bear reading | Evidence to watch |
|---|---|---|---|
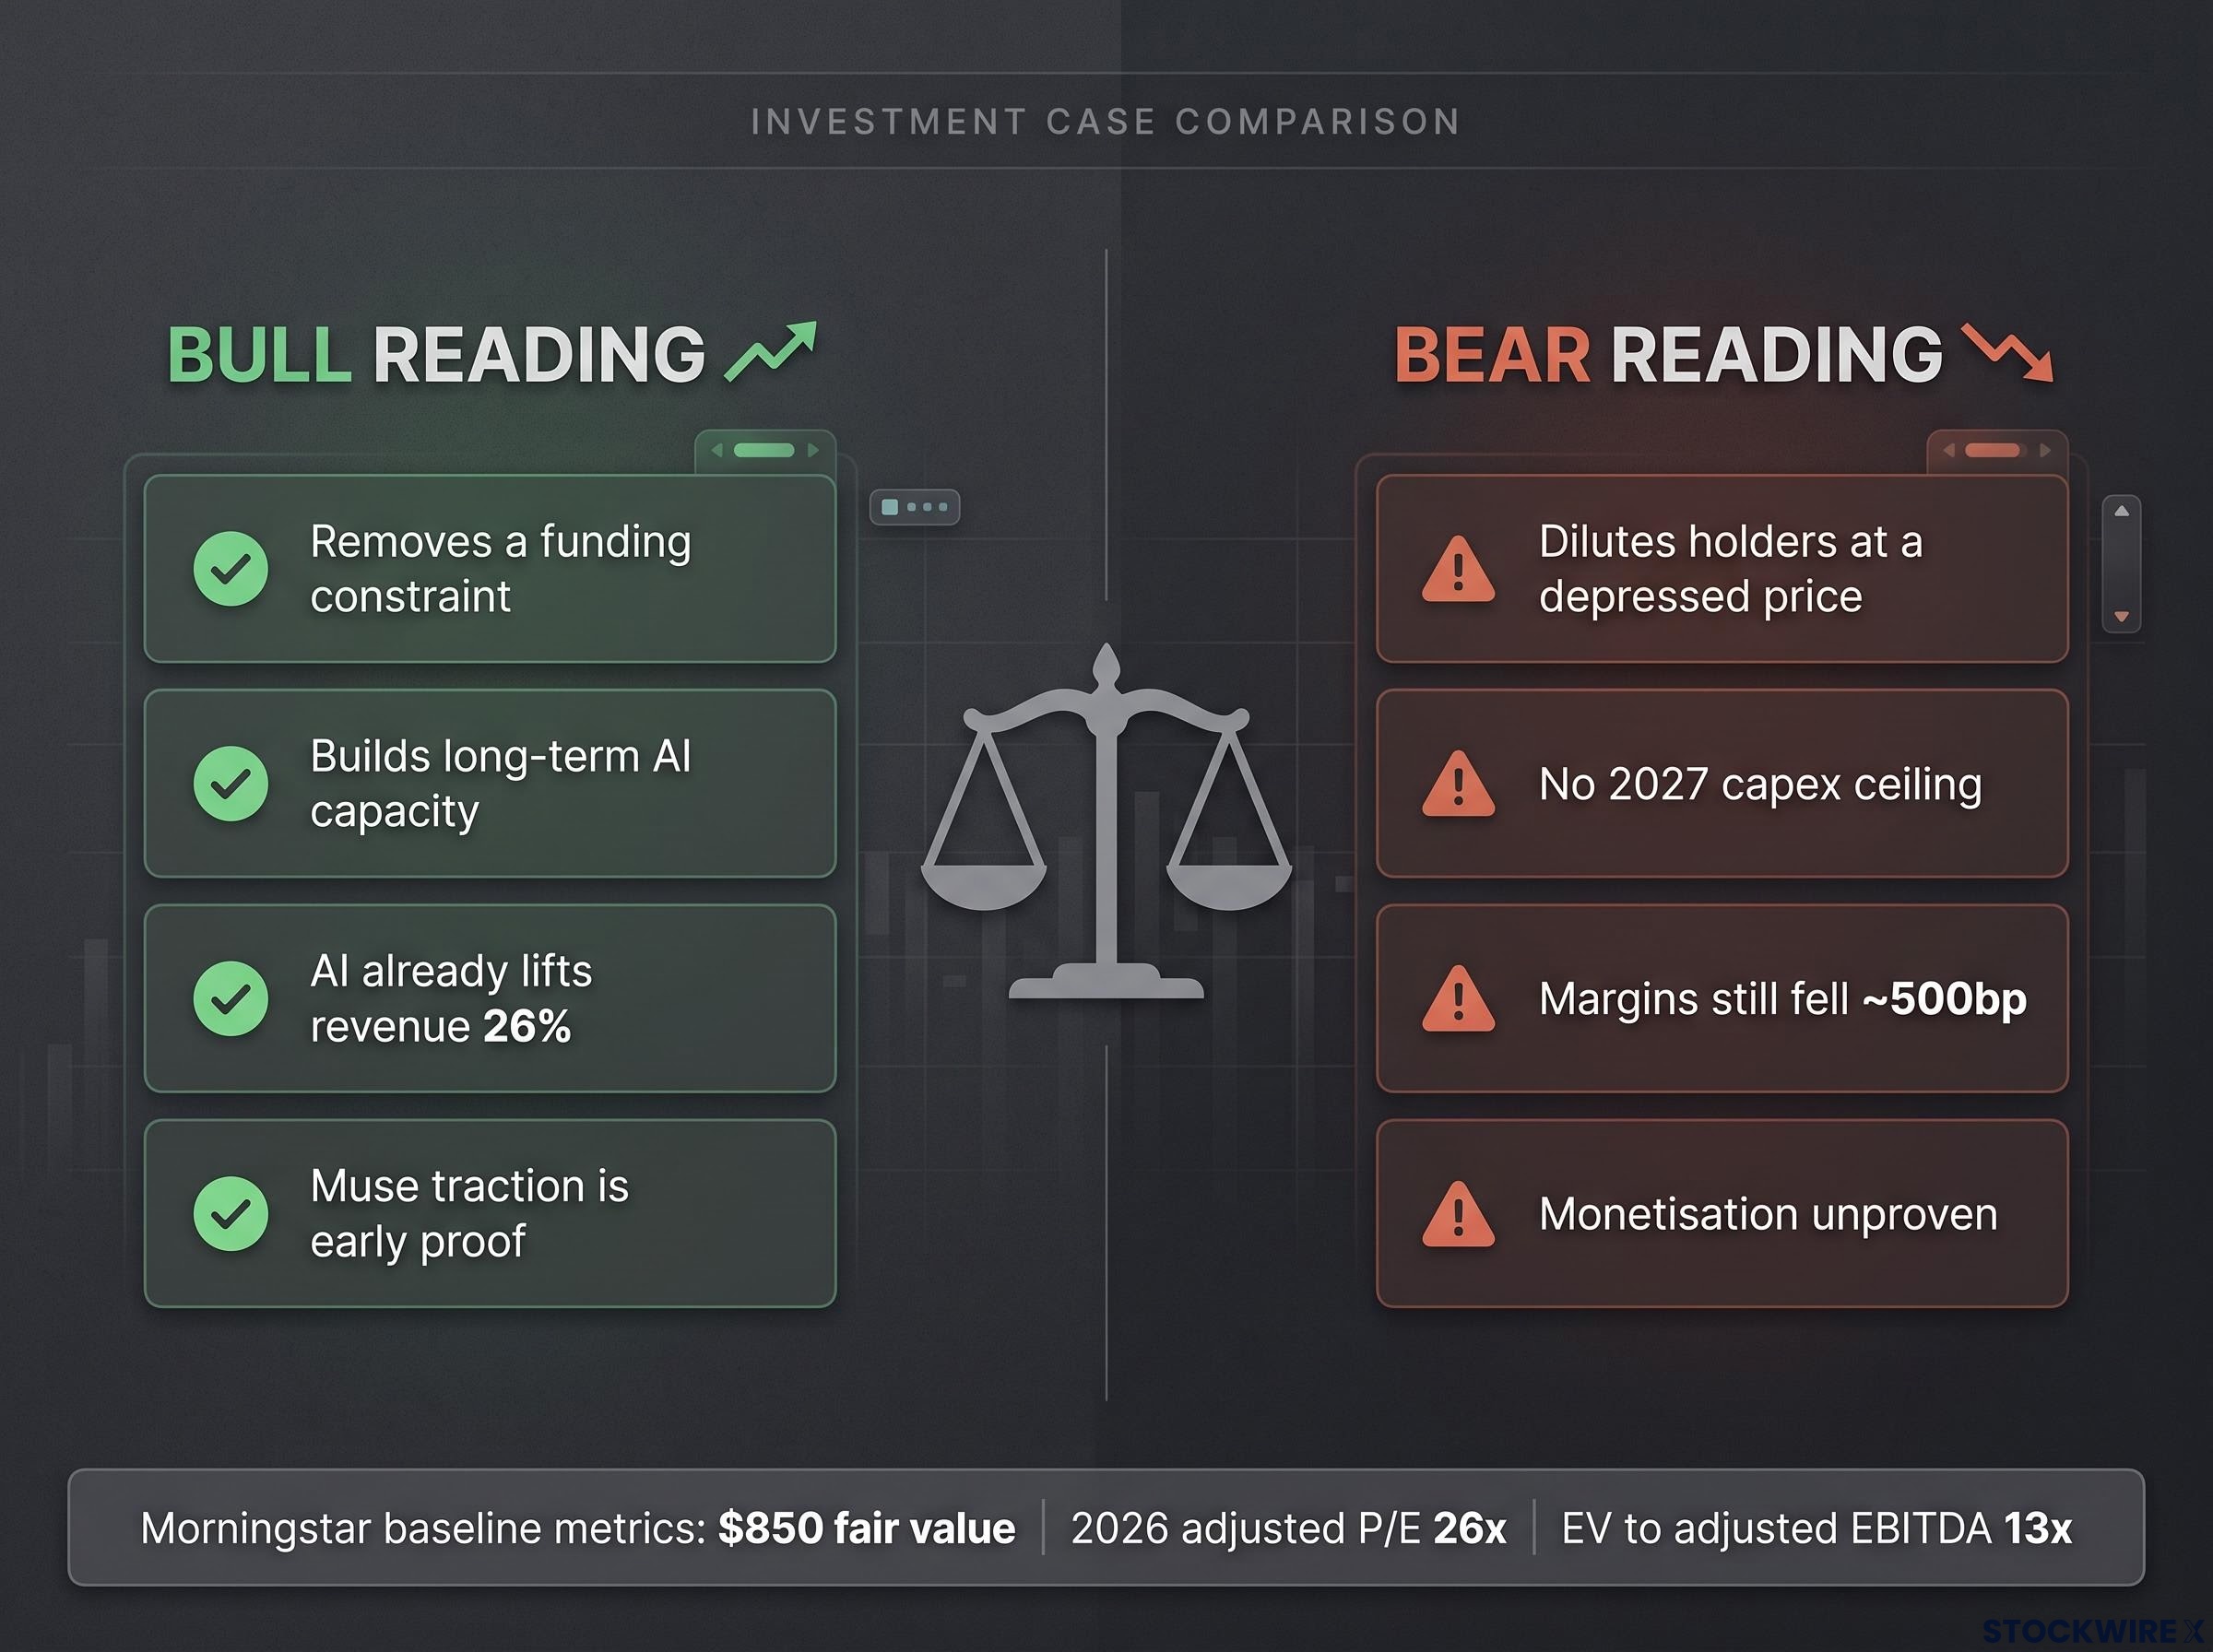
| Equity raise | Removes a funding constraint | Dilutes holders at a depressed price | Further Class C issuance |
| Capex | Builds long-term AI capacity | No 2027 ceiling | 2027 capex disclosure |
| Ad growth | AI already lifts revenue 26% | Margins still fell ~500bp | Q4 against $73-$76B guide |
| New AI revenue | Muse traction is early proof | Monetisation unproven | Disclosed non-ad revenue |
The sharpest collision is the raise itself: the same transaction reads as dilution at a low price or as the removal of a funding constraint. Your decision hinges on whether you believe the wide moat funds this build-out more cheaply than the market now assumes. Work out which side of that you sit on.
How much should legal risk change the valuation?
Legal costs did not drive the selloff, but they feed directly into why Morningstar rates uncertainty high. The sums are large enough to affect cash flow:
- Q3 2026 charge: $9.9 billion for legal proceedings.
- US states: Up to about $18 billion over a decade to settle claims from almost all states and territories over child addiction and safety (Reuters, August 2026).
- New Mexico: $567 million into a teen mental-health fund, plus age verification, teen-usage limits and AI chatbot safeguards (Reuters, August 2026).
- US appeals court: More than 3,000 social-media harm lawsuits allowed to proceed.
- European Union: A European Commission fine threat unless features change, after a preliminary Digital Services Act finding.
Why uncertainty is rated high Morningstar cites unprofitable ventures, environmental, social and governance (ESG) exposure, legal risk and unproven AI monetisation beyond advertising.
The deeper cost may sit in product design. Required safeguards and limits on teen use could weigh on engagement among younger users, and engagement is what advertisers pay for.
The scale of the teen safety settlement, up to $18 billion with the guaranteed portion paid over roughly 10 years, helps explain why the legal charge hit Q3 GAAP margins without touching the core ad engine, since users aged 13-17 generate under 1% of revenue.
Legal exposure means you should build a margin-of-safety discount into any fair value rather than treating $850 as a floor.
A decision framework before calling this a buying opportunity
Meta enters 2027 with strong operations and a wide moat, set against dilution, compressing margins and unproven monetisation outside ads. The selloff priced those risks; whether it overpriced them depends on evidence still to come.
Four checkpoints matter most:
- 2027 capex disclosure: A number, or a ceiling, would ease the free-cash-flow puzzle.
- Q4 results: Revenue against the $73-$76 billion guide.
- Depreciation trajectory: Whether revenue growth keeps outpacing it.
- Class C issuance and non-ad AI revenue: How much new stock is sold, and whether Muse or compute sales show up in reported figures.
Given the high uncertainty rating, size any conviction to your own risk tolerance. Analyst forecasts and fair values cited here are projections, not promises; past performance does not guarantee future results, and financial projections are subject to market conditions and various risk factors.
This article is for informational purposes only and should not be considered financial advice. Investors should conduct their own research and consult with financial professionals before making investment decisions.