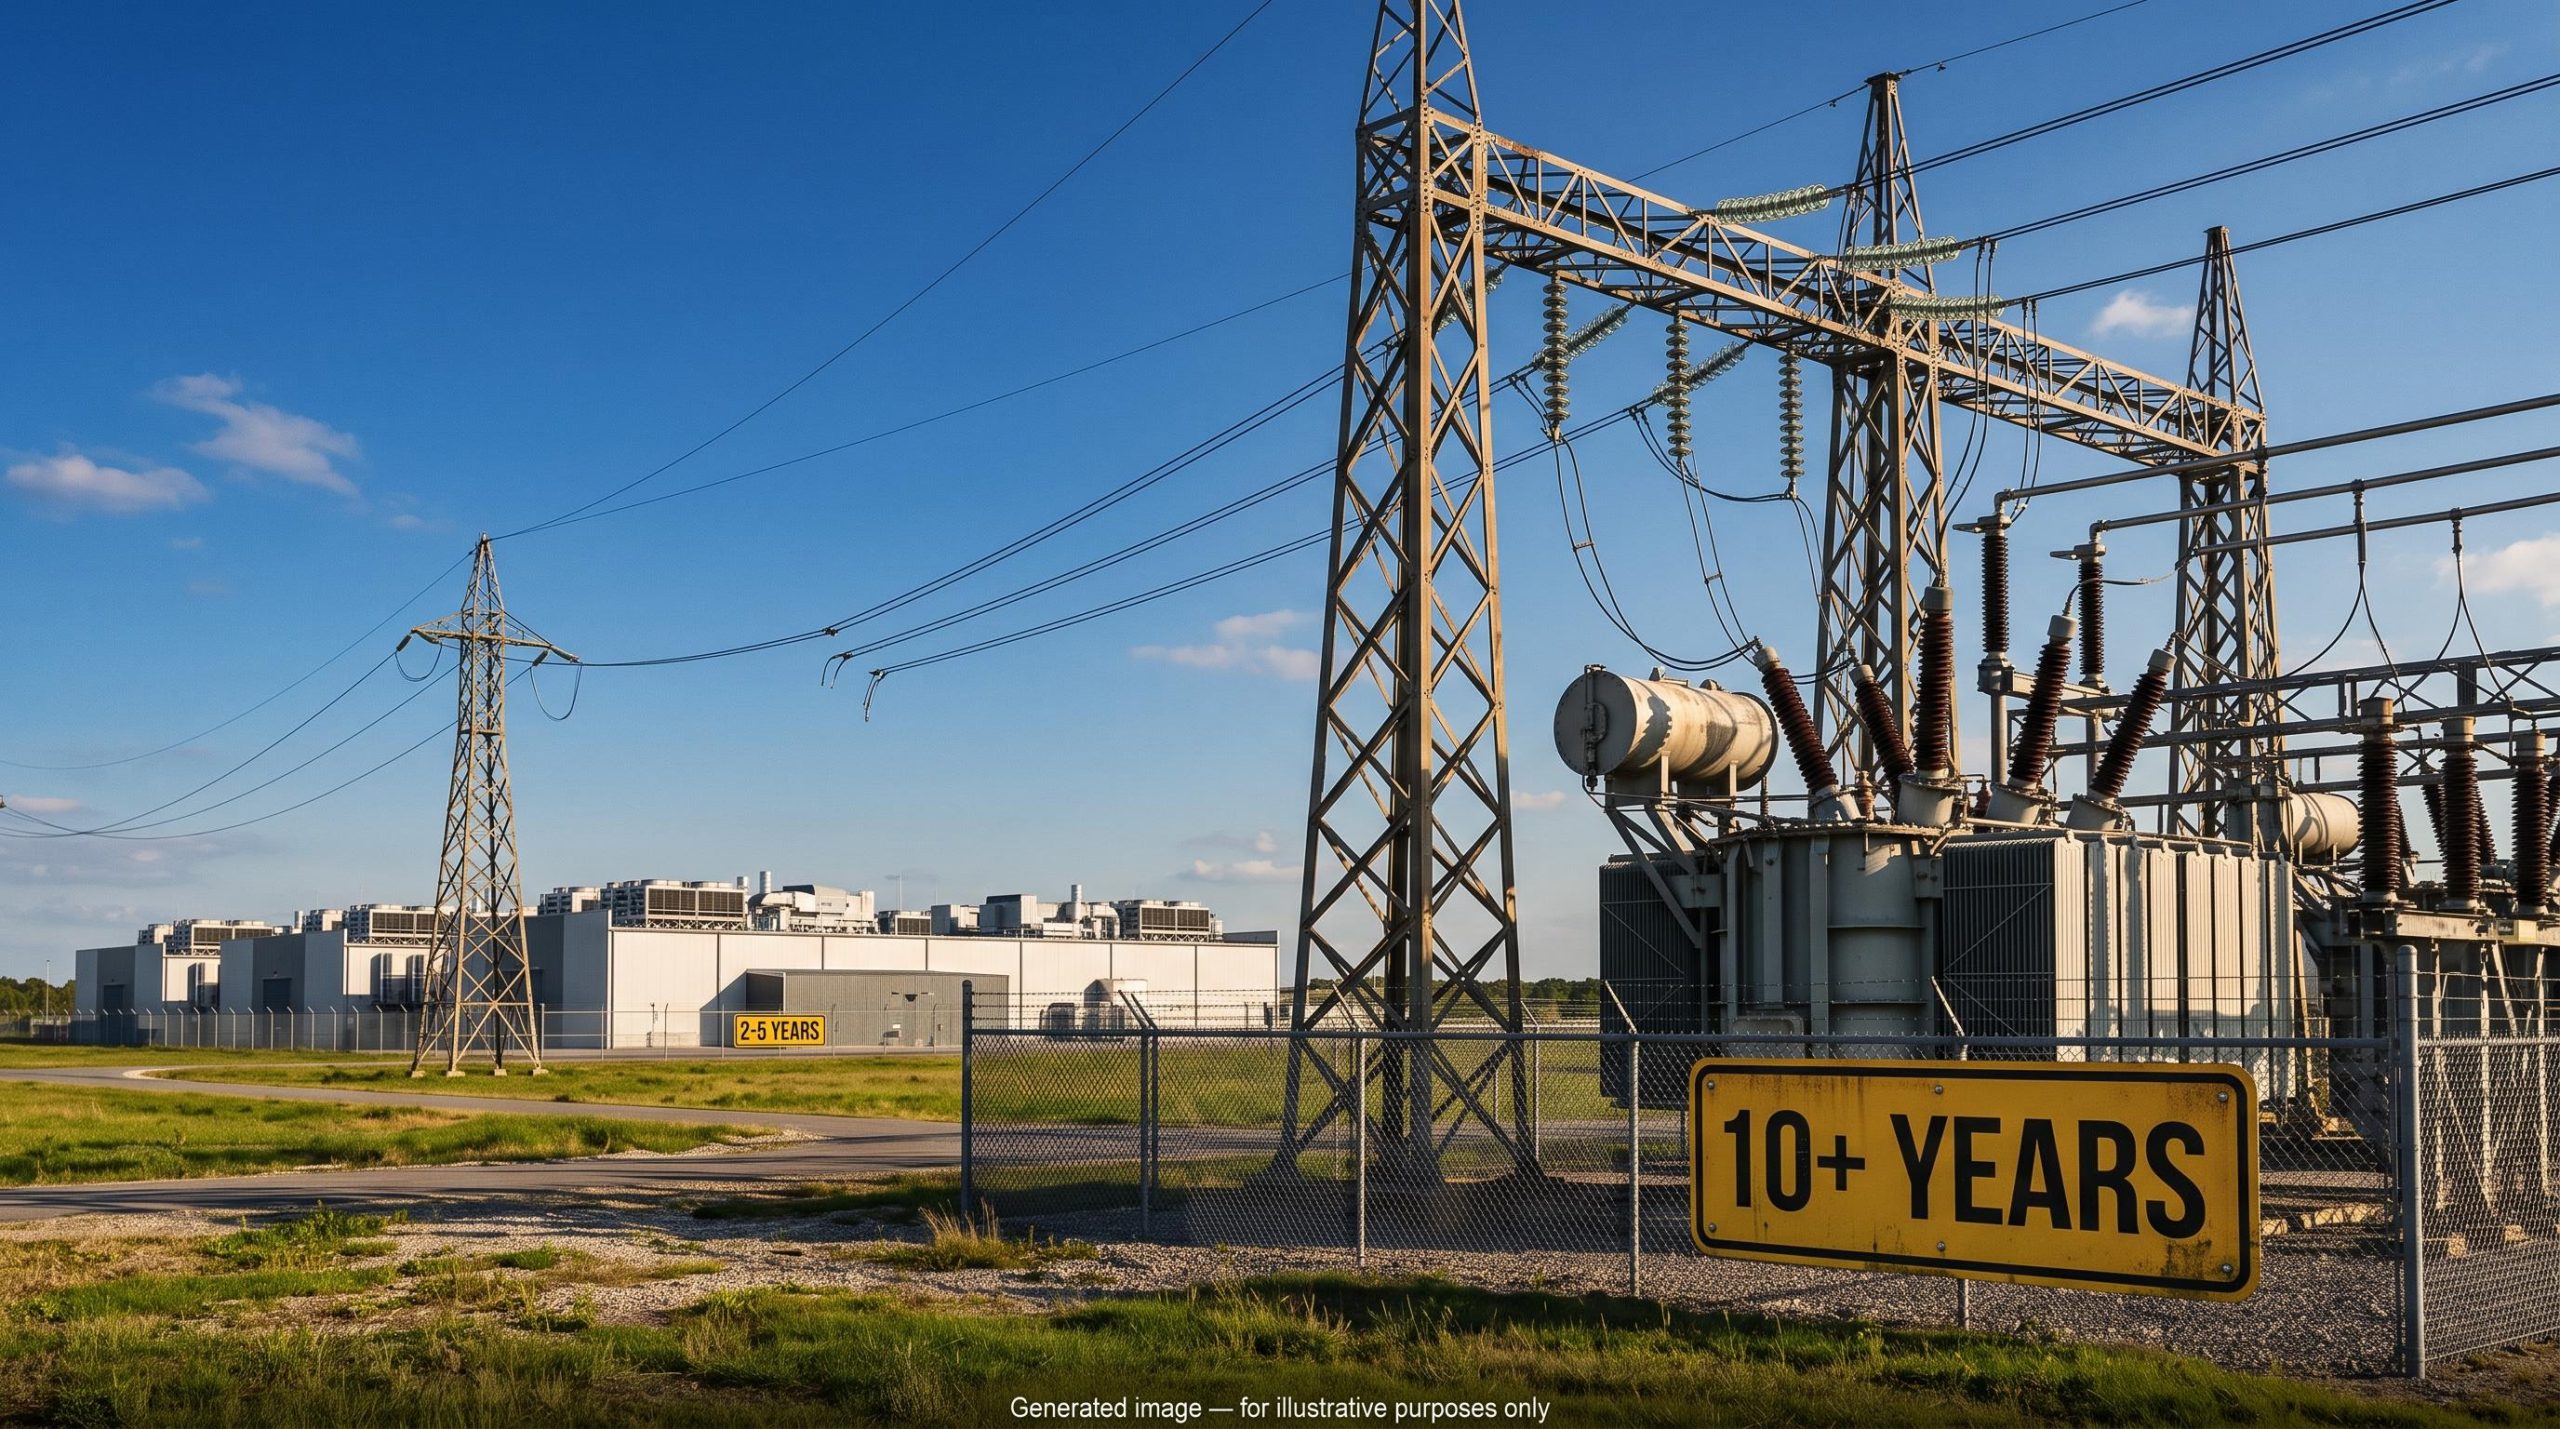
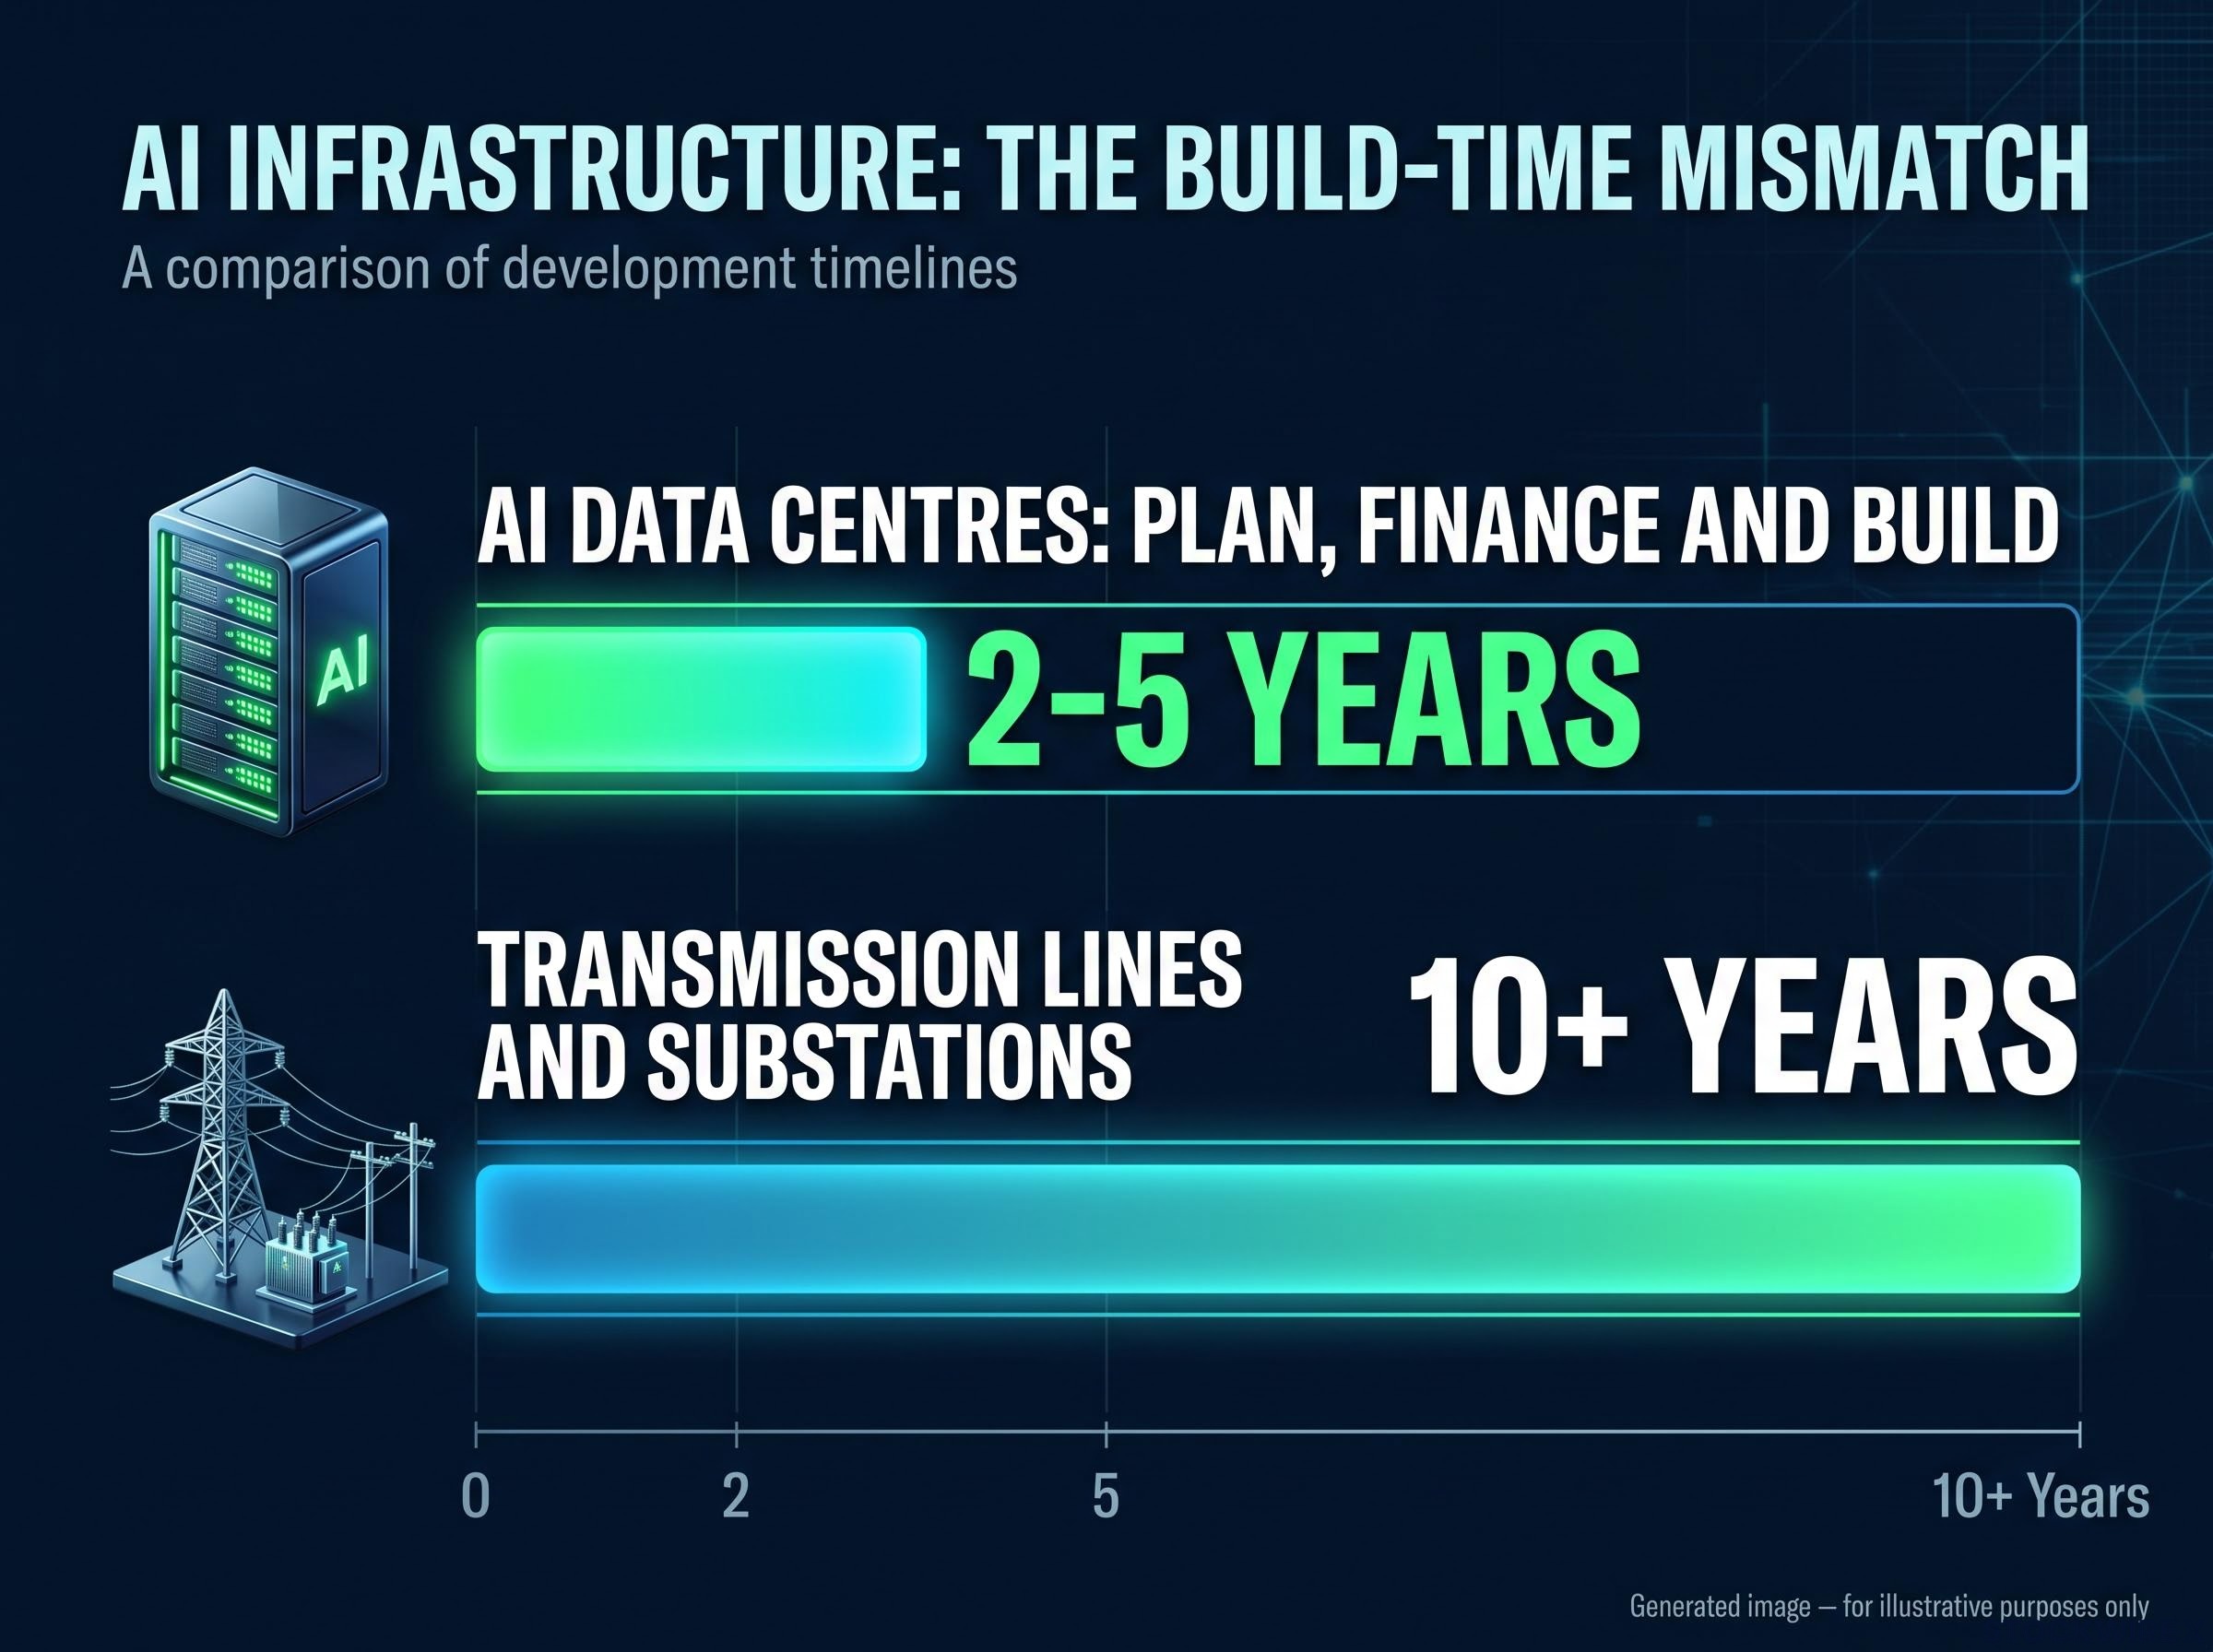
Most investors assume the scarce input in artificial intelligence is the chip. A growing body of evidence points somewhere less glamorous. An AI data centre can be planned and built in roughly 2-5 years, but the transmission lines and substations that feed it can take more than 10.
That gap is why AI data centre power demand has become the story inside the AI story. The limit on how fast AI capacity grows is shifting from silicon to electricity, and that shift changes where capital is likely to earn its returns.
The figures here run through late October 2026 and describe an unfolding trend rather than a single event. The aim is to give you a working framework for treating AI exposure partly as an energy investment, along with a short list of indicators you can start tracking now.
Why is AI data centre power demand outpacing the grid?
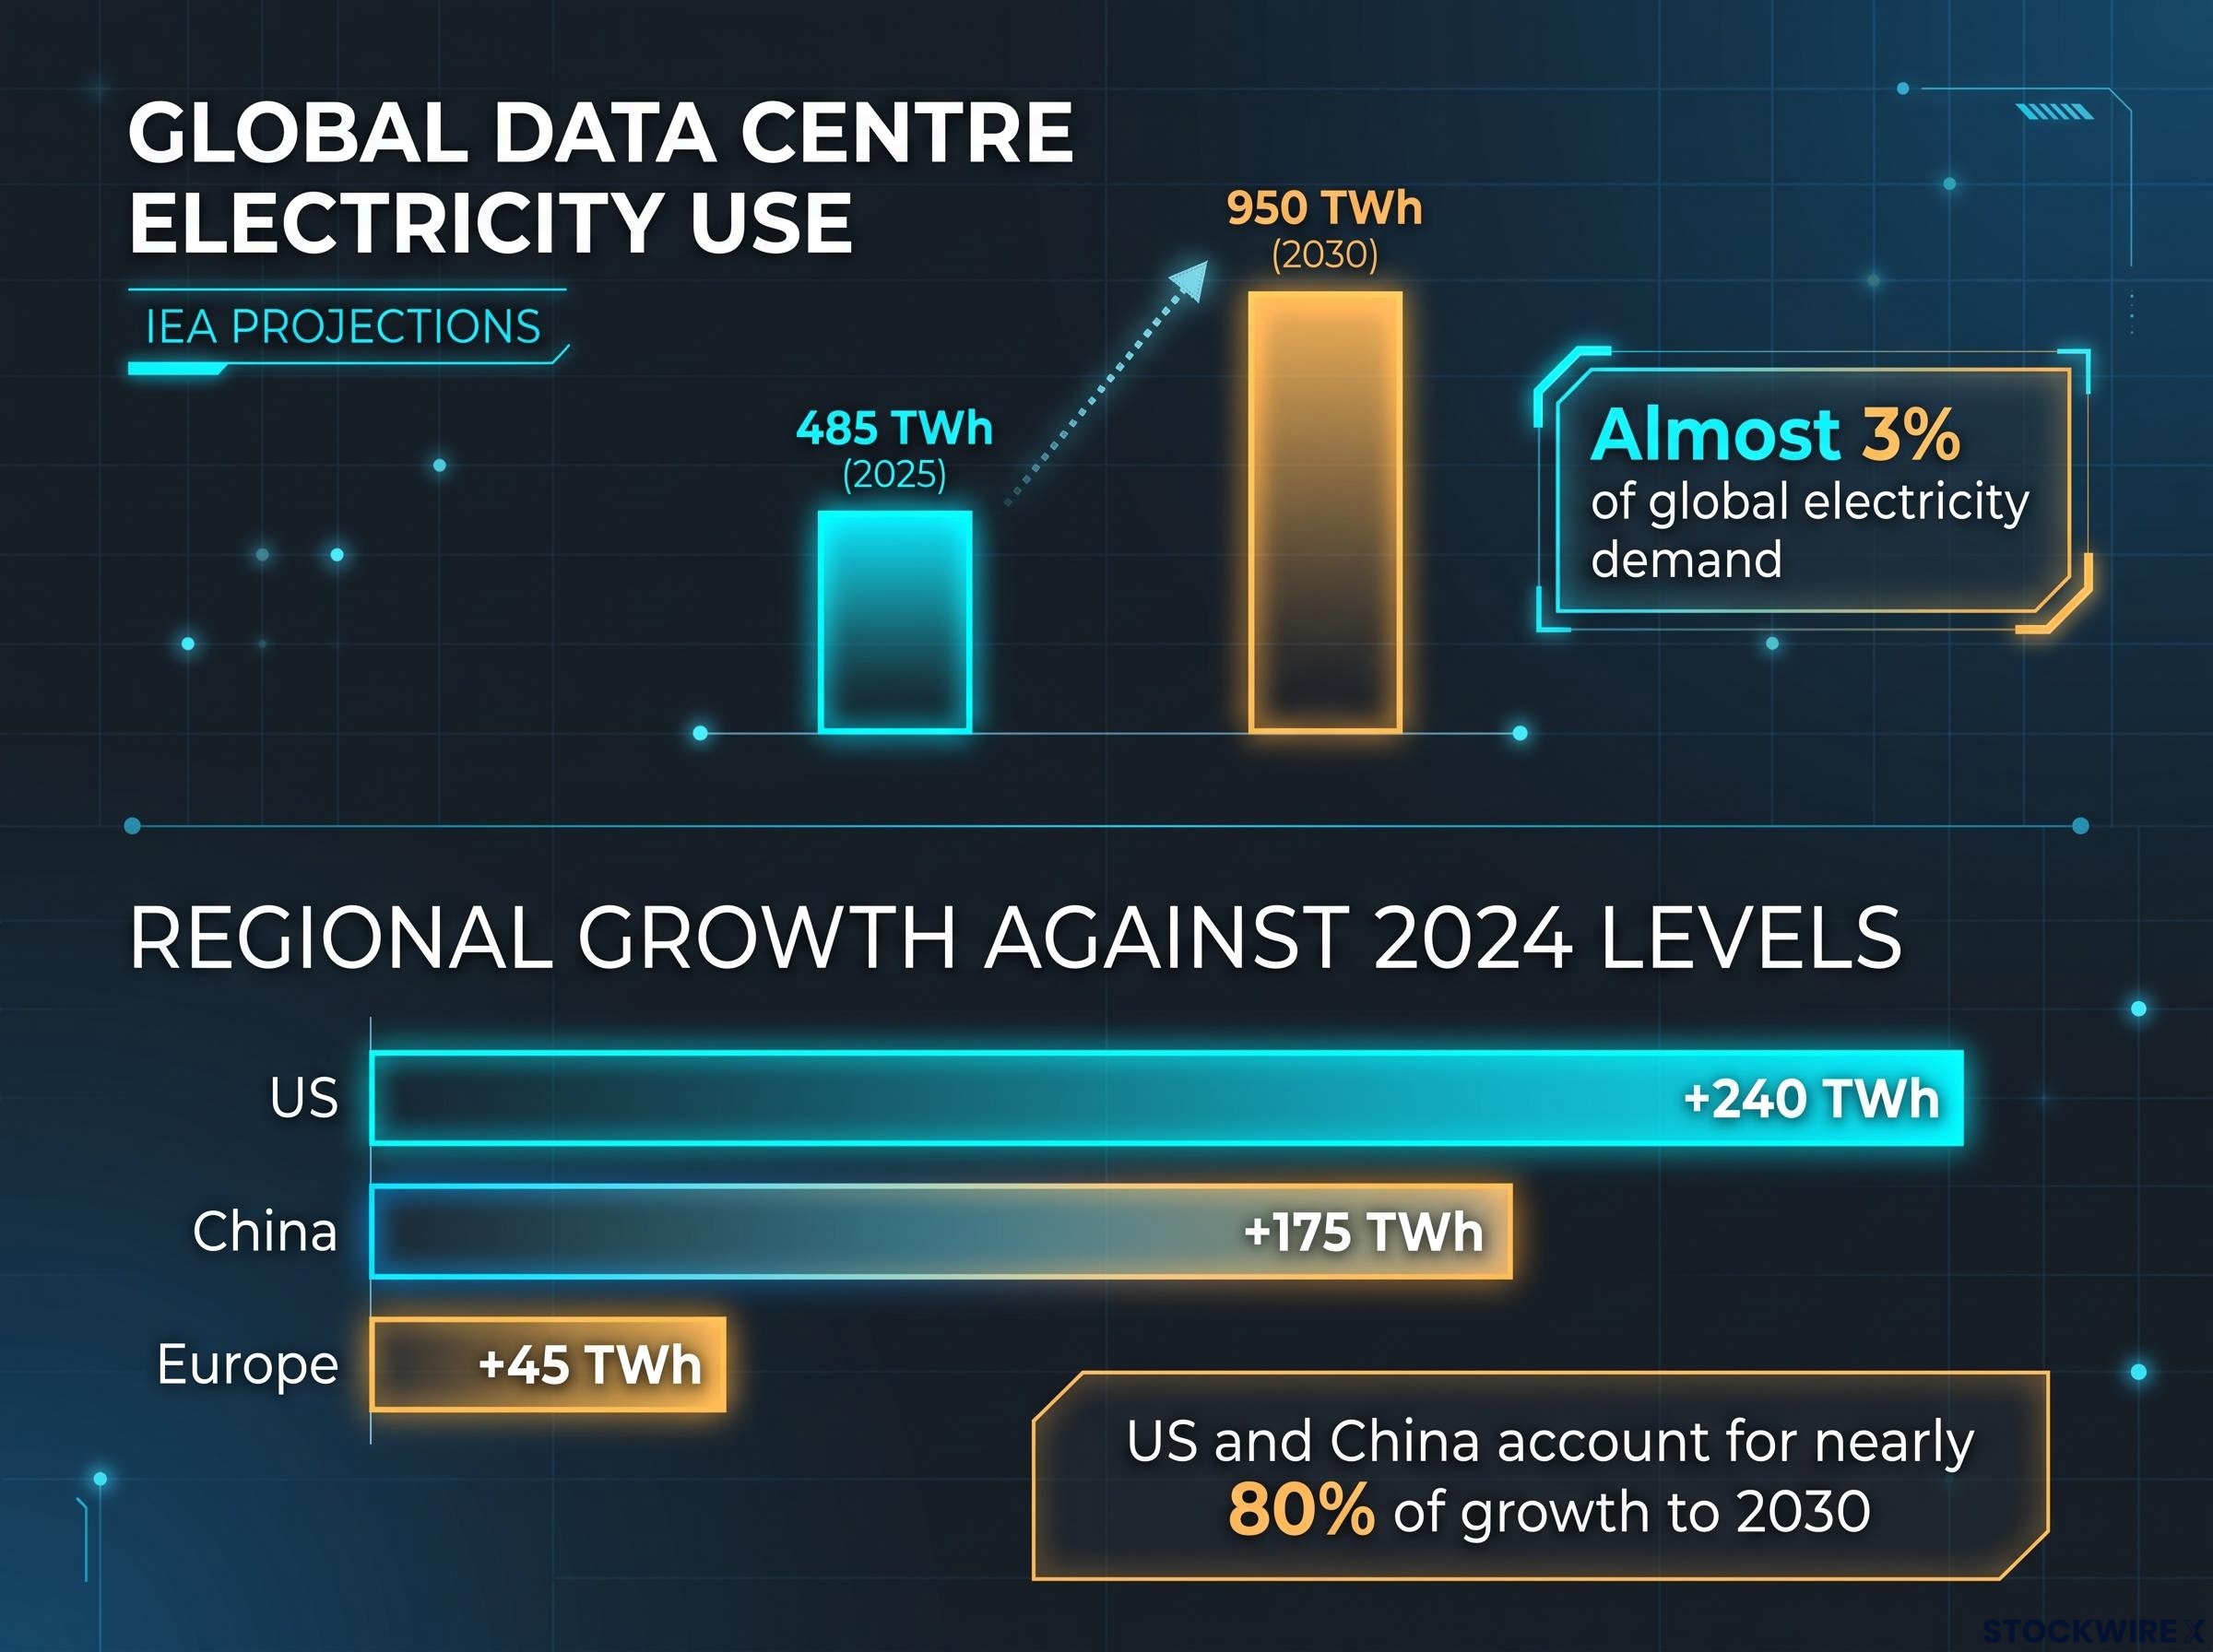
Start with the most conservative number. The International Energy Agency (IEA), in its “Key Questions on Energy and AI” report (published 11 September 2026, updated 30 October 2026), expects global data centre electricity use to rise from about 485 TWh in 2025 to about 950 TWh in 2030. A terawatt-hour (TWh) is a billion kilowatt-hours, and 950 TWh would equal almost 3% of global electricity demand.
The growth inside that total is uneven. Overall data centre use rose 17% in 2025, while AI-focused facilities climbed about 50%. The US and China account for nearly 80% of growth to 2030, with the IEA projecting increases of about 240 TWh for the US, 175 TWh for China and more than 45 TWh for Europe against 2024 levels.
The banks and research houses sit higher, particularly on the US.
| Institution | Figure | Date | Scope |
|---|---|---|---|
| IEA | 485 TWh to about 950 TWh | Sept 2026 (updated Oct 2026) | Global, 2025 to 2030 |
| Goldman Sachs | Growth of 220% by 2030 vs 2023 (up from 175%); US 95 GW in 2030 vs 32 GW in 2025 | July 2026 | Global and US |
| BloombergNEF | 118 GW installed in 2030, 52% above its Dec 2025 forecast | 29 July 2026 | US |
| McKinsey | IT demand rising to 121 GW by 2030 | 31 July 2026 | US |
| Morgan Stanley | Demand up to 74 GW by 2028, against a roughly 49 GW power access shortfall | Not dated | US |
The spread tells you the argument is about pace and about how much announced capacity actually gets switched on, not about direction. Treat headline pipeline figures as ceilings rather than forecasts. Projections like these are subject to market conditions and may not be met.
The spread across forecasts reflects different assumptions about pace, yet most agree on the direction, and the structural grid pressure from AI accelerator racks drawing several times more power than traditional cloud workloads is why utilities and equipment makers sit at the centre of the debate.
The United Nations Economic Commission for Europe (UNECE) put the core problem plainly in September 2026: data centres are going up faster than the grids that supply them.
The build-time mismatch Data centres: roughly 2-5 years to plan, finance and build. Transmission and substations: potentially 10+ years.
When big ASX news breaks, our subscribers know first
Which four bottlenecks are turning electricity into the scarce input?
The mismatch shows up first in the most physical place: the factory floor.
Turbines and equipment
Gas is the fastest route to firm power, meaning electricity available on demand regardless of weather. Getting a turbine, though, can now take longer than getting chips.
| Manufacturer | Backlog | Delivery timing |
|---|---|---|
| GE Vernova | 122 GW of orders and slot reservations; year-end target about 130 GW | Reservations reaching into 2031 |
| Siemens Energy | 69 GW at 30 June 2026 | Lead times of 3 years or more |
| Mitsubishi Heavy Industries | 35 GW large-frame, up from 23 GW | Recent orders for 2028-2030 |
Earlier reporting described the Siemens and Mitsubishi books as full four to five years out. Newer data points to three-plus years, which is shorter but still far beyond a typical chip order. Turbines are also only one link: transformers, switchgear, connection approvals and transmission all have their own queues.
Capacity prices and reliability in PJM
PJM, the largest US grid and home to northern Virginia’s data centre corridor, shows what happens when those queues meet demand. It runs a capacity auction, where power plants are paid to guarantee they will be available in a future year.
PJM 2028/29 auction Cleared at the $325 per MW-day cap, more than 11 times the 2024/25 level, and still about 6,831 MW short of its reliability requirement for a second straight year.
PJM’s market monitor attributes about $6.3 billion of the auction’s $16.4 billion in charges to data centre load, while more than 100 GW waits in its connection queue. Households feel it, although the estimates measure different things: NRDC projects about $70 a month for an average PJM household by 2028, a New Jersey regulator cited rises of $22.67-$28.02 a month, and Allianz estimates about $1.4 billion a year nationally.
Connection limits and public pushback
Europe shows that plentiful national power does not guarantee a local plug. Ireland, where data centres use more than 20% of metered electricity, has restricted new connections near Dublin, and the Netherlands has limited hyperscale locations since January 2024.
Backlash reported in Arizona, Indiana and Pennsylvania could add another brake. Because none of these limits sit in the chip supply chain, owners of scarce equipment, firm power and connection rights hold pricing power that GPU buyers do not.
The interconnection bottleneck is where equipment suppliers are now competing, with some offering power-electronics systems designed to turn a multi-year connection process into a problem solvable at the point of connection.
How does the power-and-chips split divide the US, China and the middle powers?
One analyst cited by Al Jazeera summed it up neatly: the US has chips but lacks power, and China has power but lacks chips. It is a useful starting point, but not the whole picture.
China: power without chips
China added more than 430 GW of wind and solar in 2025 (about 315 GW solar and 119 GW wind), and BloombergNEF (BNEF) expects it to add almost six times as much capacity as the US over the next five years. Yet BNEF puts China’s 2025 data centre capacity at about 20 GW against 41 GW for the US, rising to roughly 34 GW versus nearly 77 GW by 2030.
Beijing estimates its data centres run at about 20-30% utilisation. That is separate from the 67.6% renewable usage figure from early 2025, which measures curtailment (renewable output wasted because the grid cannot use it), and no authoritative 2026 nationwide utilisation series exists.
The US: chips without spare power
The US leads in frontier AI, accelerators and capital, but faces ageing grids, long queues and thin reserve margins. Hyperscalers are building their own generation, and Microsoft’s restart of Three Mile Island Unit 1 (Crane) is expected in late 2027 under a 20-year agreement.
Middle powers
| Region | Power strength | Chip/ecosystem position | Main constraint |
|---|---|---|---|
| Gulf | Gas, solar, capital | Fast campus construction | Fuel, cooling, water, geopolitical risk |
| Nordics | Low-carbon power, strong grids | Smaller chip and hyperscaler base | Transmission, local opposition |
| Canada | Hydro, low-carbon power | Strong AI talent, smaller hyperscaler base | Transmission, regulation, distance |
Fuel-importing hubs carry a different exposure, since reliance on imported gas, LNG or equipment leaves them open to price and shipping shocks such as disruption around Hormuz. For you, the practical question is where an AI asset’s electricity comes from, not only who designed its chips.
What could slow or reverse the power-constrained AI story?
Scarcity rarely lasts forever, and the counter-case deserves real weight.
- Overbuild: Shortages invite overinvestment, and some capacity could be stranded if AI revenue disappoints. McKinsey counters that new grid assets can serve industrial electrification and other loads.
- Efficiency: Better chips and cooling cut energy per task, but cheaper computing tends to drive more of it. The 2025 split (17% overall, about 50% AI-focused) shows that rebound in action.
- Policy: US proposals would make data centres supply their own power or pay more to connect, alongside special tariffs, minimum-load commitments, exit fees and curtailment rules.
- Self-supply limits: JPMorgan and Morgan Stanley highlight gas, nuclear, microgrids and batteries, but these can shift fuel and emissions exposure, add local pollution, reduce grid transparency and erode system economies of scale.
IEA caution Rapidly built data centres may oversize their grid connections while servers are installed gradually, risking misaligned investment and higher prices.
The conservative reading is that announced capacity will not equal operating load. The thesis is a bet on firm, fast, secured power, so discount any pipeline that lacks contracts.
How can investors treat AI exposure as an energy investment?
Morgan Stanley forecasts about $3 trillion of global AI value-chain spending by the end of the decade. A growing share of that money flows through the power system.
Goldman Sachs has already pointed capital in this direction, favouring contract-backed data centre assets and utilities, where lease rates have nearly tripled since 2021 and 15-20-year agreements lock in returns that chip exposure cannot match.
The layers
| Layer | What it is | Indicator to watch |
|---|---|---|
| Generation | Turbines, nuclear restarts, renewables, storage | Order backlogs and lead times |
| Grid equipment | Transformers, switchgear, substations, cable | Transformer lead times |
| Utilities | Power companies with spare connection capacity | Rate cases and data centre tariffs |
| Fuel supply | Gas, LNG, uranium | Energy-price and shipping shocks |
| Developers | Data centre builders with power already secured | Secured MW and power purchase agreements |
| Cooling and power management | Systems that keep racks running efficiently | Utilisation and server deployment |
| Behind-the-meter | On-site generation that bypasses the public grid | Behind-the-meter capacity contracted |
A power purchase agreement (PPA) is a long-term contract to buy electricity at an agreed price. The strongest candidates combine secured orders, pricing power, a short path to energisation and assets in constrained regions.
The dashboard
- Capacity auction prices: PJM results show how tight firm power is getting.
- Turbine and transformer backlogs: Rising order books signal sustained pricing power for equipment makers.
- Interconnection queues: Length and withdrawal rates show how many projects actually connect.
- Secured MW and PPAs: Contracted power separates real capacity from announcements.
- Reserve margins and rate cases: These flag reliability stress and the risk of political pushback.
- Utilisation, efficiency and inference growth: These test whether demand is real.
- Curtailment, Hormuz and China’s chip access: These shape the geographic balance.
Read AI exposure as a combined compute, electricity and grid-capex position, and check whether your holdings own secured power or just announced plans.
Where the power constraint leaves AI investors next
Demand is rising, and the binding limits now sit in equipment, capacity prices, reliability and grid connections. Geography decides who can build, which is why the US, China and the energy-rich middle powers face such different paths.
The open debate is over pace and how much announced capacity energises, not direction. The next capacity auction results, turbine backlog updates and interconnection queue data are likely to move the picture most. Some gaps remain, including the lack of an authoritative 2026 utilisation series for Chinese data centres.
Original author Andrea Zanon of FXStreet argues the winners will be those with firm, fast and secure power. For any AI holding, ask one question: where does its firm power come from, and when?
This article is for informational purposes only and should not be considered financial advice. Investors should conduct their own research and consult with financial professionals before making investment decisions.