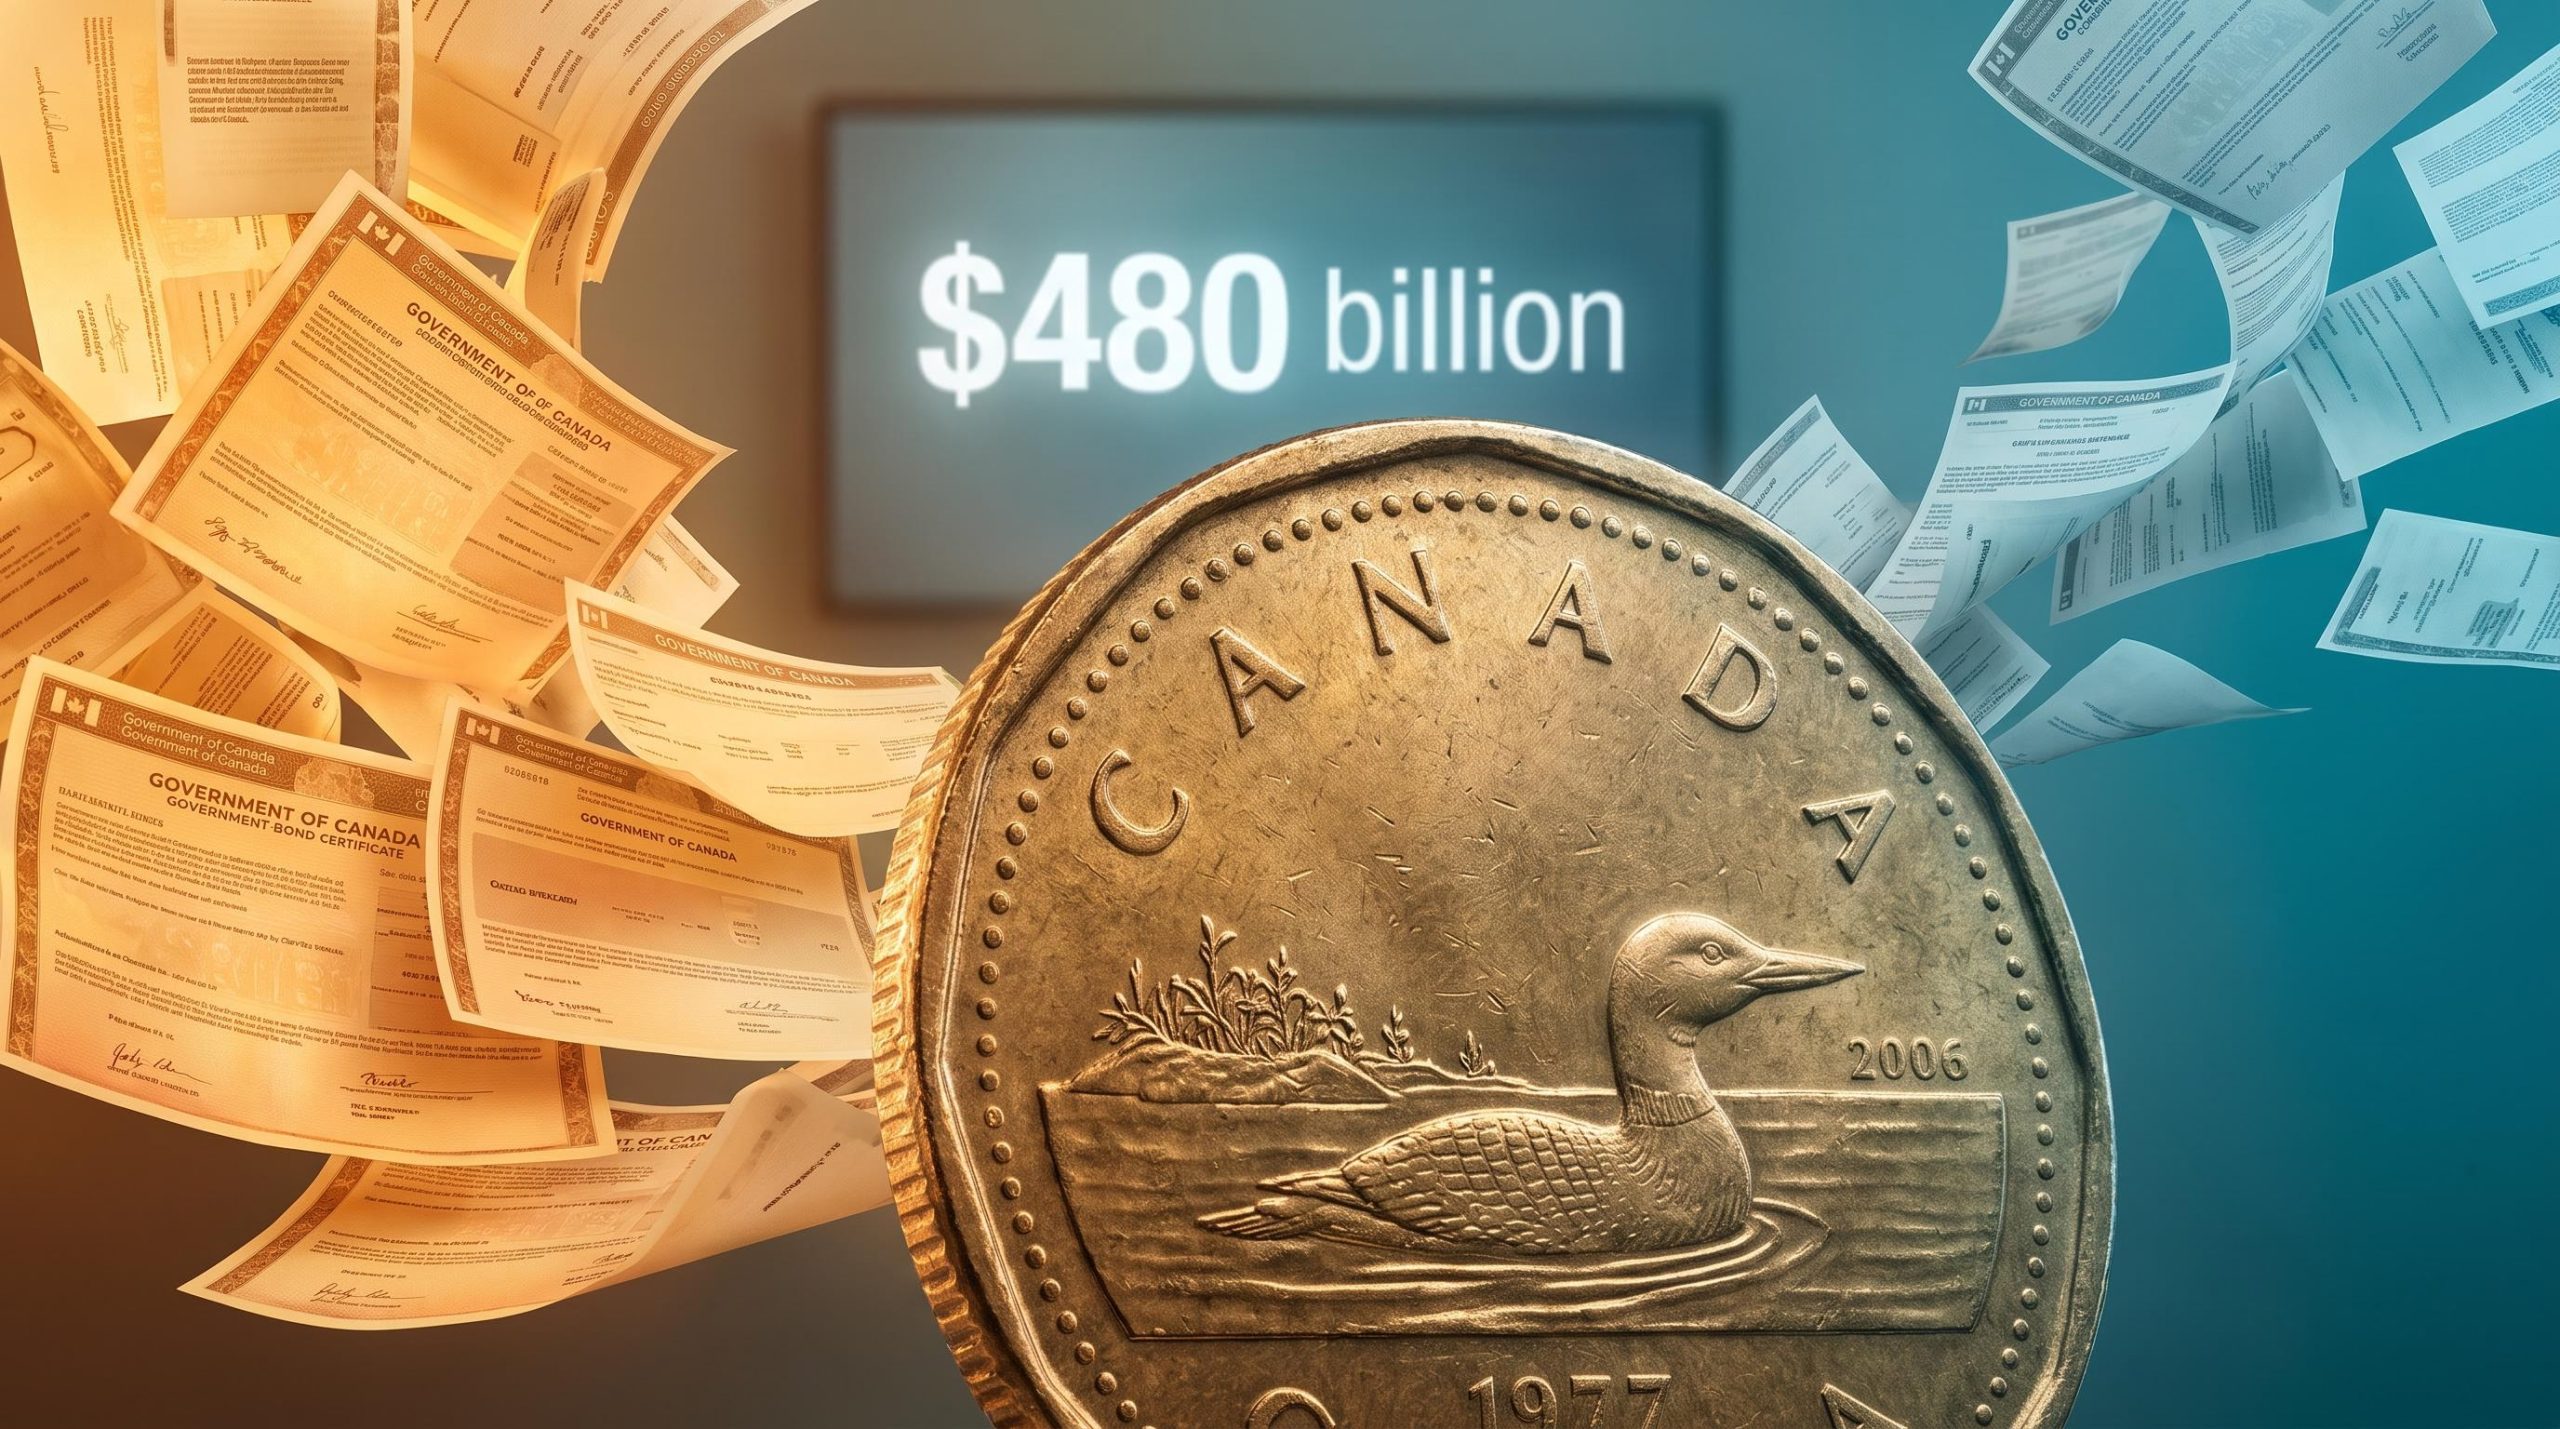
Central banks bought more than 1,000 tonnes of gold in 2024, the third year running above that mark. Cited on its own, that figure sounds like the engine of a bull market. One number reframes the entire story.
Only around 28 of the world’s roughly 200 central banks are active gold market participants. Their collective share of total gold investment has slipped from historically comprising one-third to one-half of the market down to approximately one-sixth or one-seventh today.
That distinction matters right now. Gold hit an all-time high of approximately $5,405 per ounce in January 2026 and, despite pulling back, still trades near $4,142 as of 29 September 2026. Anyone building positions on the belief that central bank gold buying is the primary price driver is building on a misattribution of cause.
Here is what the demand data actually shows, and what that means for anyone trying to read where gold goes from here. The right actors to watch may not be the ones the headlines keep pointing to.
The 28-bank reality behind the 1,000-tonne headline
The headline is genuinely impressive. Global central banks added more than 1,000 tonnes to reserves in 2024, marking the third consecutive year above that threshold, according to World Gold Council (WGC) data reported by Reuters on 7 March 2025. Average annual accumulation over the past four years has run close to 1,000 tonnes.
Now look at who is actually doing it. Of approximately 200 central banks worldwide, only around 28 have been active in the gold market at all, according to Jeff Christian of CPM Group. That means roughly 85% of the world’s central banks are functionally absent from gold entirely.
The concentration problem Of approximately 200 central banks globally, only around 28 are active gold market participants, whether buying or selling, according to CPM Group’s Jeff Christian.
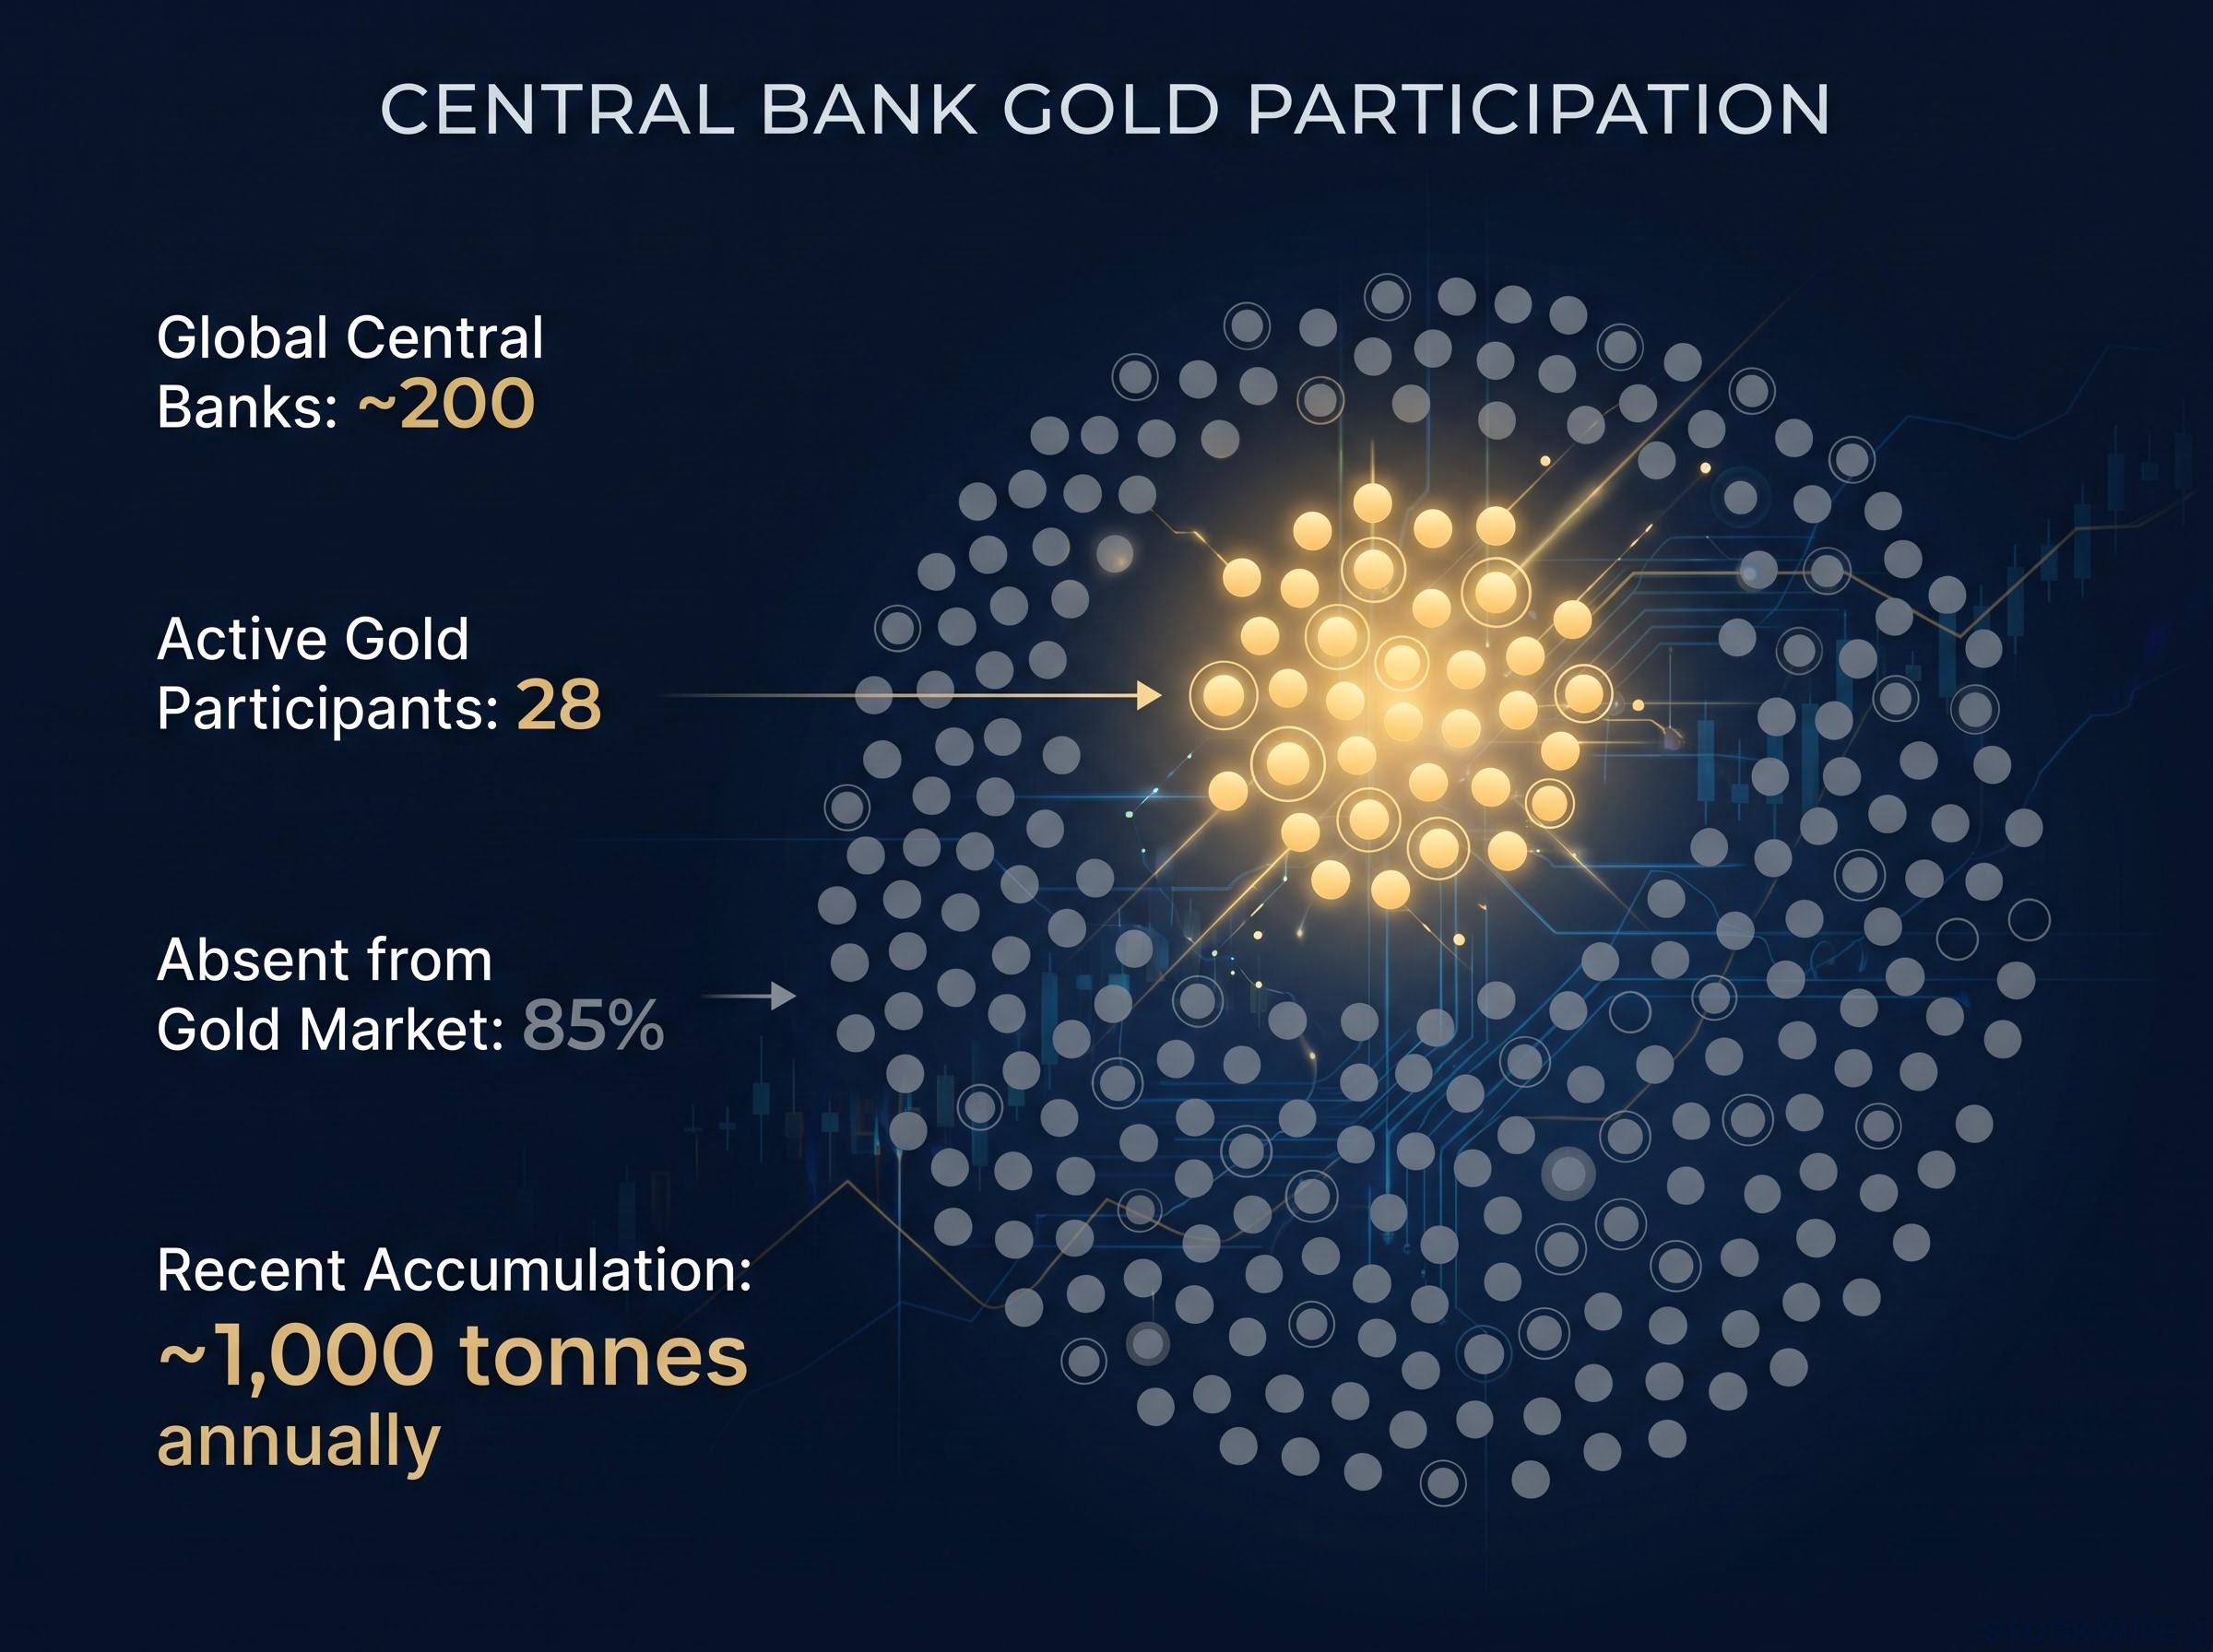
This concentration is the whole point. The “central bank demand” pillar is not a broad, systemic reallocation across the global banking system. It is a small cluster of institutions, and if a handful of them pause or reverse, the entire official-sector support shifts materially.
How central bank buying has evolved quarter by quarter
The quarterly record tells its own story of stops and starts.
- Q2 2025: 166 tonnes, a pace roughly 33% lower quarter-on-quarter
- Q3 2025: 218 tonnes
- Q4 2025: 230 tonnes
- H1 2026: 345 tonnes in total, with Q2 2026 alone contributing 289 tonnes
The pattern shows a clear dip in the middle of 2025 followed by steady reacceleration into 2026. That reacceleration sits uneasily against one behavioural fact.
Central banks have historically behaved as value-oriented, dip-buying institutions rather than momentum chasers. The People’s Bank of China (PBoC) illustrates this: according to CPM Group, it resumed buying in November 2022 when prices fell to around $1,680 per ounce, roughly 20% below prior levels above $2,000. Buying heavily at record highs runs against that instinct, which raises an obvious question: if central banks are buying this much, why are they not the primary price driver? The answer starts with how the buying is measured.
Central banks have now been net buyers for thirteen consecutive years, a sustained pattern explained by reserve diversification objectives that include counterparty-risk elimination, sanctions resilience, and reserve-quality signalling, none of which depend on a favourable near-term price outlook.
When big ASX news breaks, our subscribers know first
Why the WGC numbers deserve more scrutiny than they receive
The most-cited figures in gold analysis are not fully what they appear to be. WGC central bank demand data combines official, disclosed purchases with modelled estimates for “unreported buying,” produced through Metals Focus modelling. The modelled portion is not a rounding error.
In Q2 2025, unreported buying was estimated at approximately 90 tonnes, roughly 54% of the 166-tonne quarterly total. More than half of that quarter’s “central bank demand” figure was a modelled estimate rather than a confirmed disclosure.
The estimation gap Around 90 of the 166 tonnes attributed to central banks in Q2 2025 was modelled, not disclosed, according to WGC and Metals Focus figures.
CPM Group’s critique goes further. Christian argues that WGC figures also fold in sovereign wealth funds and other non-central-bank institutions, which distorts the numbers as a measure of central bank activity specifically. CPM Group instead sources its data directly from central bank disclosures and regulatory bodies, including the International Monetary Fund (IMF) and the Bank for International Settlements (BIS).
The IMF COFER reserve-composition data provides the most directly verified benchmark for official-sector gold holdings, drawing on disclosed reserve statistics from member countries rather than modelled estimates, which is why CPM Group and other sceptics of headline WGC figures treat it as a more grounded reference point.
Those disclosed frameworks offer a less granular but more grounded benchmark: direct central bank statements such as the PBoC’s monthly reserve disclosures, IMF COFER reserve-composition statistics, and BIS reserve data. The WGC’s own Full Year 2025 Outlook acknowledges that many banks manage gold outside formal reserve frameworks and may target volumes rather than values.
De-dollarization dynamics sit beneath the surface of these disclosed figures: the OMFIF Global Public Investor survey released in June 2026 recorded the first instance on record of net dollar-reduction intent outnumbering net dollar-increase intent, a structural shift that helps explain why sovereign gold accumulation has persisted at elevated price levels.
| Data source | Primary input | Coverage | Reported vs estimated | Institutional use |
|---|---|---|---|---|
| WGC / Metals Focus | Official disclosures plus modelling | Broad, includes some non-central-bank entities | Substantial estimated portion (~54% in Q2 2025) | Widely cited by Wall Street and media |
| CPM Group / IMF / BIS | Direct disclosures and regulatory data | Narrower, central banks specifically | Disclosed figures, less modelling | Used as an alternative benchmark |
This matters for how much weight to place on the narrative. Major bank forecasts from JP Morgan, Morgan Stanley, Goldman Sachs, and Bank of America are, per CPM Group commentary, largely trend-following and drawn substantially from WGC data. When more than half of a key demand category is estimated rather than reported, the read you should take is directional: treat the “surging central bank demand” story as an indicator, not a settled fact, and calibrate your confidence accordingly.
Private investors are doing the actual work
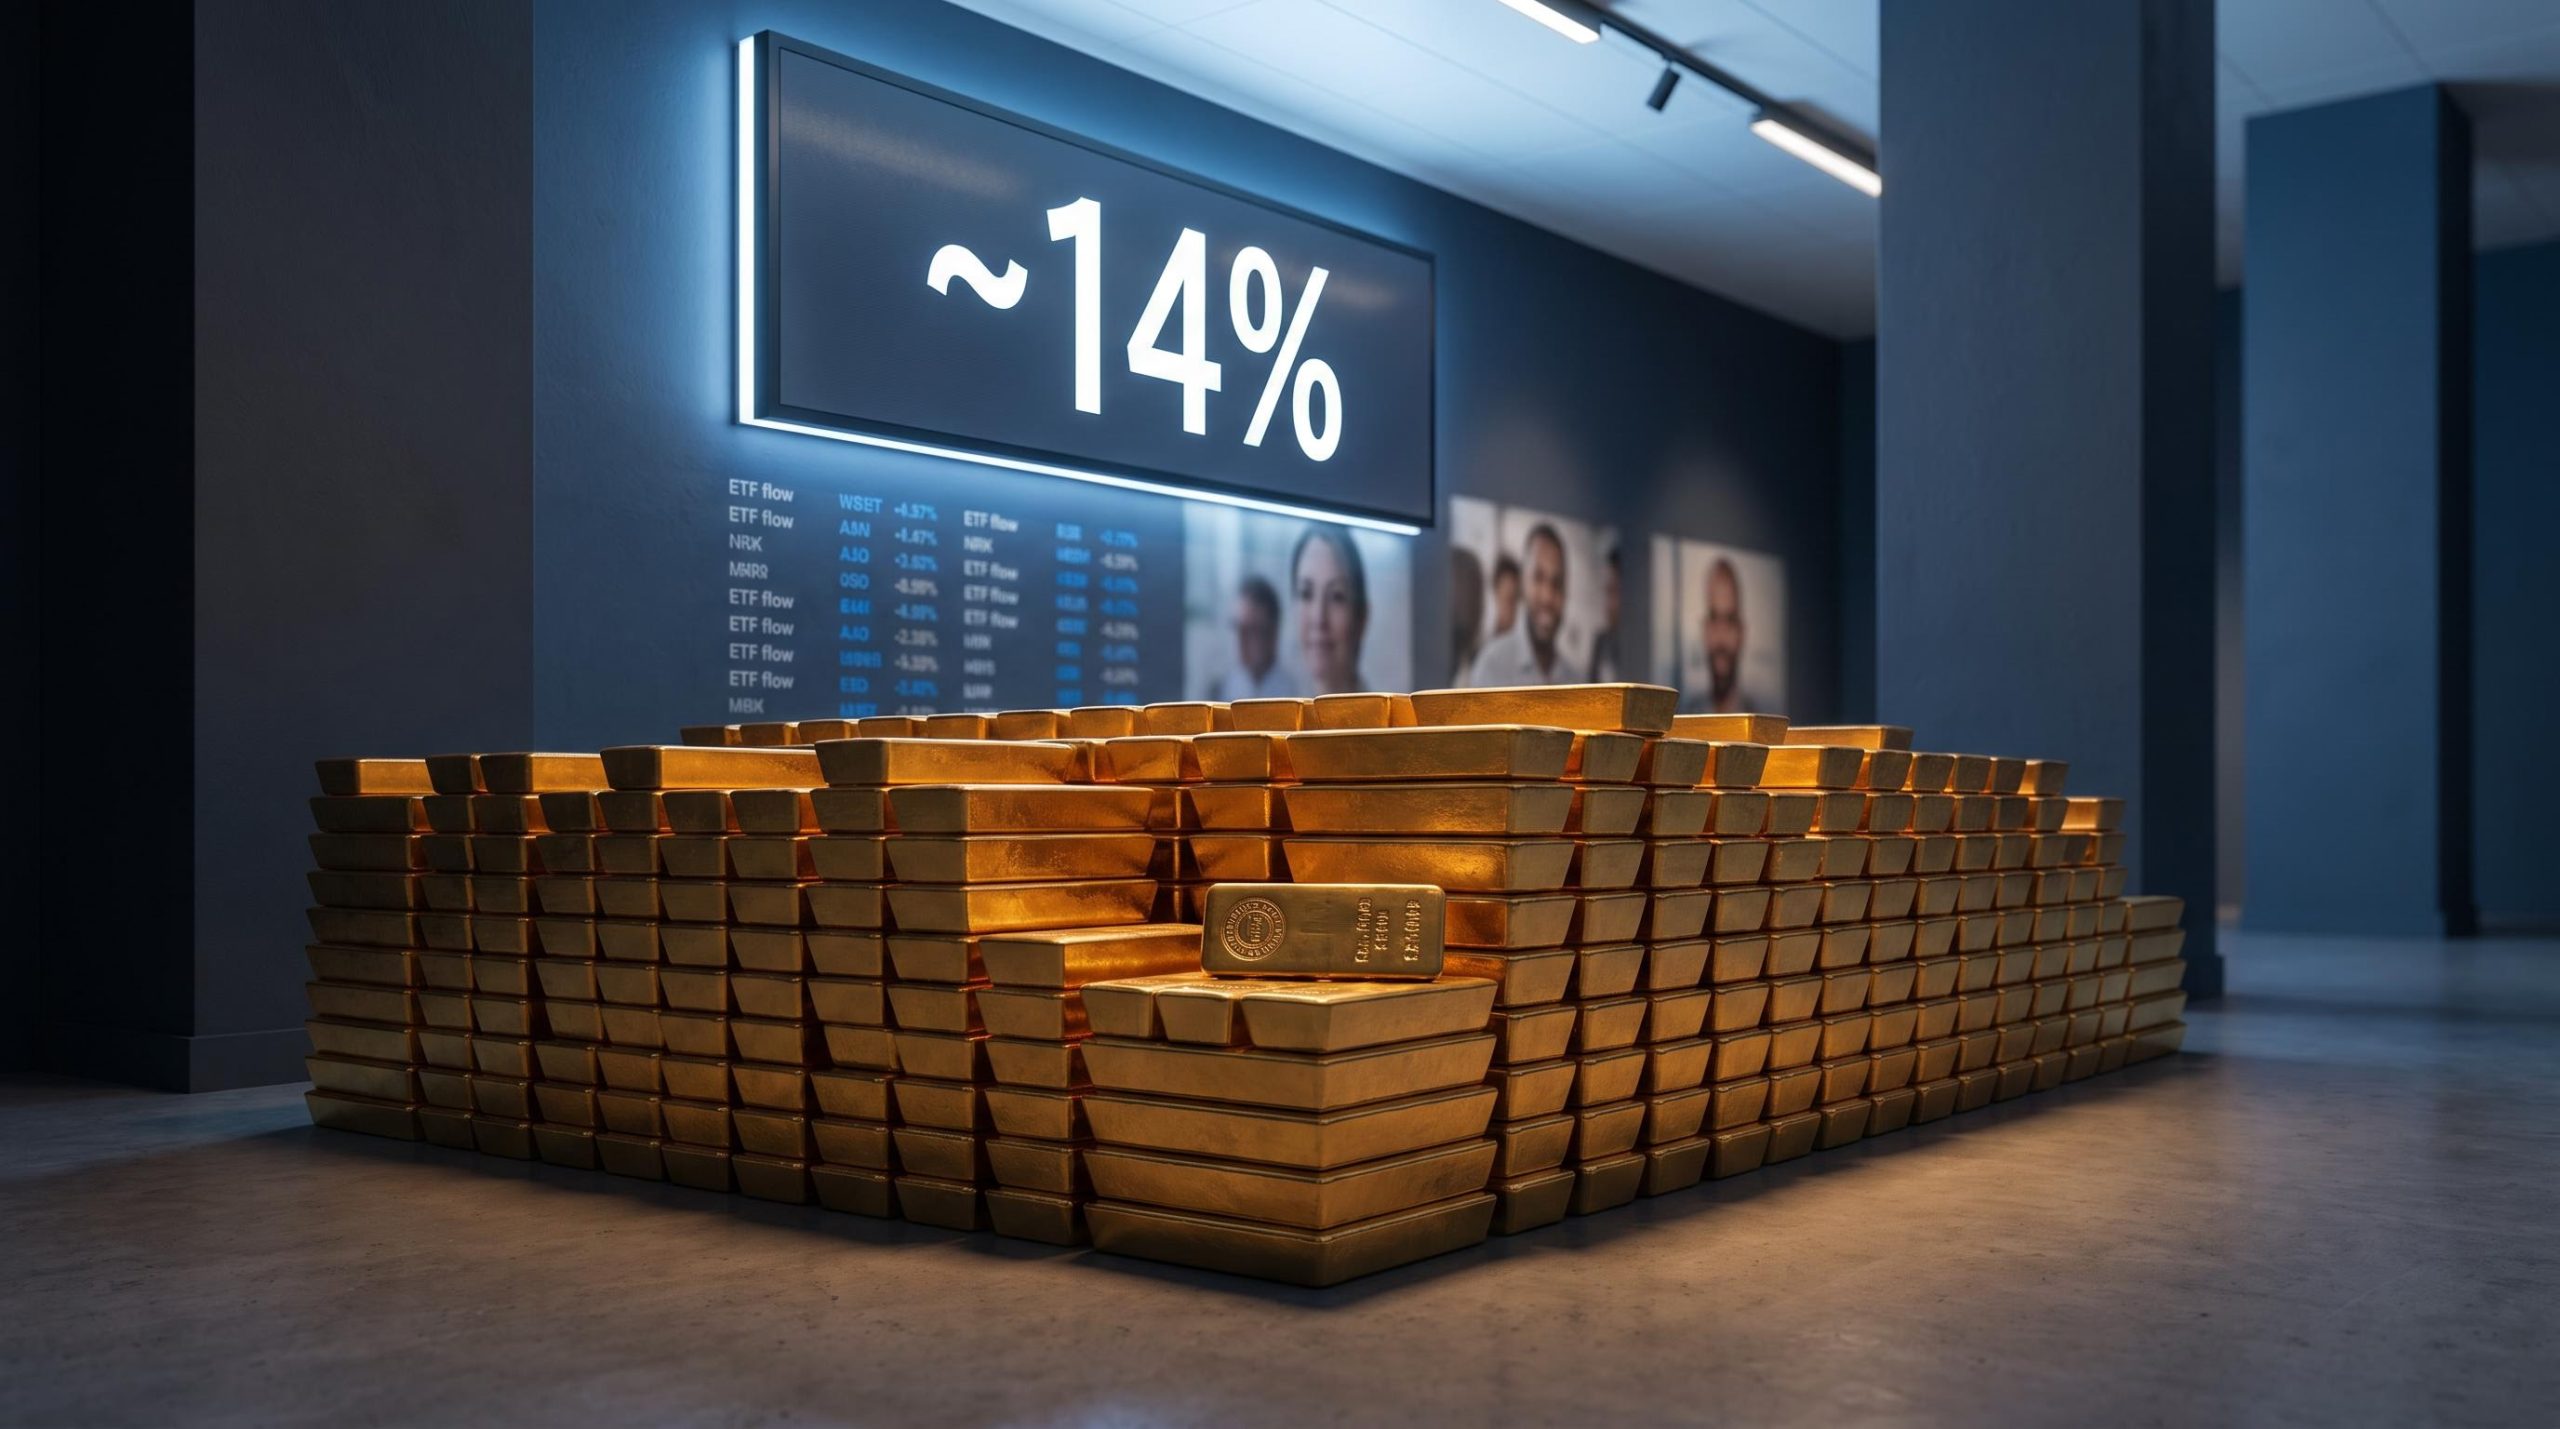
Shift the frame to the private layer and the price picture snaps into focus. CPM Group places central banks at approximately one-sixth to one-seventh of total gold investment purchases currently, projected to fall to roughly 14% of the market going forward. The remaining share, the vast majority, is private money.
The volume gap is stark. WGC Gold Demand Trends for Q2 2025 (published 31 July 2025) put total gold demand including over-the-counter activity at 1,249 tonnes, with demand value jumping 45% year-on-year to US$132 billion, the highest average gold price ever recorded in a quarter. That surge was driven primarily by ETFs, bars, and coins, not official reserves.
Several forces are pushing this private demand:
- Geopolitical risk hedging into safe-haven assets
- Portfolio diversification away from dollar-denominated holdings
- Persistent inflation concerns
- Real-yield dynamics that make non-yielding real assets more attractive
- Price-momentum feedback, where rising prices pull more money into ETFs and physical products
There is one number that anchors the entire structural argument.
The 350-tonne threshold JP Morgan analysts estimate that around 350 tonnes of combined quarterly central bank and investment demand is needed just to keep prices flat, according to Reuters (17 December 2025).
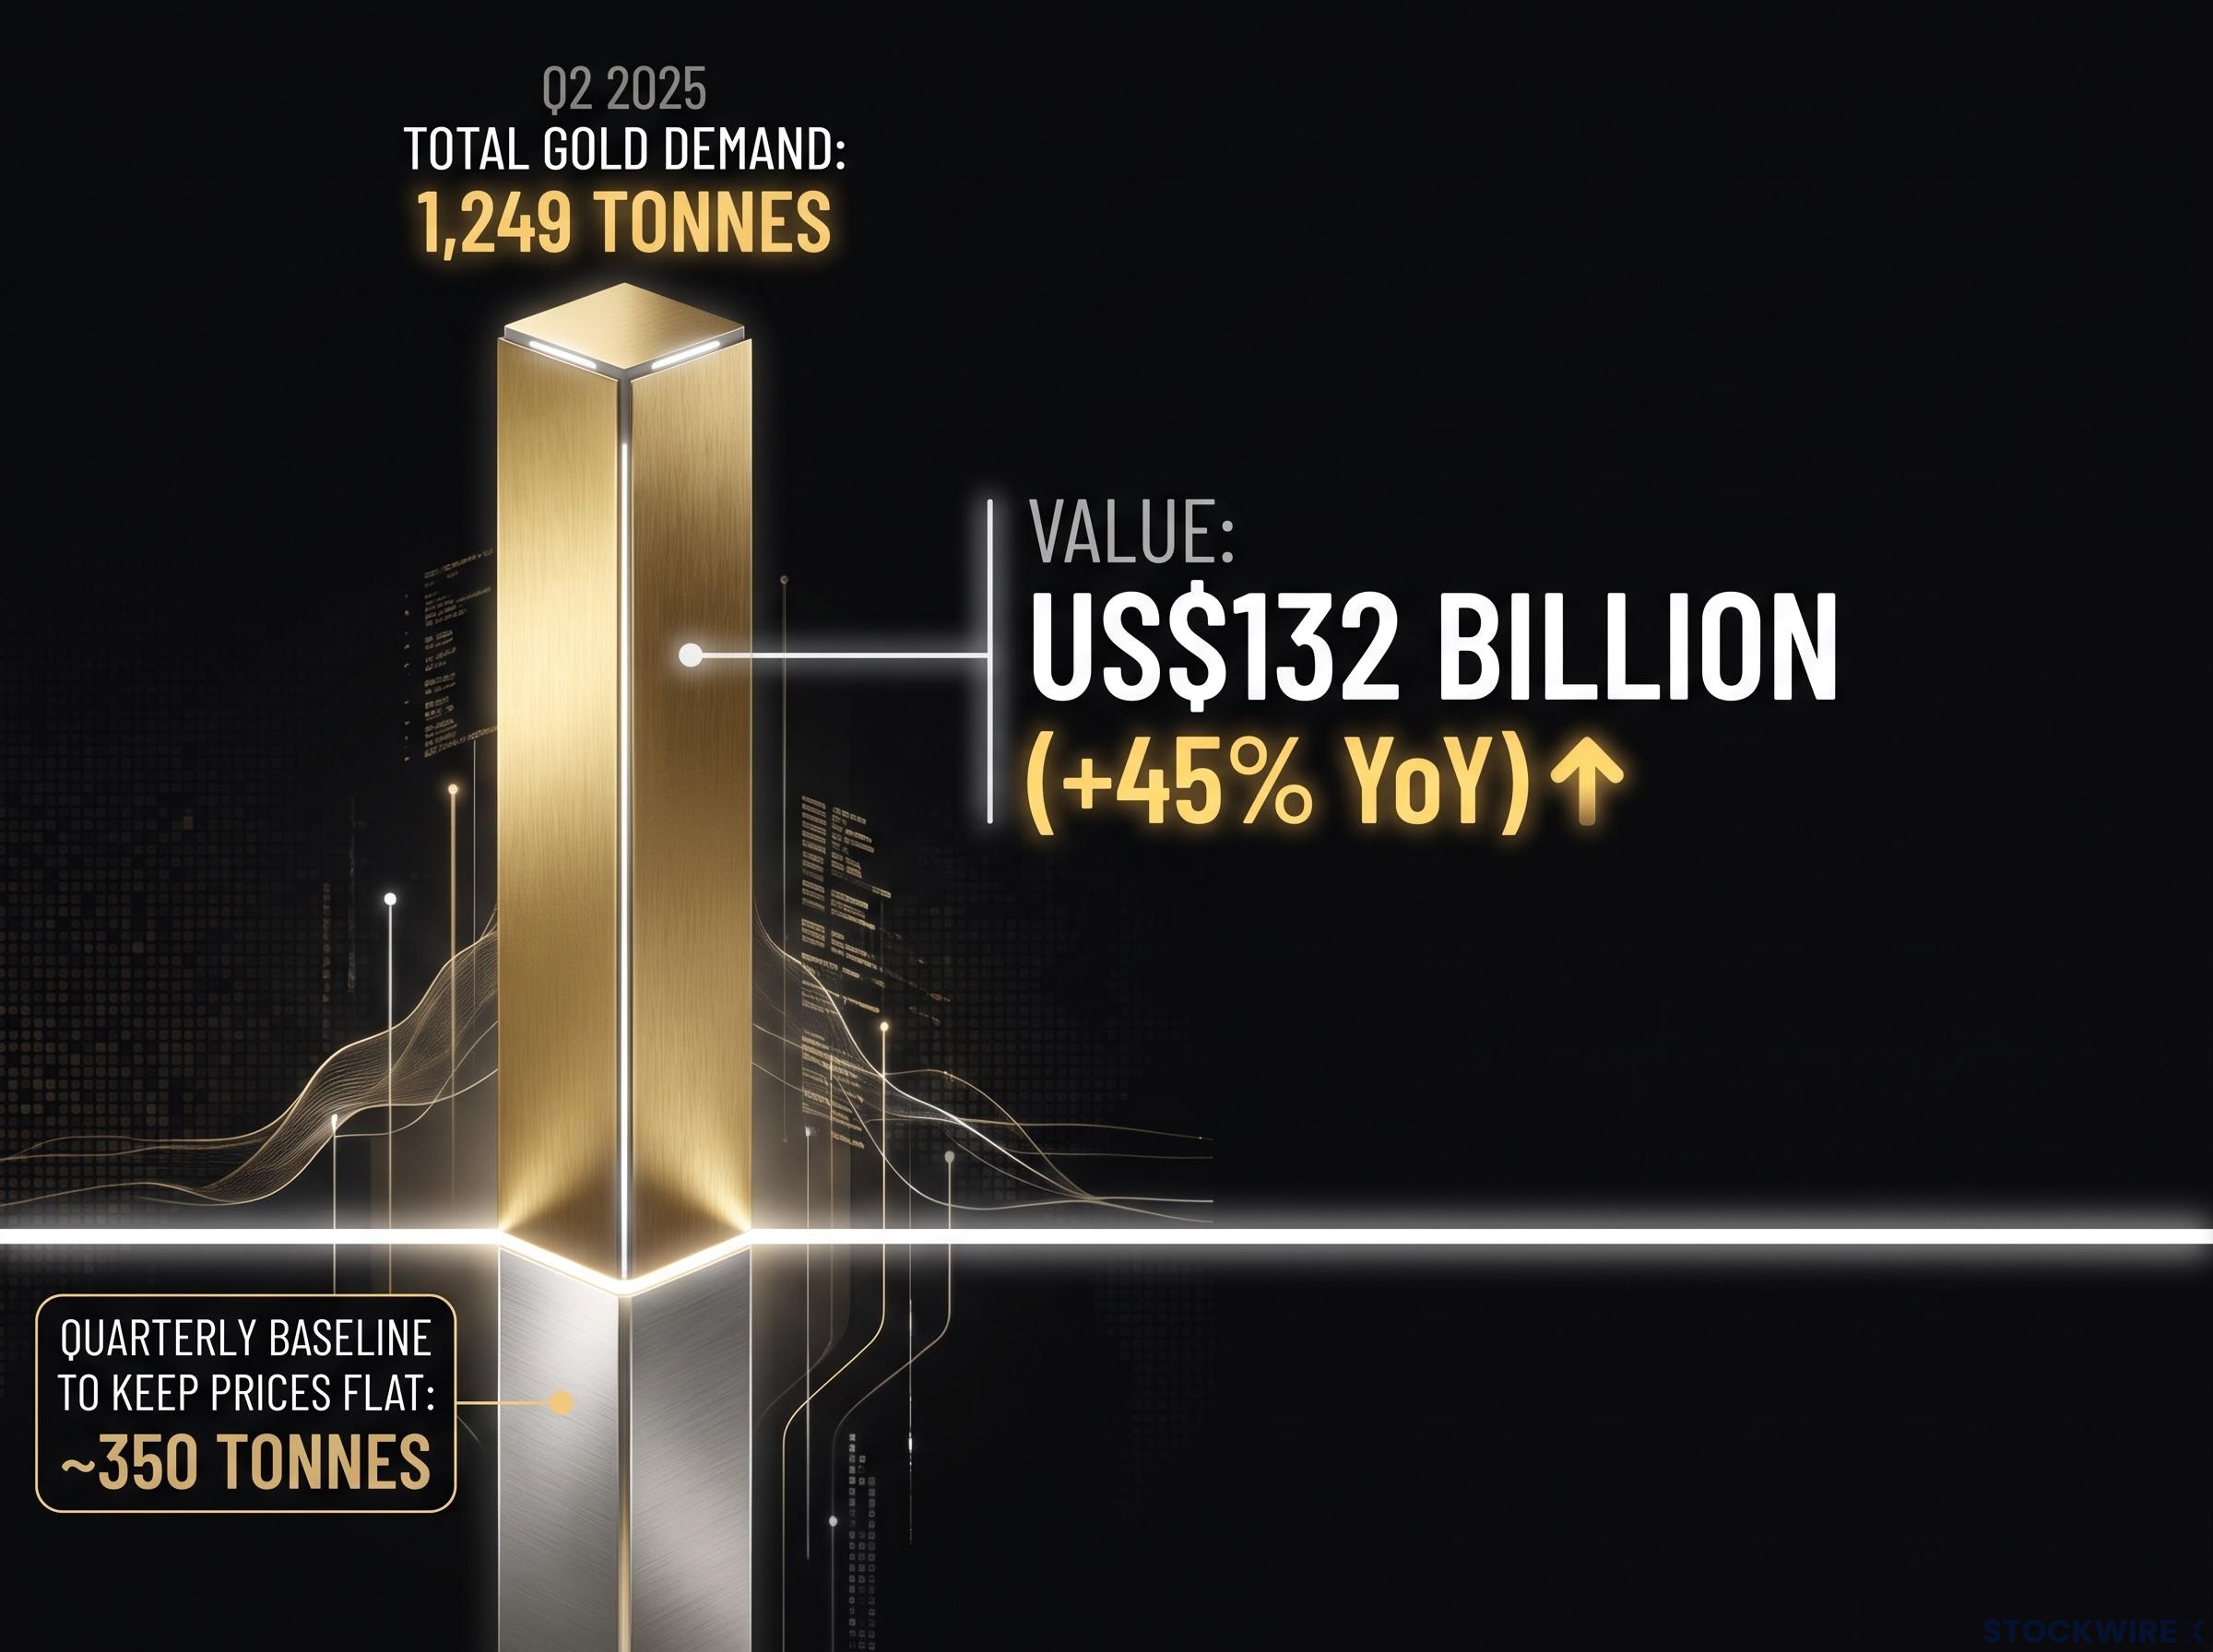
That threshold tells you something official-sector headlines cannot. If private investment demand softens materially, central banks alone cannot hold current price levels, regardless of how many consecutive months they keep buying. Investment demand sits on equal or greater footing with official buying in sustaining the price.
New entrants and what they signal about gold’s broadening base
The investor base is not just large. It is widening in ways that suggest a durable shift.
Reuters (17 December 2025) attributed part of the 2025 surge to new participants, naming stablecoin issuer Tether and corporate treasurers. Tether’s use of gold as reserve collateral shows crypto-adjacent institutions treating the metal as balance-sheet backing, a category that did not meaningfully exist a few years ago.
Corporate treasurers allocating cash into gold represent a second structural expansion, moving the institutional buyer base beyond traditional ETF and fund flows. When entirely new categories of institution enter a market, it usually reflects a lasting change in how the asset is perceived, not tactical positioning.
For investors, the practical implication is a change of dashboard. The variables that actually move gold are ETF flow data, retail bar and coin demand, and the macro conditions that drive institutional hedging, not central bank reserve disclosures. Gold has held above $4,000 through most of 2026 on the strength of that private layer, even as the price sits down roughly 5.8% year-to-date from its January peak.
What a gold bear market would actually require
The reversal question is best treated as conditions-mapping, not forecasting. The evidence supports naming variables to watch rather than issuing confident predictions.
On the demand side, three triggers would apply real downward pressure. A meaningful slowdown in ETF inflows would remove the marginal buyer. Central bank buying fatigue at elevated prices would erode the official-sector pillar. Continued jewellery weakness would undercut the broader base; jewellery demand fell 23% in one Q3 period, offset only partly by retail bar and coin buying.
Then there is the mechanism most investors overlook. The WGC Q2 2025 Outlook states plainly that “a strong rise in prices should, from a prudential perspective, put the brakes on accumulation.” The very prices that appear to validate the bull case are the same prices that discourage further central bank buying, a self-limiting dynamic baked into the official sector at high price levels.
The price trajectory from above $5,500 to near $4,000 in under six months illustrates speculative washout dynamics rather than a structural breakdown: global gold ETFs recorded net outflows of $8.9 billion in June 2026 alone, confirming that momentum money was exiting while the underlying sovereign accumulation thesis remained intact.
| Risk factor | Current status | Threshold that would matter |
|---|---|---|
| ETF inflows | Strong, primary demand driver | Sustained outflows reversing 2024-25 accumulation |
| Central bank buying pace | Reaccelerating, 289 tonnes in Q2 2026 | Prudential ceilings capping purchases at high prices |
| Jewellery demand | Under pressure, down 23% in one Q3 period | Persistent weakness in price-sensitive markets |
| Real yields and dollar strength | Supportive of gold currently | Higher real yields, stronger and more credible dollar |
| Geopolitical conditions | Elevated tension supporting hedging demand | Sustained de-escalation reducing safe-haven need |
For a sustained reversal rather than a pullback, CPM Group’s Jeff Christian identifies a set of structural prerequisites, in rough order of weight:
- Meaningful reductions in armed conflict
- Greater international and domestic political cooperation
- Restored social cohesion
- Responsible management of deficits and debt
Christian does not expect these governance improvements to arrive within at least the next several years. Reuters (17 December 2025) separately flagged that both central bank purchases and ETF inflows are expected to slow in 2026, naming both as potential sources of price consolidation. JP Morgan’s 2026 forecasts, revised upward through the year, point to a range of roughly $5,000-6,000 per ounce, which should be read as directional rather than precise given the sequence of revisions.
The actionable read is this. Monitoring ETF flows, real yields, geopolitical de-escalation signals, and jewellery demand in price-sensitive markets tells you more about marginal price movement than any central bank purchase headline, because those variables are more elastic and more directly connected to the price.
Past performance does not guarantee future results. Financial projections are subject to market conditions and various risk factors, and these statements are speculative and subject to change based on market developments.
Reading gold correctly means following the right actors
The core reorientation is simple to state. Central banks are visible, narratively compelling, and genuinely important, but they are a secondary driver. Private investors are the marginal price-setting force and the variable most worth your attention.
The real weighting Central banks are projected to represent approximately 14% of the gold market going forward, according to CPM Group.
None of this dismisses official-sector buying. The PBoC has now added gold for 22-23 consecutive months as of August 2026, with holdings at 76.73 million fine troy ounces (approximately 2,386 tonnes), and the WGC’s 2026 survey found 89% of reserve managers expect global holdings to rise. That is meaningful context, but as a sentiment signal, not proof of where the price goes.
So when the next “central banks are driving gold higher” headline appears, you now have two counterquestions ready: what share of total demand does that buying actually represent, and what are ETF flows doing at the same time? With spot near $4,142 against a 52-week range of roughly $3,825-$5,405, the variables that would reverse this bull market are macro and behavioural, and right now they are not pointing toward reversal.
This article is for informational purposes only and should not be considered financial advice. Investors should conduct their own research and consult with financial professionals before making investment decisions.