Why a New Fed Chair Changes Less Than Markets Assume
34 mins ago

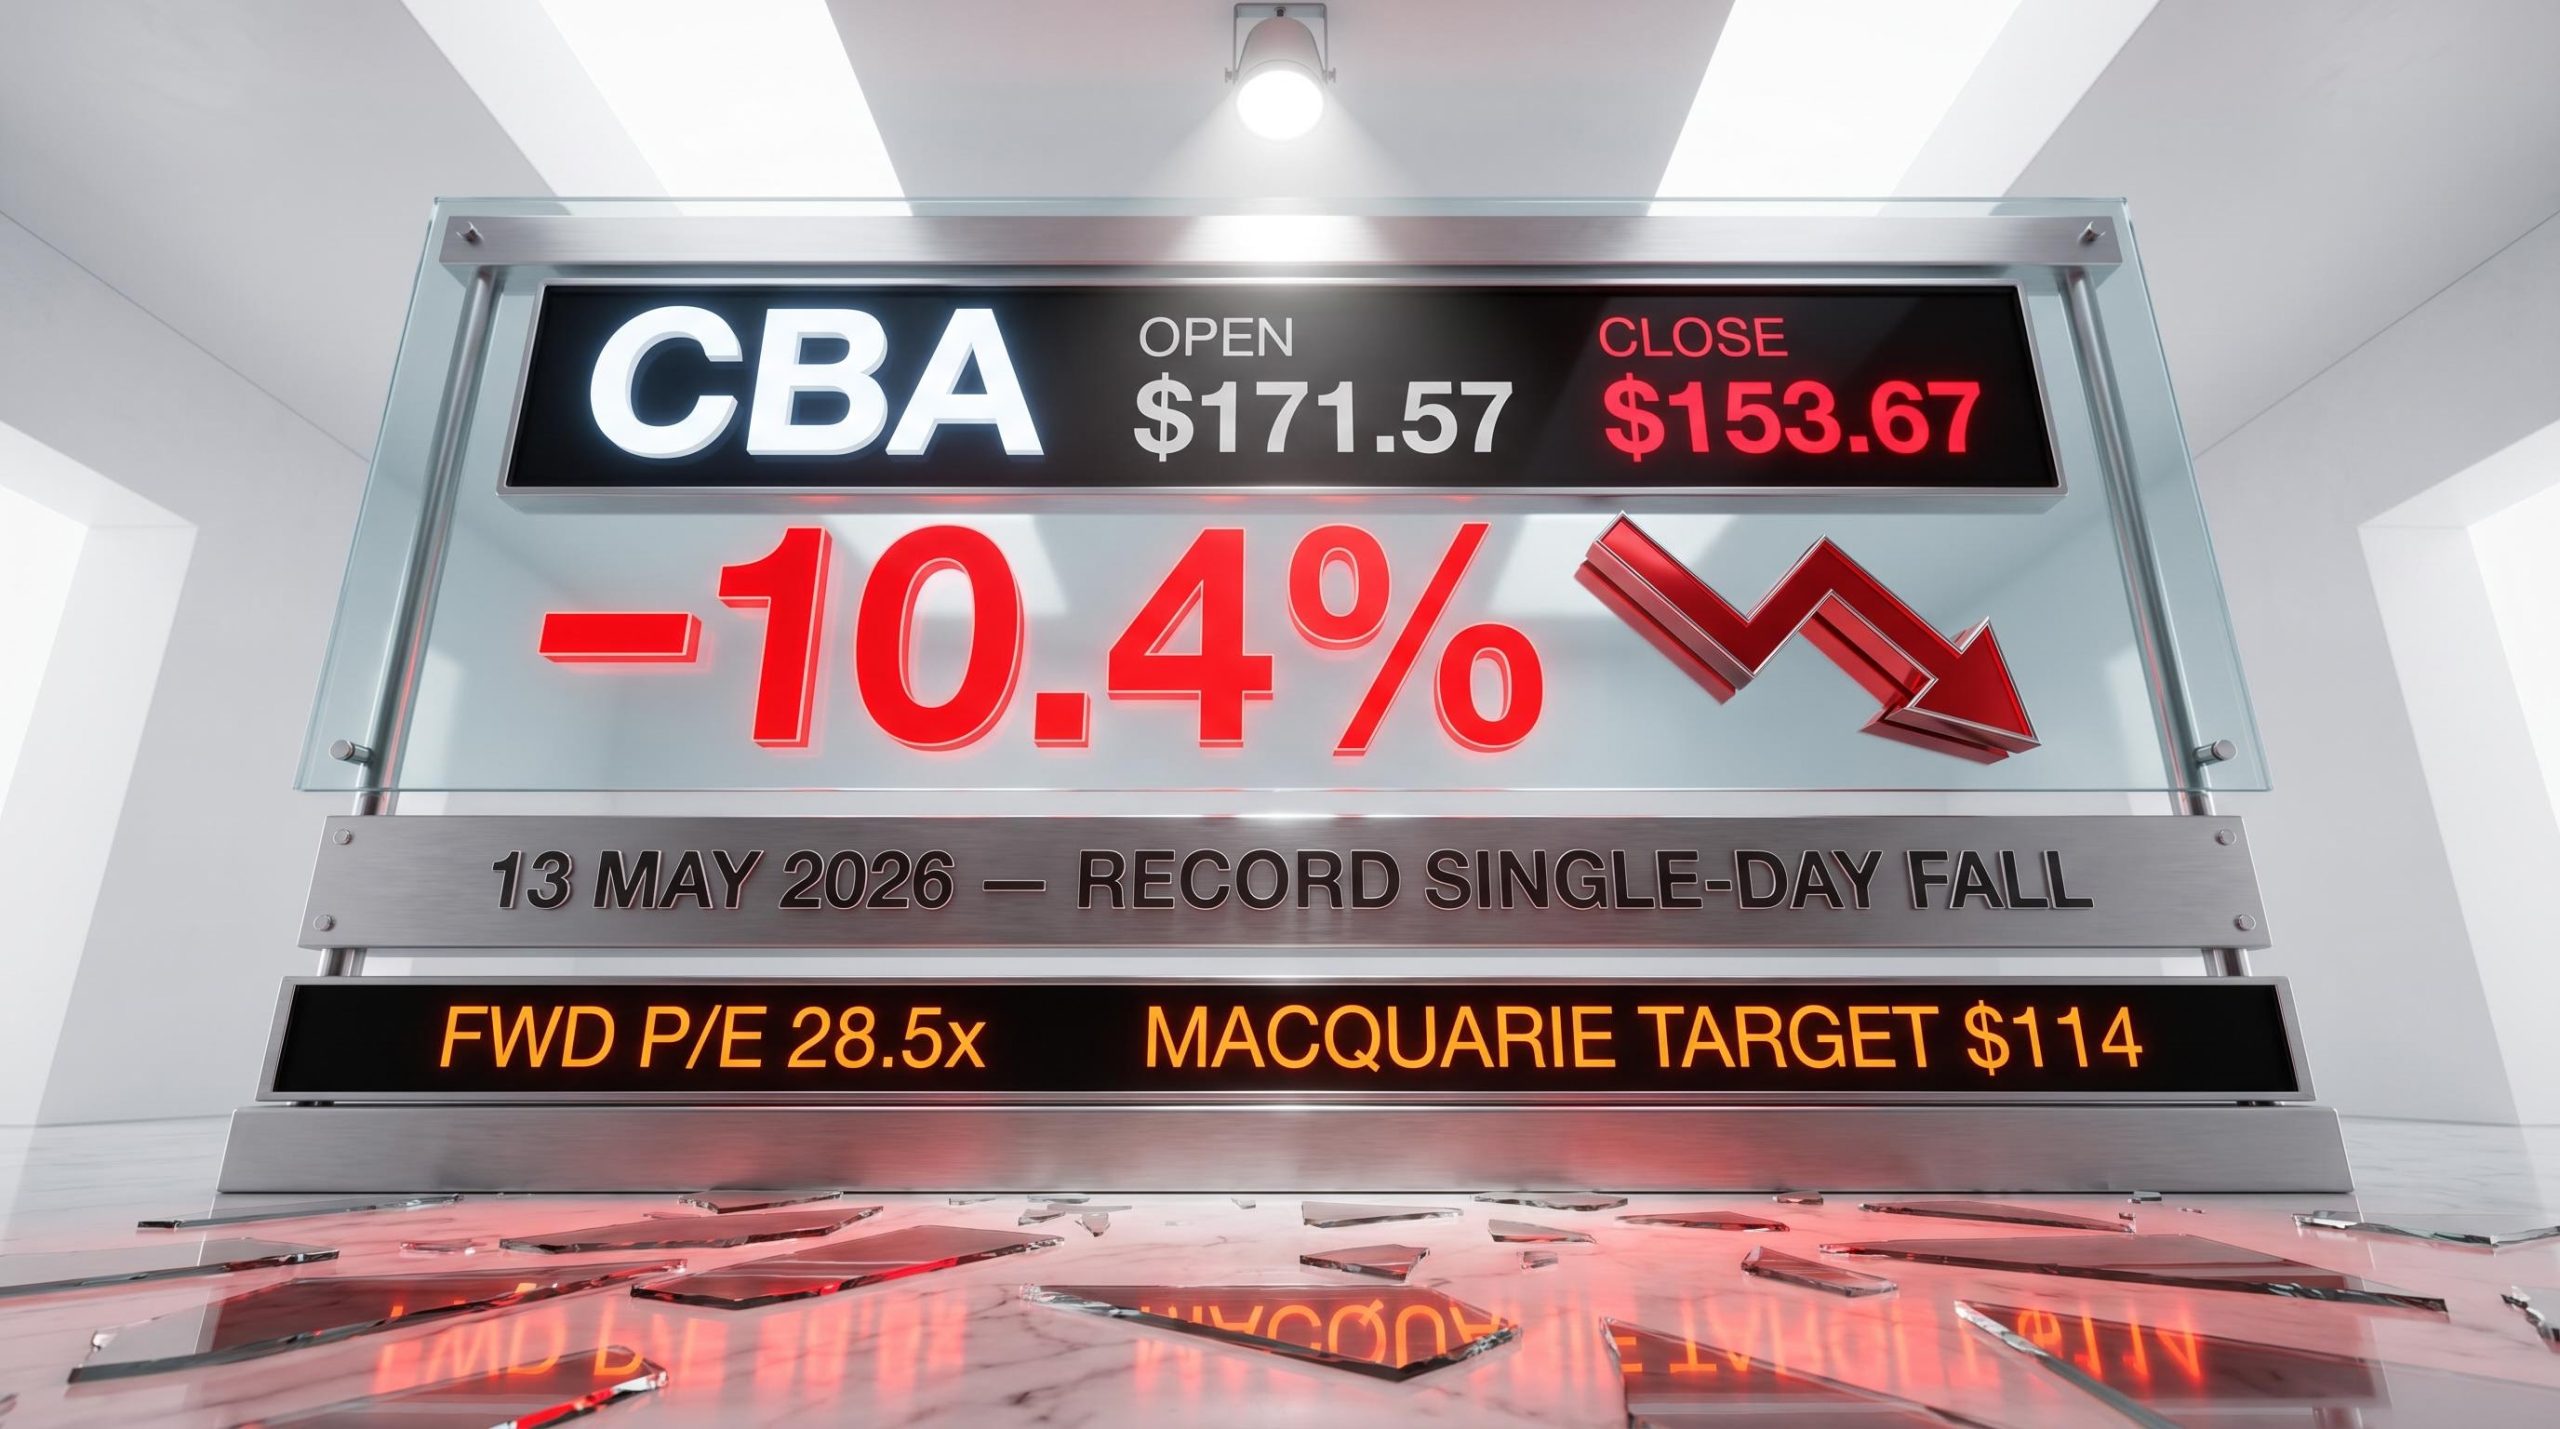
Commonwealth Bank of Australia shares recorded their largest ever single-day decline on Wednesday 14 May 2026, falling 10.4% in a single session that wiped the stock back to $159.40 by week’s end and pushed its 12-month return to negative 6.09%. The trigger was a Q3 FY2026 cash profit of approximately $2.7 billion, a number that was technically sound but accompanied by a deliberate build in collective loan-loss provisions against elevated macro risks. The market’s response was disproportionate to the headline figure, and that disproportion is precisely what has drawn technical analysts into the conversation alongside institutional brokers. What follows places broker price targets alongside historical pattern analysis so readers can assess whether this is a short-term dislocation or the opening phase of a structural re-rating.
The unaudited Q3 FY2026 figures told a story of stability, not distress. Cash net profit after tax came in at approximately $2.7 billion, up 4% on the prior corresponding period and down just 1% on the first-half quarterly average. Statutory net profit after tax was approximately $2.6 billion. Operating income was flat quarter-on-quarter.
| Metric | Q3 FY2026 | Comparison |
|---|---|---|
| Cash NPAT | ~$2.7 billion | Up 4% on prior corresponding period |
| Statutory NPAT | ~$2.6 billion | Unaudited |
| Operating income | Flat | Quarter-on-quarter |
| Trailing dividend yield | 3.11% | $4.95 per share, fully franked |
The analytically significant move was not the modest profit dip. It was the deliberate increase in collective provisions, a decision management made despite an already strong provisioning base. CBA cited Middle East supply chain disruption as a macro risk factor underpinning the build.
Wednesday 14 May 2026: CBA shares fell 10.4% in a single session, the largest one-day decline in the bank’s listed history, closing the week at $159.40 for a weekly fall of 9.39%.
A 1% quarterly profit decline produced a 10.4% single-session share price collapse. That gap between the result and the reaction is the analytical puzzle the rest of this piece resolves.
The expectations gap in earnings reactions explains why a technically sound $2.7 billion quarterly profit produced a 10.4% single-session decline: the market was not pricing the result in isolation but against the implicit forward signals embedded in the provision build and management commentary.
The sell-off did not arrive without context. Since 2020, CBA’s share price had increasingly behaved like a momentum-driven growth stock rather than a major Australian bank, diverging from its historical trading pattern in ways that Wealth Within’s technical analysis team has characterised as structurally significant.
The acceleration was visible in the way the stock attracted capital beyond what its earnings growth justified. Momentum attracted further momentum. By the time the 12-month return had already slipped to negative 6.09% before the Q3 release, the deceleration phase was underway; the results simply provided the catalyst.
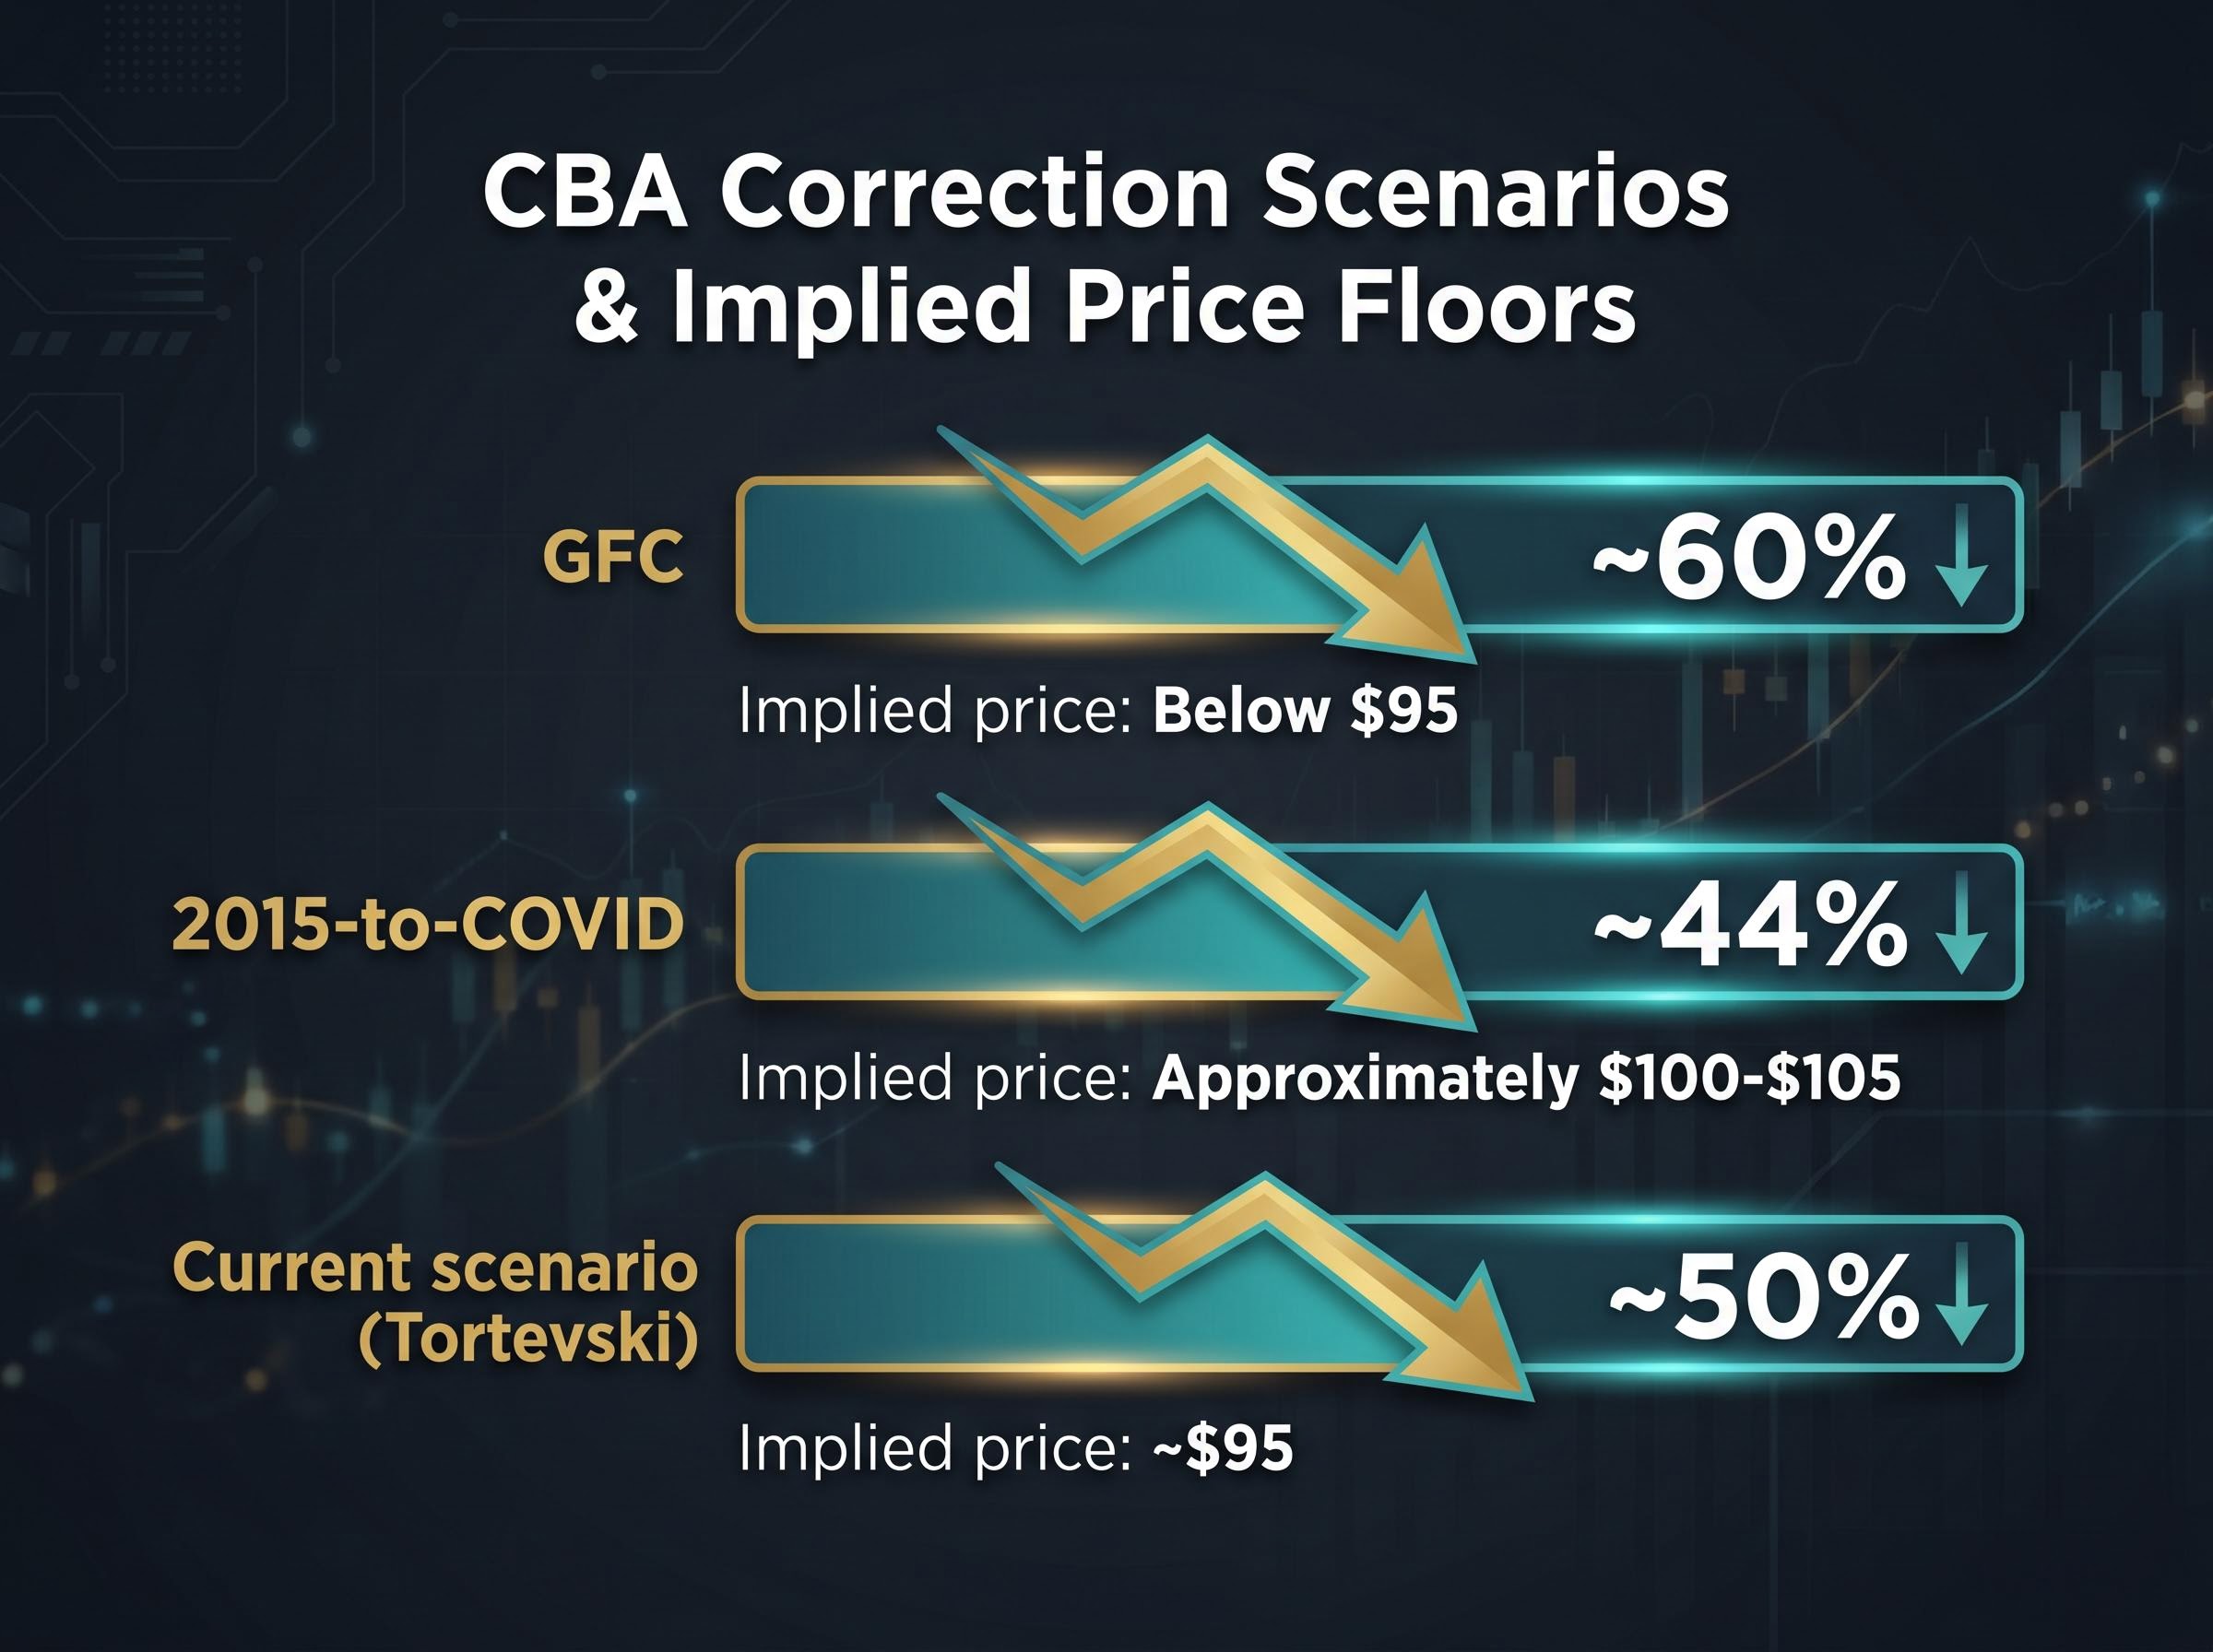
CBA has experienced two prior corrections of structural magnitude. During the Global Financial Crisis, shares declined approximately 60%. From 2015 through to the COVID-19 low, the decline was approximately 44%.
Both corrections were preceded by acceleration phases in which the stock’s price behaviour departed from historical norms. Filip Tortevski, Senior Analyst at Wealth Within, has characterised the post-2020 phase as structurally similar to those prior acceleration periods, a reading that gives his current scenario analysis its foundation.
Tortevski’s analysis produces a number that warrants serious consideration rather than dismissal: $95 per share. The methodology is straightforward. If the current sell-off mirrors the initiation phase of prior structural corrections, a comparable percentage decline from CBA’s recent highs produces a price in that range.
Filip Tortevski of Wealth Within has characterised Wednesday’s 10.4% decline as potentially “the first significant warning sign” of a correction cycle rather than an isolated event.
The logic rests on historical pattern matching, not earnings modelling. The GFC delivered an approximately 60% peak-to-trough decline. The 2015-to-COVID correction delivered approximately 44%. A decline of similar magnitude from recent highs implies a floor that the technical evidence, according to Tortevski, cannot exclude.
| Correction period | Peak-to-trough decline | Implied CBA price at equivalent decline |
|---|---|---|
| GFC | ~60% | Below $95 |
| 2015-to-COVID | ~44% | Approximately $100-$105 |
| Current scenario (Tortevski) | ~50% | ~$95 |
This is not a price target in the broker sense. It is a historically-derived scenario that a disciplined technical analyst states cannot be ruled out. Even investors who consider it unlikely benefit from stress-testing their position against it, particularly those holding CBA in self-managed superannuation funds (SMSFs) where concentration risk is a material planning consideration.
Past performance does not guarantee future results. Historical correction patterns are not predictive instruments and are subject to market conditions and various risk factors.
A broker 12-month price target is one of the most widely cited and least well understood numbers in Australian retail investing. Before examining the specific Macquarie and Jefferies positions, it is worth establishing what the number is and what it is not.
A broker price target represents a single analyst team’s estimate of where a stock’s price should trade in 12 months, typically derived from discounted cash flow modelling or peer multiple analysis. It carries assumptions about earnings, margins, and the macroeconomic environment that may or may not materialise.
What a broker price target is:
What a broker price target is not:
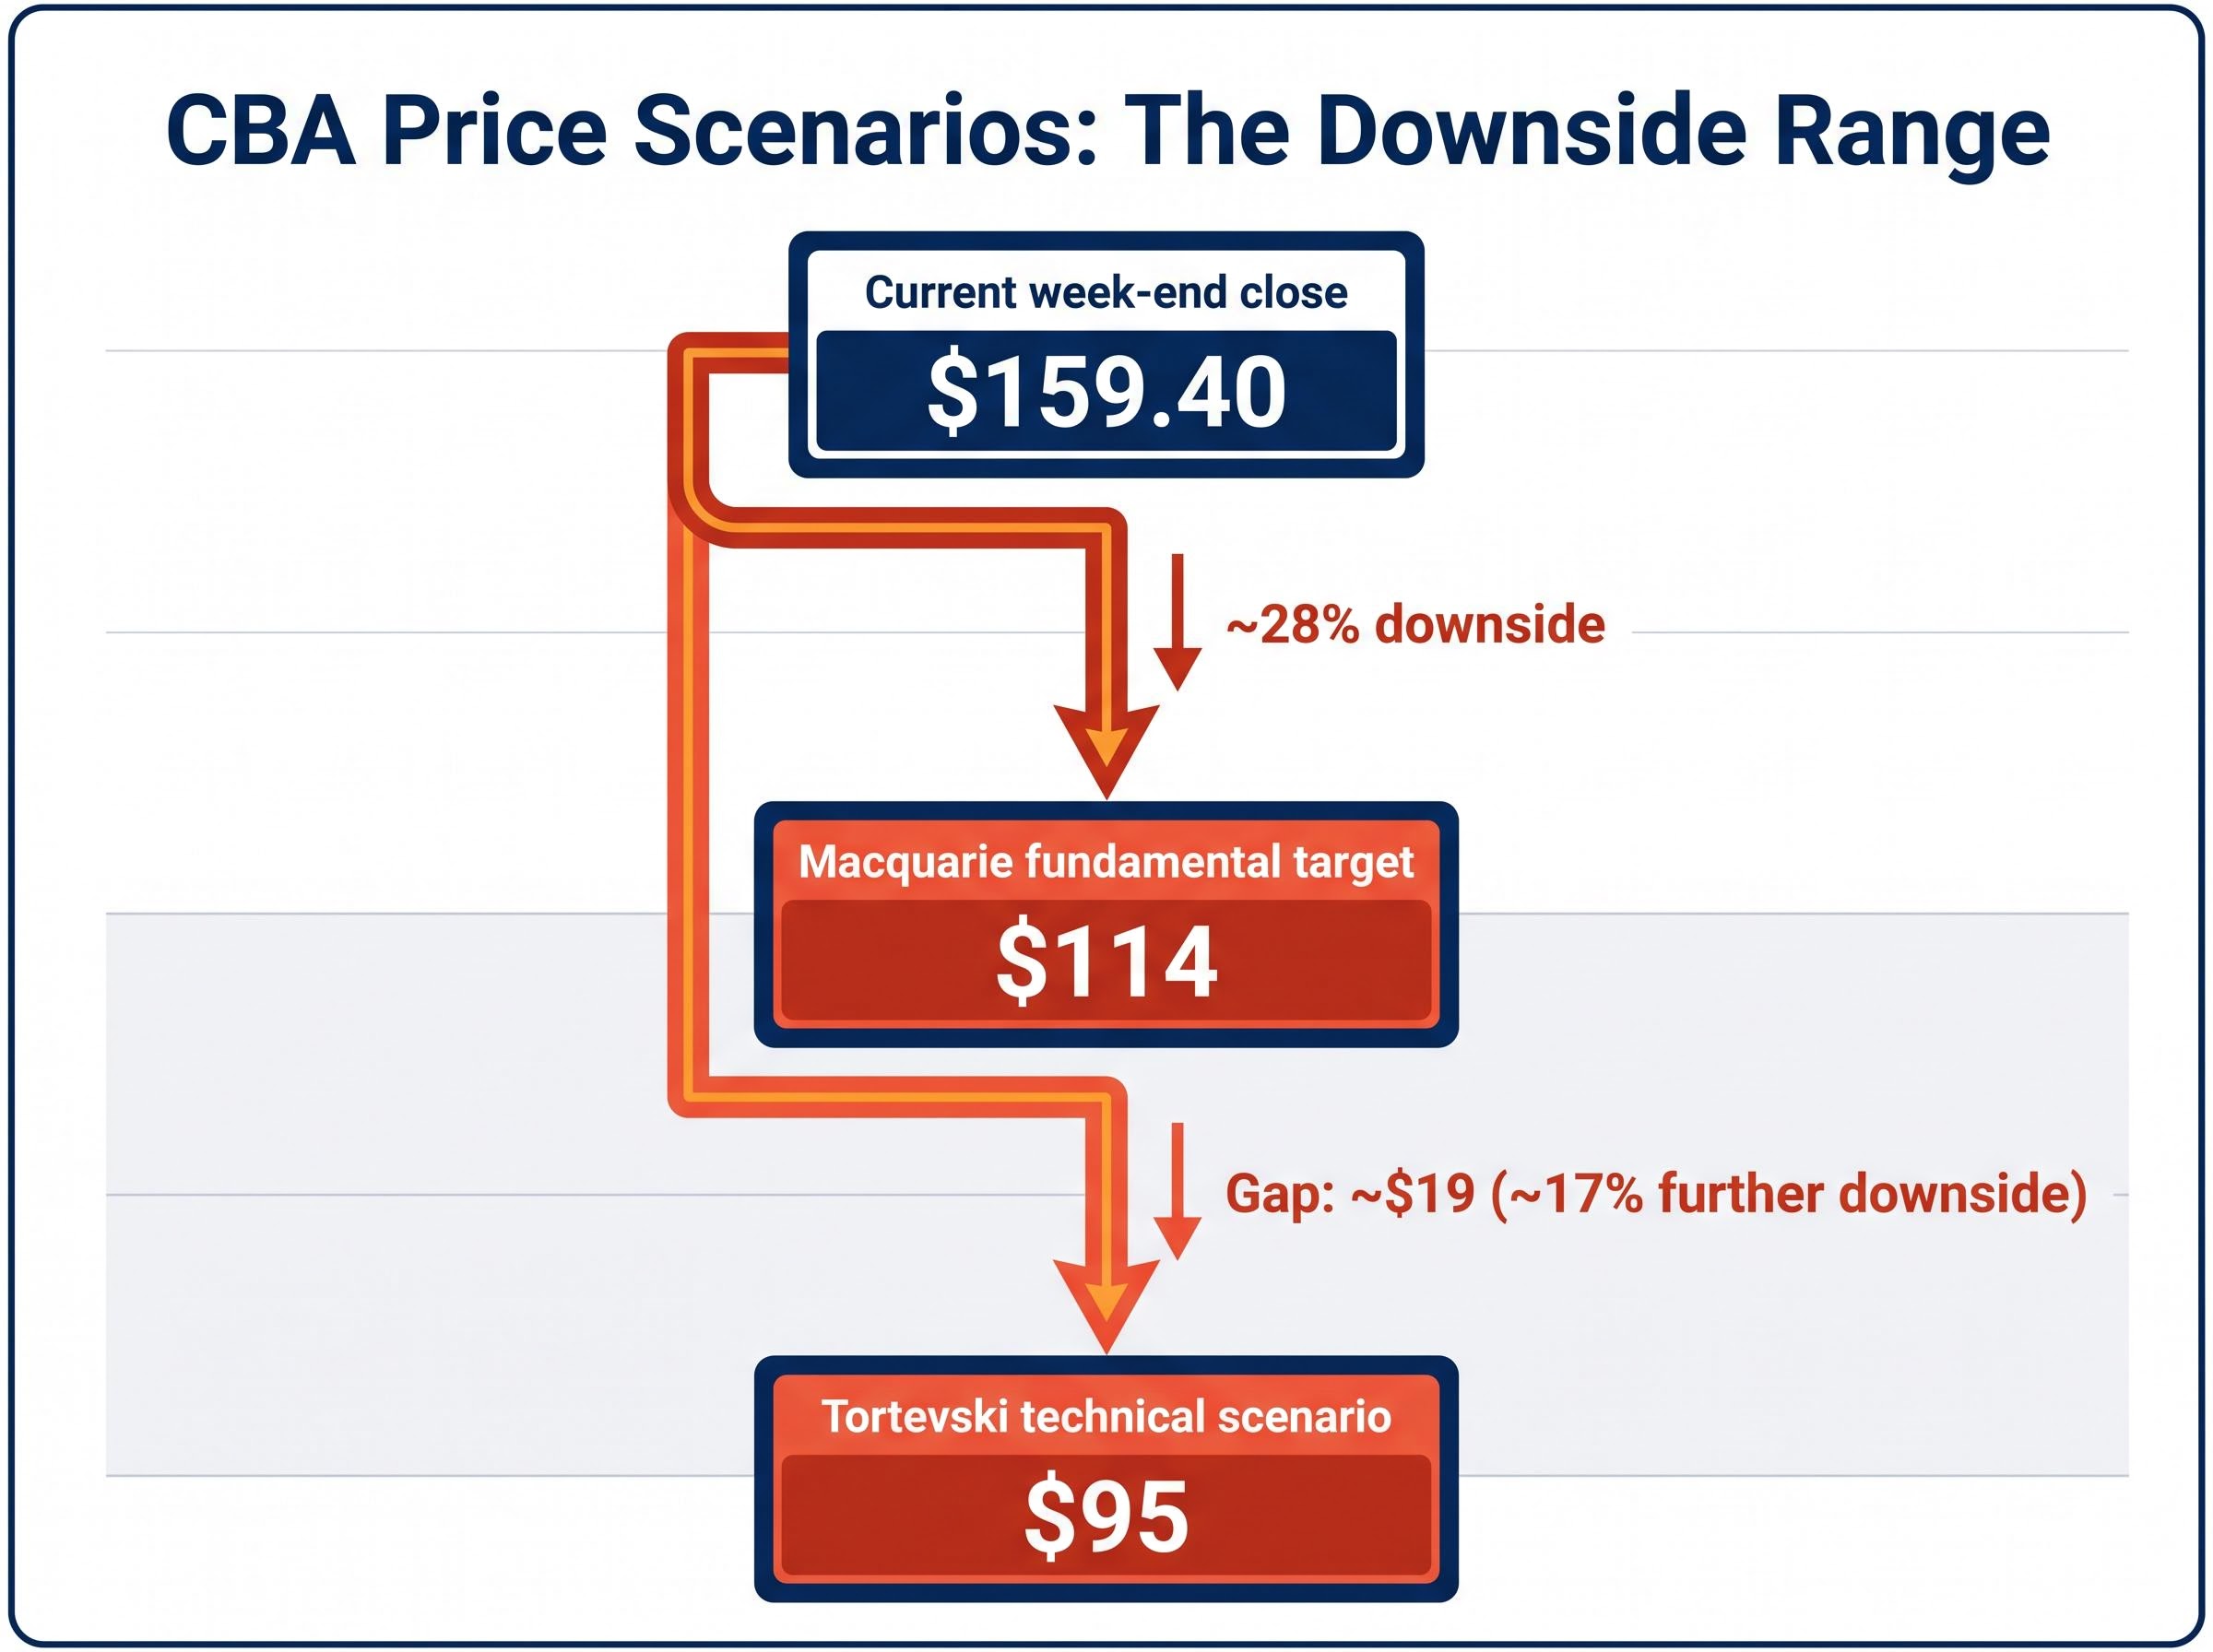
Macquarie maintains an Underperform (Sell) rating on CBA with a 12-month price target of $114. From the $159.40 week-end close, that implies approximately 28% downside.
Jefferies also holds an Underperform rating, establishing that the bearish analytical view extends across at least two major institutions. A verified aggregate consensus target from multiple brokers has not been located as of 16 May 2026.
Unanimous sell ratings on CBA were already in place across covering analysts well before the Q3 result, a consensus position that becomes significantly harder to ignore when technical analysis and the bank’s own provision signals align in the same direction.
The gap between the Macquarie fundamental target ($114) and the Tortevski technical scenario ($95) is worth holding in mind. It is approximately $19, or roughly 17% of further downside beyond the broker target. Both numbers sit well below the current price. Both derive from different methodologies, and both point in the same direction.
CBA has long traded at a premium to its domestic and global banking peers. Elevated valuation multiples do not cause corrections, but they amplify the magnitude of re-rating when sentiment shifts. The higher the premium, the further the fall when the market recalibrates.
The provision build announced alongside the Q3 results is a forward-looking signal from management itself. CBA chose to increase collective provisions despite an already strong provisioning base, citing Middle East supply chain disruption as one macro risk factor. That decision signals management’s own assessment that credit conditions may deteriorate.
APRA Prudential Standard APS 220 sets the regulatory framework governing how authorised deposit-taking institutions classify credit quality and maintain collective provisions, which means CBA’s decision to build its provisioning base is not a discretionary accounting choice but a response to obligations that require management to act on forward-looking assessments of credit risk.
Management’s provision signal: CBA’s deliberate increase in collective loan-loss provisions, despite an already strong provisioning base, represents the bank’s own forward assessment of rising credit risk, a signal worth weighing independently of external analyst commentary.
For the broader Australian banking sector, rising provisions at the country’s largest bank carry implications beyond a single stock. For SMSF trustees and concentrated individual holders, the structural question matters more than any single session’s movement.
Credit impairment charges across the sector were already accelerating before CBA’s Q3 disclosure, with NAB’s $706 million charge in April 2026 linked to stress in agriculture, transport, and manufacturing, a pattern that suggests the provision build at CBA is less an isolated management decision and more a sector-wide response to deteriorating credit conditions.
Risk factors Australian bank stock holders should monitor in the next two quarters:
The trailing fully-franked dividend yield of 3.11% provides a yield floor for income-focused holders, but yield alone does not compensate for a 28-50% capital decline if either the Macquarie or Tortevski scenarios prove directionally correct.
The analysis above establishes a plausible downside range of $114 (Macquarie’s fundamental target) to $95 (Tortevski’s technical scenario). Position-sizing relative to that range is the practical decision at hand. Three investor profiles help frame the relevant questions:
Technical patterns do not produce reliable short-term timing signals. If a correction cycle is unfolding, it may take quarters rather than days to develop. The speed of Wednesday’s decline does not imply the remainder of any correction would arrive at the same pace.
Analyst price targets and technical scenarios are not personal financial advice. This article is for informational purposes only and should not be considered financial advice. Investors should conduct their own research and consult with financial professionals before making investment decisions.
Neither technical pattern analysis nor broker price targets are predictive instruments with precision. They are probabilistic frameworks that define the range of reasonable outcomes, and they are most useful when they converge directionally, as they do here.
Macquarie’s $114 target implies significant fundamental overvaluation at current levels. Tortevski’s $95 scenario implies the current move may be the opening phase of a structural correction. Both can be directionally correct simultaneously; the difference is one of magnitude and timeframe.
The next decisive data point will be CBA’s full-year FY2026 results. Whether the provision trajectory extends or reverses will clarify which analytical framework is tracking reality more closely. Until then, the stock sits at $159.40, roughly $45 above one scenario and $64 above the other.
Readers who leave this analysis with a clear sense of that range, and what to watch next, are better equipped than those who leave with a single number they may over-trust.
These statements are speculative and subject to change based on market developments and company performance.
CBA reported a Q3 FY2026 cash net profit of approximately $2.7 billion, which was broadly sound, but management also announced a deliberate build in collective loan-loss provisions citing Middle East supply chain disruption as a macro risk. The market reacted sharply to the forward-looking provision signal and the implicit warning embedded in management commentary, producing a 10.4% single-session decline.
A broker price target is a fundamentally derived estimate of where an analyst team believes a stock should trade in 12 months, typically based on discounted cash flow modelling or peer multiple analysis. It reflects one institution's modelling assumptions and is most useful as a reference point when triangulated with other signals, such as technical analysis, rather than treated as a guarantee of future price movement.
Macquarie holds an Underperform rating on CBA with a 12-month price target of $114, which implies approximately 28% downside from the $159.40 week-end close recorded on 16 May 2026. Jefferies also carries an Underperform rating, establishing that the bearish analytical view extends across at least two major institutions.
The $95 scenario was produced by Filip Tortevski, Senior Analyst at Wealth Within, using historical pattern matching rather than earnings modelling. It is derived by applying decline magnitudes comparable to CBA's two prior structural corrections, the GFC (approximately 60%) and the 2015-to-COVID period (approximately 44%), from recent highs, producing a historically informed scenario that Tortevski states cannot be ruled out.
CBA's trailing fully-franked dividend yield stands at 3.11% (based on $4.95 per share), which provides an income floor for holders, but the article notes that yield alone does not compensate for a 28-50% capital decline if the Macquarie or Tortevski downside scenarios prove directionally correct. Income-focused investors are advised to assess how many years of dividend income would be required to recover a 28% capital loss before making position-sizing decisions.