Commonwealth Bank of Australia just paid the biggest dividend in its history, and for income investors the timing could hardly be more awkward. Most of them are still better off looking elsewhere.
The record $5.05 per share fully franked payout for FY2026 sounds like a compelling income story until you set it against what NAB, ANZ, and Westpac are offering at today’s prices. With CBA shares at $152.75 after a 15% pullback from their August peak, the trailing yield lands at just 3.3%. Its three rivals are yielding 4.4% to 4.5%.
That gap, more than one full percentage point in cash terms and wider still once franking credits enter the calculation, is the tension any income-focused investor in ASX banks has to resolve before committing capital. This piece maps the yield gap, explains why it exists, surfaces what an unusually uniform analyst consensus says about the risk of staying in CBA for income, and hands you a framework for weighing passive income against total return risk at current prices.
CBA’s record dividend, and why the yield number undersells the gap
The headline is genuinely impressive. CBA declared a final dividend of $2.70 per share following its full-year results on 11-12 August 2026, which combined with the $2.35 interim paid on 30 March 2026 to reach a record $5.05 per share for the year. Both instalments were fully franked at the 30% corporate tax rate, and the total sits 4.1% above FY2025. It arrived alongside cash net profit after tax of $11 billion, up 7%.
CBA FY2026 dividend: $5.05 per share, fully franked
Then the yield arithmetic reframes the record. Divide $5.05 by the current $152.75 share price and the trailing cash yield comes to just 3.3%. Grossing that up for the value of the franking credits lifts it to roughly 4.0-4.1%. A record payout, but a modest income return, because the price has climbed faster than the dividend.
Now compare it directly with the field.
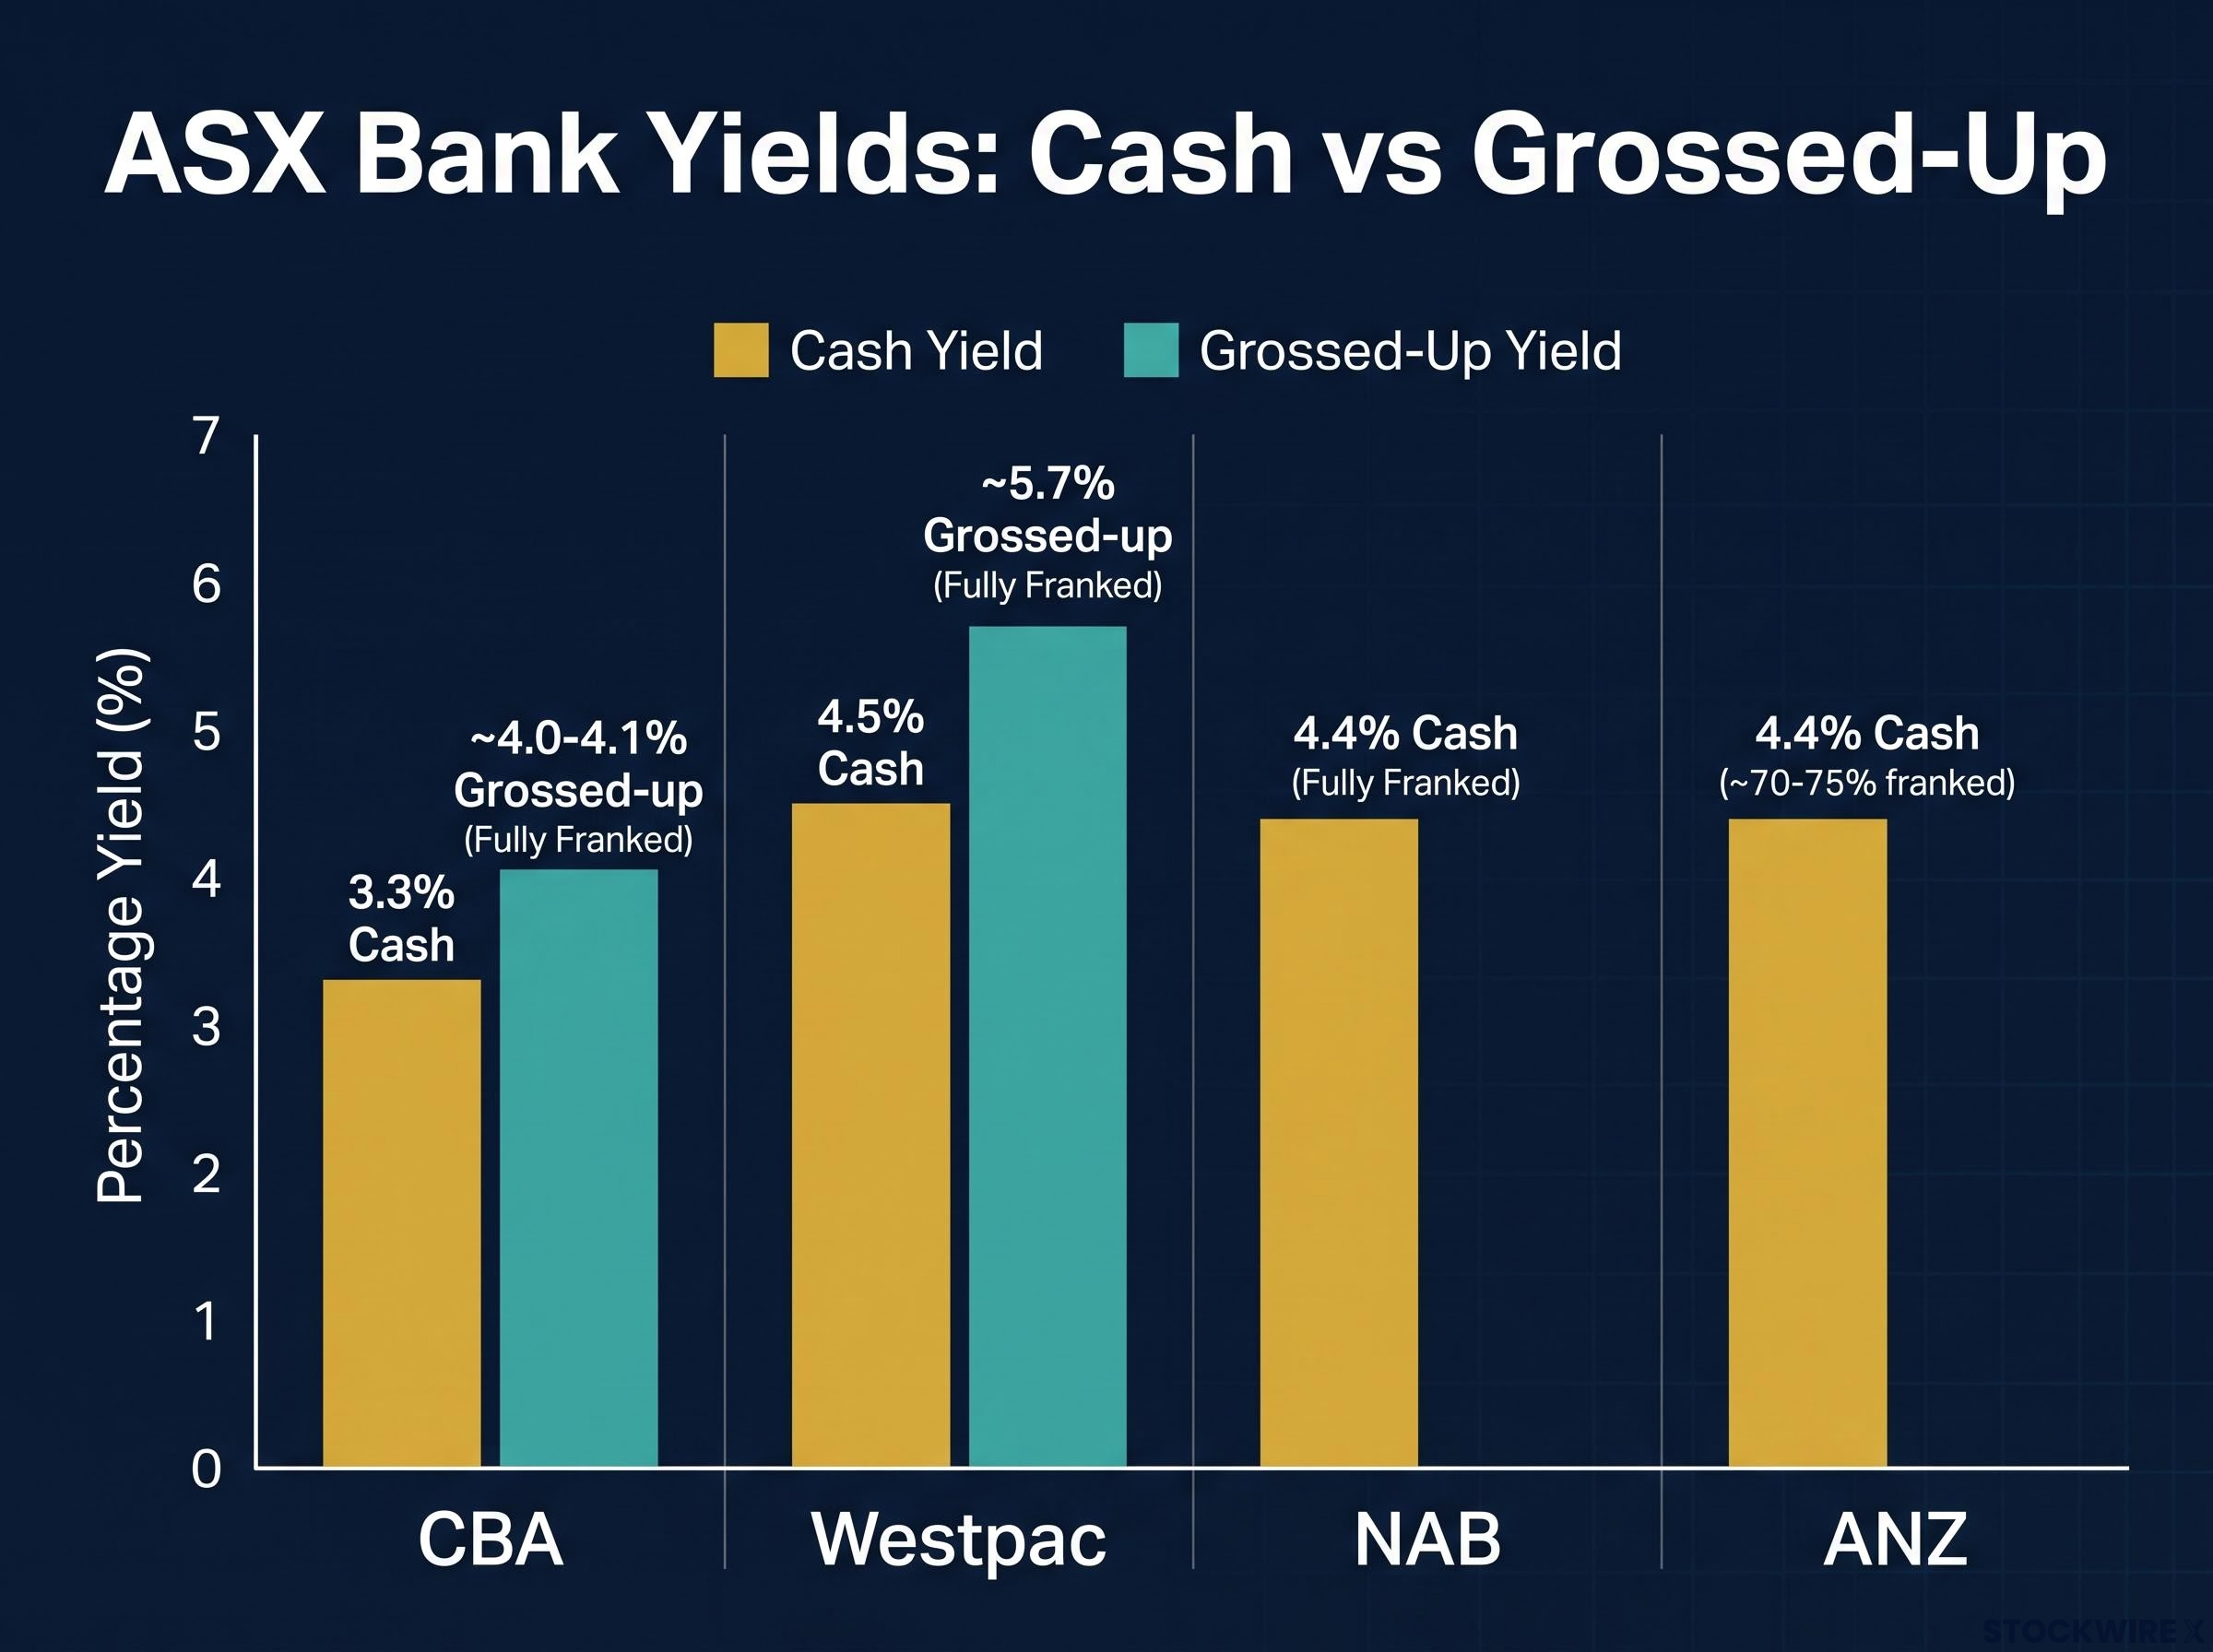
| Bank | Cash Yield | Franking | Grossed-Up Yield |
|---|---|---|---|
| CBA | 3.3% | Fully franked | ~4.0-4.1% |
| Westpac | 4.5% | Fully franked | ~5.7% (FY25 basis) |
| NAB | 4.4% | Fully franked | Higher than cash |
| ANZ | 4.4% | ~70-75% franked | Partial uplift only |
For an Australian taxpayer entitled to franking credits, the grossed-up figure is the number that matters, not the headline cash yield. And here is where the ranking sharpens: ANZ’s higher cash yield is only partially franked, at around 70-75%, so its after-tax uplift is smaller than its headline suggests. Westpac and CBA, both fully franked, are the cleaner comparison, and on that basis Westpac’s advantage over CBA is wide. The franking adjustment narrows a few gaps but closes none of them.
The grossed-up franking calculation follows a fixed formula: cash dividend multiplied by 30, divided by 70, reflecting the 30% corporate tax already paid at the company level, so CBA’s $5.05 fully franked dividend produces a gross equivalent of approximately $7.21 per share before any investor-level tax.
When big ASX news breaks, our subscribers know first
Why does CBA trade at a premium, and how wide is it really?
The yield gap is not an accident. It is the direct output of what investors are paying for CBA’s earnings, and the valuation lenses tell a consistent story.
Start with the price-to-earnings (P/E) ratio, which measures how many dollars investors pay for each dollar of a company’s annual profit. According to Investing.com data from 19 August 2026, CBA traded on a trailing P/E of 24.9x and a forward P/E of 24.1x. Its peers sat far below: Westpac at 16.7x, ANZ at 19.1x, and NAB at 19.7x.
| Bank | Trailing P/E | Forward P/E | P/B Ratio |
|---|---|---|---|
| CBA | 24.9x | 24.1x | ~2.8x |
| NAB | 19.7x | 19.0x | ~1.3-1.6x |
| ANZ | 19.1x | 15.1x | ~1.3-1.6x |
| Westpac | 16.7x | 17.1x | ~1.3-1.6x |
That is not a marginal difference. Bell Potter has described CBA’s valuation as “disconnected from fundamentals,” with its P/E running roughly 40% above the peer average.
The price-to-book lens adds a second layer of concern
For banks specifically, the price-to-book (P/B) ratio carries weight because book value approximates the underlying worth of a bank’s lending assets, roughly what the loan book would be worth if wound down. It is a sanity check on the P/E.
On this measure the premium holds. StockWire X data from May 2026 put CBA’s P/B at around 2.8x, against peers trading between 1.3x and 1.6x. At peak periods the figure has been cited as high as 3.7x.
Price-to-book valuation compresses when bad debts are low and credit conditions are benign, which means a high P/B at the top of a credit cycle can reflect cycle-peak earnings quality rather than durable franchise strength, a distinction the current CBA premium requires investors to interrogate carefully.
Even after the 15% share price pullback, that multiple remains materially elevated. Two independent valuation lenses point the same way, which tells you the premium is structural rather than a quirk of one metric.
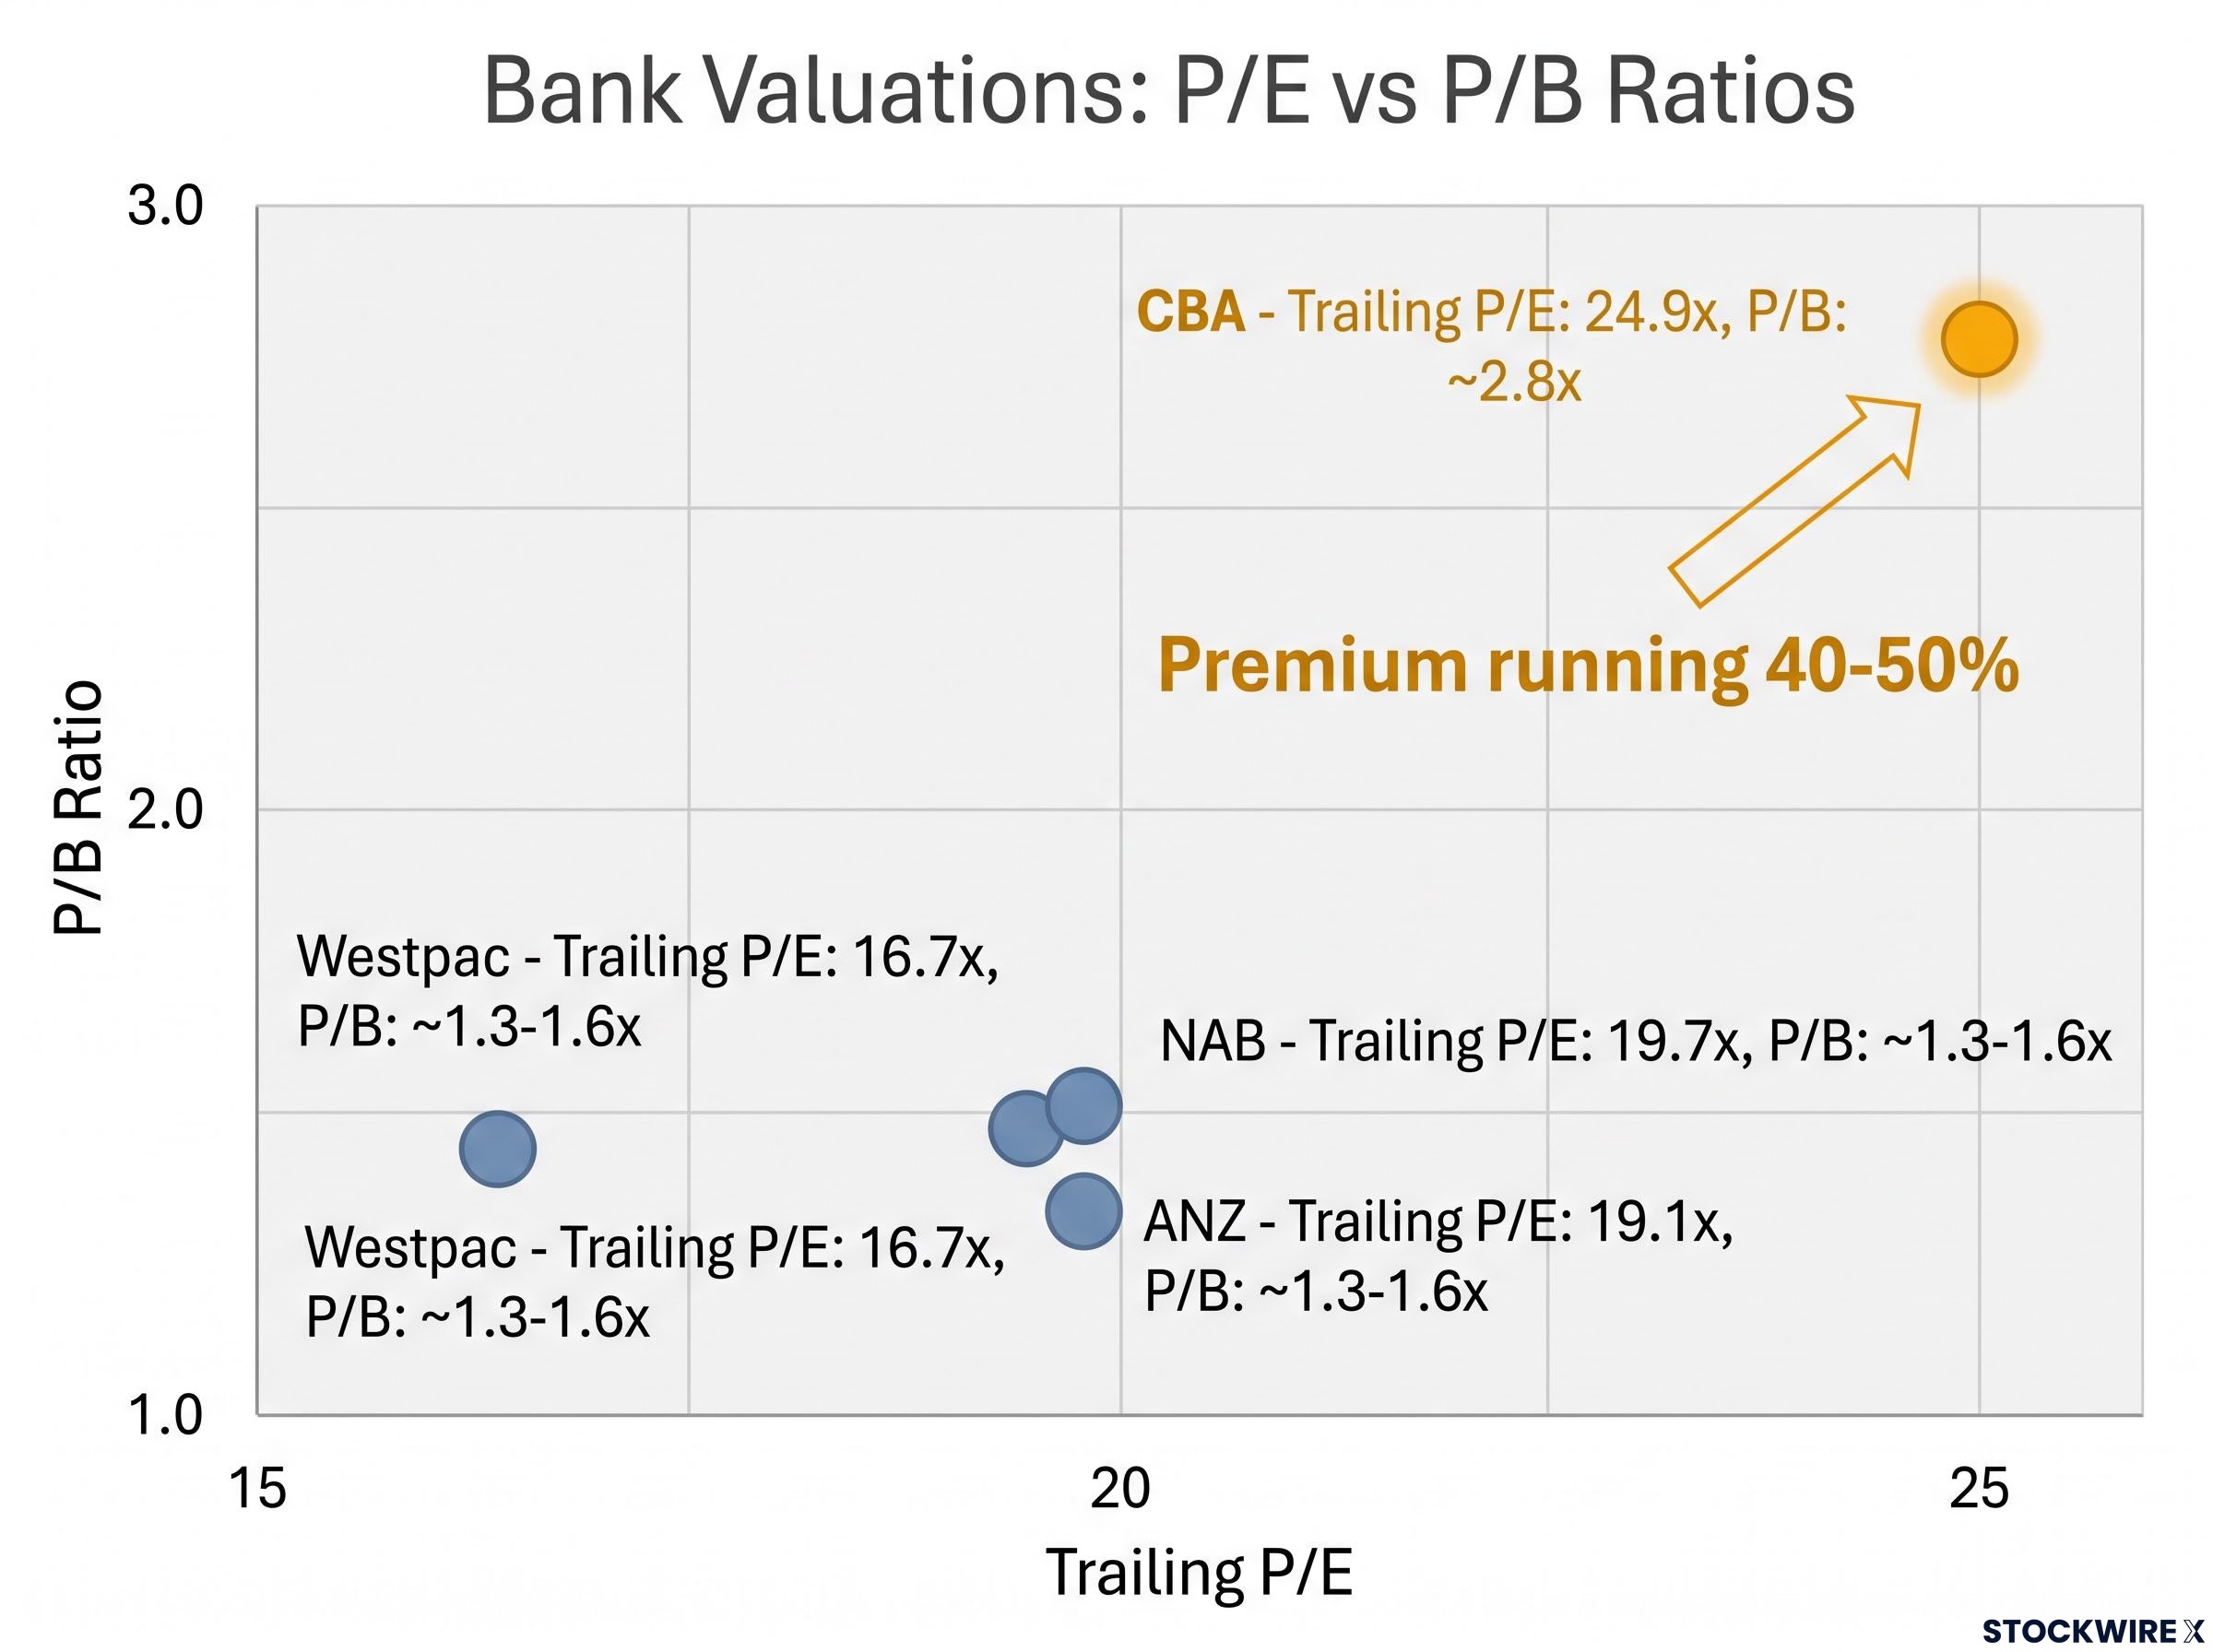
The historical context is what should give an income investor pause. University of Sydney equity research found that since 2009, CBA has typically traded at a 13-14% P/E premium to peers. Today the implied premium is running closer to 40-50%, with Livewire’s John Lockton putting the P/B premium near 70%. Paying today’s price means paying for near-perfect earnings delivery over a long horizon, a premium roughly three times its historical size.
What analysts are actually saying, and why the consensus is unusually one-sided
The market’s institutional read on CBA is not divided. It is close to unanimous.
14 analysts. 0 buys. 0 holds. 14 sells. Average target: $125.21.
Investing.com’s consensus, as of 17-18 September 2026, records a “strong sell” from all 14 covering analysts, with an average 12-month price target of roughly $125.21. That implies around 18% downside from $152.75. This is not a fresh development either; FNArena noted every broker it tracked held a sell-equivalent rating as far back as November 2025.
The named voices behind the numbers are credible institutional teams, not fringe bears:
- Andrew Lyons (Jefferies): sell, $144.99 target
- John Storey (UBS): sell, $135.00 target
- Richard Wiles (Morgan Stanley): sell, $124.00 target
- Matthew Wilson (Jarden): sell, $90.00 target
Locally, James Bills at Shaw and Partners has also issued a sell. On results day, 11 August 2026, MPC Markets noted that all six of its covering brokers rated CBA a sell against a consensus target of $123.69, implying about 29% downside from the then-current $173.92.
Here is the part that matters most. The sell consensus is not a verdict on CBA’s business quality. The bank grew at or above system across all five core products, held its net interest margin effectively stable at 2.04-2.05%, and kept its loan-loss rate around 8 basis points. Analysts agree it is an excellent bank.
What they are debating is price. A 14-from-14 sell reading is a rare signal in Australian equity research, and it tells you institutional teams have concluded that the price being paid for that quality today leaves no room for a positive return. For an income investor, the question sharpens: is a 3.3% yield adequate compensation if the consensus target is even directionally right?
The franchise argument, and why bulls are not wrong, just early
The bull case deserves a fair hearing, because it rests on real numbers rather than sentiment.
CBA’s supporters point to genuine franchise strength:
- Sector-leading return on equity and around 30% retail banking market share
- Net interest margin held at 2.04-2.05% while peers face margin pressure
- Business lending growing at 1.3x system
- A five-year pre-provision profit CAGR of roughly 5.2%, ahead of the peer average
- A loan-loss rate near 8 basis points, a strong buffer against downturns
None of that is in dispute, and history supports rewarding it. The University of Sydney research confirms CBA has earned a premium since 2009, roughly 13-14% on P/E and 39% on P/B. A quality franchise should command more than an average one.
The problem is not the premium. It is the size of it today.
The current premium is running at multiples of that historical baseline. That is the timing flaw in the bull case: the metrics justifying a premium are real, but the price already reflects all of them and then some. For the thesis to pay off from here, earnings growth has to run close to flawlessly for years just to justify the multiple, before adding any return on top.
What mortgage margin compression adds to the risk picture
Federal housing supply and affordability initiatives are expected to intensify competition specifically in mortgage lending, the very market CBA leans on most heavily. More competition there typically squeezes lending margins.
Mortgage margin compression is not a hypothetical risk for CBA: Morgan Stanley’s post-downgrade preference order ranked CBA last among the Big Four precisely because its dominant mortgage market share creates the greatest differential exposure to a housing cycle downturn among its peers.
CBA’s skew toward consumer banking, relative to peers with deeper business banking operations, makes it structurally more exposed to that pressure. If you already hold the stock, the case for holding rests on a long horizon and a tolerance for multiple compression, not on near-term income or capital return.
The RBA financial conditions analysis from February 2026 confirms that competition between lenders has been compressing spreads on variable-rate mortgage loans, a dynamic that bears directly on CBA’s ability to hold its net interest margin near the 2.04-2.05% level that underpins its premium valuation.
Passive income or total return? How to frame the decision at current prices
The evidence points to a genuine choice rather than an obvious winner, so it is worth laying out as a trade-off.
On one side, CBA offers a lower cash yield of 3.3% and a grossed-up yield of roughly 4.0-4.1%, backed by a stronger franchise, lower credit risk, and a long record of dividend reliability. On the other, NAB and ANZ at 4.4% and Westpac at 4.5% deliver more immediate income, with Westpac’s fully franked payout grossing up to around 5.7% on an FY2025 basis.
CBA’s grossed-up yield sits at approximately 4.0-4.1% versus Westpac’s approximately 5.7% on an FY2025 franking-adjusted basis.
The obvious move looks like switching for yield. But that carries a caveat worth stating plainly: NAB and ANZ also sit under widespread sell ratings. Moving capital purely for income does not remove analyst-flagged downside risk, it relocates it. And ANZ’s partial franking means its headline advantage shrinks after tax.
The variables that should actually drive your decision are personal:
- Time horizon: a long runway can absorb multiple compression that a short one cannot
- Accumulation versus drawdown phase: whether you need income now or are still building
- Superannuation structure: an SMSF or low-tax environment maximises franking credit value, changing the after-tax ranking
- Capital loss tolerance: with CBA’s consensus target around $125.21, comfortably below the current price, the downside scenario is specific, not hypothetical
SMSF pension phase accounts taxed at 0% convert every franking credit attached to a fully franked dividend into a direct ATO cash refund, a structural advantage that widens the after-tax income gap between fully franked payers like CBA and Westpac versus ANZ’s partially franked distributions.
For long-term CBA holders, the Dividend Reinvestment Plan (DRP) remains a compounding tool. The decision is not CBA versus peers in isolation. It is CBA’s lower income and lower perceived capital risk against peers’ higher income and similarly cautious ratings, with your tax position and time horizon as the tie-breakers.
What the yield gap is actually telling you about the current price
The yield gap is not an anomaly to explain away. It is the market’s live signal about how much premium the crowd is still prepared to pay for CBA, and reading it correctly matters more than resolving it.
The logic is a single thread. The low yield is the output of a high valuation. That valuation is running at multiples of its historically justified level. And the analyst consensus implies it has further to compress than to expand from here.
Three things could shift that picture:
- A sharper share price correction that lifts the cash yield toward 4%, which would require a fall to roughly $126 on the current $5.05 dividend, close to the $125.21 consensus target
- A peer re-rating that narrows the premium from the other side
- Earnings growth that outpaces consensus enough to start justifying the multiple
The clearest early indicator to watch is CBA’s net interest margin across the next two reporting periods. If it holds near 2.04-2.05% under mounting mortgage competition, the premium franchise thesis is intact. If it slips, the case for the premium weakens quickly.
Until the price falls enough to make the yield genuinely competitive, or earnings accelerate enough to justify the multiple, the yield gap is the market telling income investors they are paying a franchise premium the dividend alone cannot yet repay. Knowing which of those conditions you are waiting for lets you set a review trigger rather than freezing on a static hold-or-sell call today.
This article is for informational purposes only and should not be considered financial advice. Investors should conduct their own research and consult with financial professionals before making investment decisions. Past performance does not guarantee future results, and financial projections are subject to market conditions and various risk factors.