
The Memo That Halved Meta’s AI Infrastructure Cost Estimate
6 hrs ago

CAR Group’s share price has shed roughly 20% since the start of 2025, even as the company posted revenue of $1.184 billion and net profit of $275 million in FY25. That divergence sits at the centre of a question Australian retail investors are asking right now: has the market corrected a stock that was priced for perfection, or has it overshot and created a genuine entry point? The answer depends on whether the operating fundamentals justify a premium multiple, whether four international markets are delivering or merely promising, and whether a forward price-to-earnings (P/E) ratio in the high twenties represents value or just a smaller version of expensive. What follows is a structured walk through the verified financial data, the valuation mechanics, and the competing arguments that frame the decision.
CAR Group began as an Australian online car classifieds platform in the 1990s. It has since evolved into a multi-geography digital marketplace connecting buyers, sellers, and dealers through technology-led advertising tools. The company does not transact directly; it sells visibility, data products, and premium listing features to dealers and private sellers, generating revenue from advertising rather than from vehicle sales themselves.
That model creates structural advantages. Margins are high because each additional listing carries near-zero marginal cost. Network effects deepen with scale: more listings attract more buyers, which attract more dealers, which attract more listings.
The business now operates across four international markets:
Revenue grew from $1,099 million in FY24 to $1,184 million in FY25, confirming the scale of a business that has moved well beyond its domestic classifieds origins.
The share price premium CAR Group commanded before 2025 was not arbitrary. It was earned across a growth trajectory that compounded at an average annual revenue growth rate of 37% between 2021 and FY24, driven by a combination of organic expansion and acquisitions.
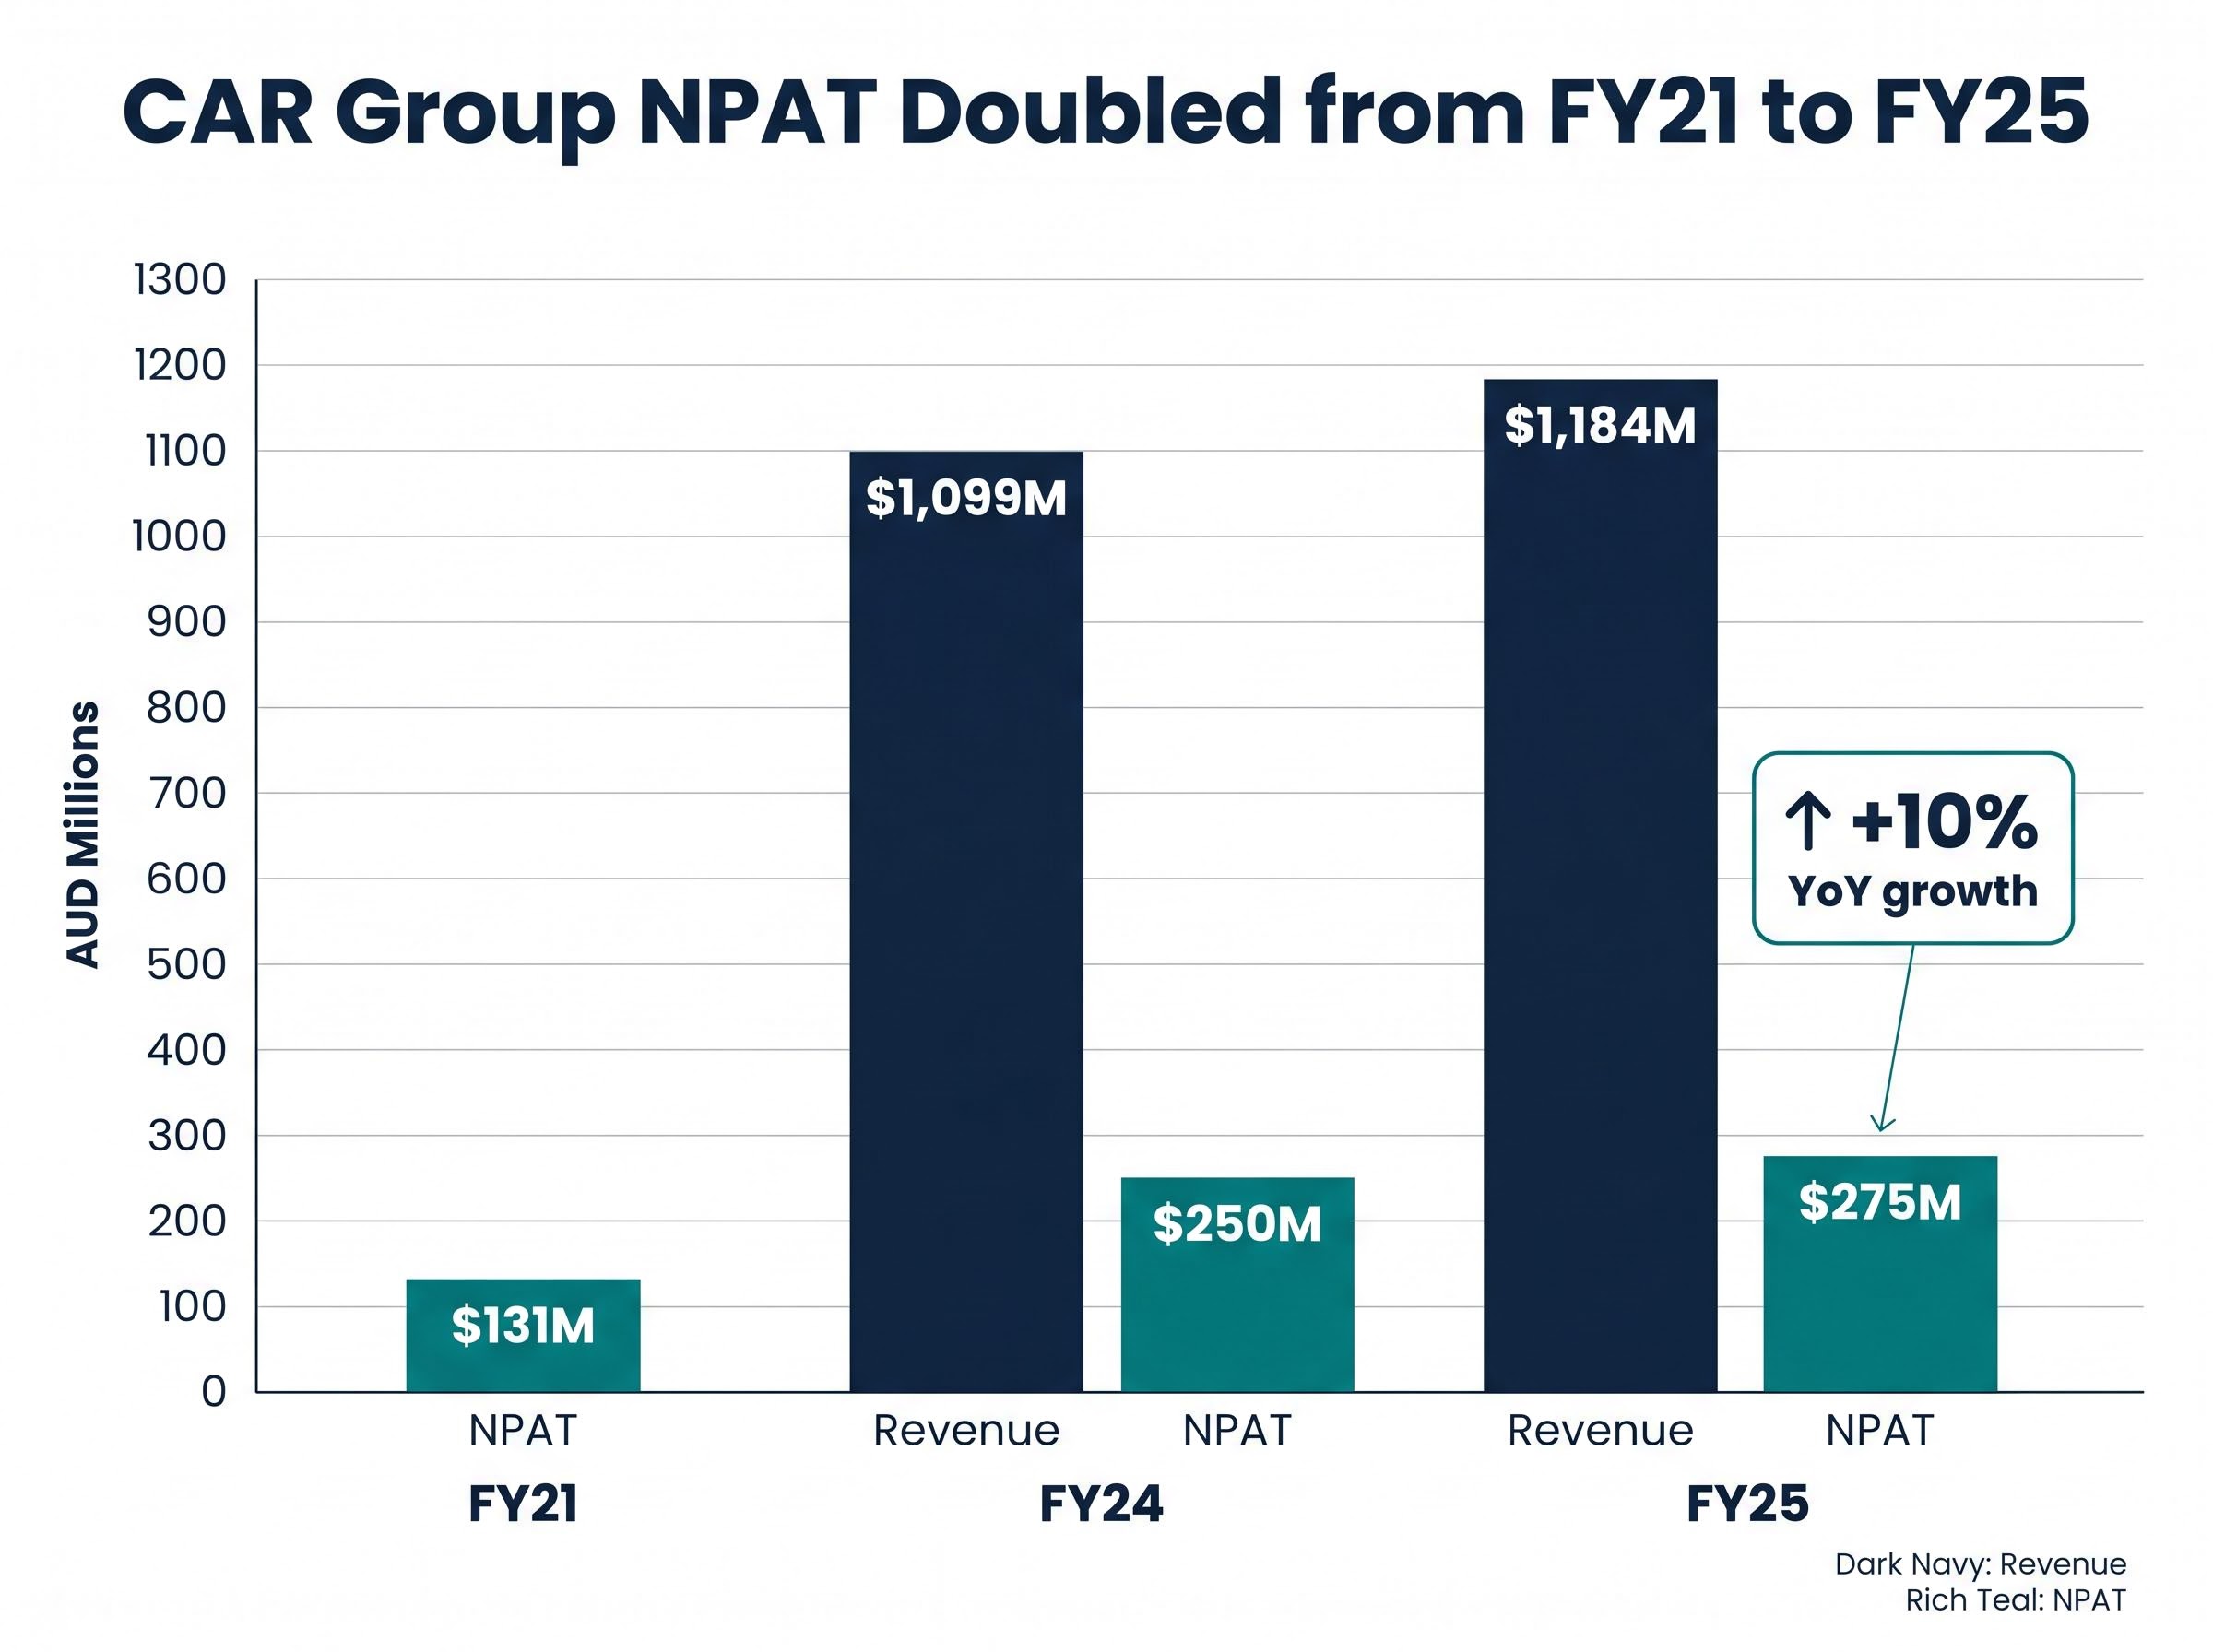
That pace has moderated. FY25 revenue of $1,184 million represented 8% year-on-year growth, a step down from the acquisition-fuelled surges of prior years but still positive in absolute terms. The more instructive metric is profitability. Net profit after tax (NPAT) rose from $131 million in 2021 to $275 million in FY25, a figure verified via the ASX release of 11 August 2025.
CAR Group’s NPAT more than doubled in five years, from $131 million in 2021 to $275 million in FY25, representing one of the more consistent earnings compounding records among ASX-listed platform businesses.
The question mark sits with return on equity (ROE), which stood at 8.6% in the most recently reported period. For a mature blue-chip, an ROE below 10% would invite concern. For a growth platform that has made goodwill-heavy acquisitions, the metric requires different interpretation, a point addressed in detail below.
| Year | Revenue | NPAT | NPAT YoY Growth |
|---|---|---|---|
| FY21 | — | $131M | — |
| FY24 | $1,099M | $250M | — |
| FY25 | $1,184M | $275M | +10% |
The pattern is clear: revenue growth has normalised from acquisition-era peaks, but profit compounding has remained steady. Investors need to decide whether that trajectory signals durable competitive advantage or a business entering a more mature phase of its earnings cycle.
The international portfolio is where CAR Group stops being a domestic classifieds stock and starts being a global marketplace operator. Each geography represents a different stage of the same monetisation playbook: acquire a leading or near-leading marketplace position in a market with low online advertising penetration, then apply Australian-developed product depth and pricing discipline to lift yield.
Encar in South Korea is the most mature international asset. Coverage of the HY25 results described the business as delivering high-teens revenue growth in local currency, with expanding margins and strong brand recognition. It serves as a template for what CAR’s international strategy looks like when execution is complete.
Trader Interactive in the United States covers commercial and recreational vehicle verticals, including RVs, powersports, and trucks. It has been described as growing faster than the core Australian business, benefiting from US dealers shifting away from legacy print advertising toward integrated digital platforms. Management has targeted margin expansion through product depth and data-rich listings.
Webmotors in Brazil represents the highest growth runway but also the most concentrated risk. Currency volatility, competitive intensity, and broader macroeconomic conditions are material variables. CAR has been investing heavily in technology and product enhancements to gain scale.
Chileautos remains small relative to the group and is best understood as a low-cost optionality position rather than a material earnings driver.
| Market | Brand | Maturity Stage | Key Risk |
|---|---|---|---|
| South Korea | Encar | Mature, proven | Currency, competition |
| United States | Trader Interactive | Scaling | Execution on margin expansion |
| Brazil | Webmotors | Early growth | Currency volatility, macro risk |
| Chile | Chileautos | Small, optionality | Scale constraints |
The international operations are simultaneously CAR’s most compelling valuation argument and its most significant risk concentration. Encar and Trader Interactive are closer to proven; Webmotors requires a longer-duration thesis and a higher tolerance for volatility.
Before interrogating CAR’s valuation multiples, it is worth understanding why marketplace businesses attract premium earnings multiples in the first place. The financial signature of a well-run online marketplace differs from an asset-heavy industrial or a traditional retailer in three defining ways:
These characteristics justify higher P/E ratios than businesses where growth requires proportional capital expenditure. A marketplace trading at 30 times earnings is not automatically expensive if its earnings are growing at 15% annually with minimal reinvestment needs.
The framework for assessing marketplace valuation multiples recognises that platform businesses with strong network effects, recurring revenue, and low marginal costs routinely command P/E premiums over asset-heavy peers, which is the structural rationale behind CAR Group’s above-market rating even after its 2025 de-rating.
CAR Group’s ROE of 8.6% requires contextual interpretation. When a company makes goodwill-heavy acquisitions, the equity base (the denominator in the ROE calculation) inflates with acquisition premiums. This compresses the ratio even when underlying returns on invested operational capital may be strong. Applying a blue-chip ROE benchmark of 10% or above without adjusting for acquisition-driven goodwill can produce misleading conclusions.
For retail investors accustomed to evaluating banks or miners, this distinction matters. An 8.6% ROE at a marketplace that has acquired four international businesses tells a different story than an 8.6% ROE at a mature domestic utility.
The challenge of valuing growth stocks on ASX is that conventional benchmarks, including trailing P/E ratios and ROE thresholds designed for mature industrials, were built for businesses with stable capital structures rather than platforms that have absorbed large acquisition goodwill and are still scaling internationally.
The verified data points anchor this section. CAR Group shares traded at approximately $25.54-$25.81 as of 20-22 May 2026. FY25 NPAT stood at $275 million, released via ASX on 11 August 2025.
At the current share price, the market capitalisation implies a trailing P/E that investors can calculate using verified shares on issue (a figure that should be confirmed directly from the most recent annual report or ASX filings before acting). Available commentary describes the forward P/E as sitting in the high twenties based on FY26 earnings estimates, though this figure has not been independently verified and should be treated as directionally indicative.
Several brokers hold positive stances on the stock, with price targets clustering above the current level. These figures have not been independently verified and are presented as directionally indicative only:
| Broker | Stance | Price Target* |
|---|---|---|
| Morgan Stanley | Overweight | $32.50 |
| Morgans | Add | $31.00 |
| Macquarie | Outperform | $33.00 |
| Goldman Sachs | Buy | $34.20 |
| Ord Minnett | Accumulate | ~$30.00 |
All broker targets are unverified and directionally indicative only. Investors should confirm current ratings via direct broker publications before relying on these figures.
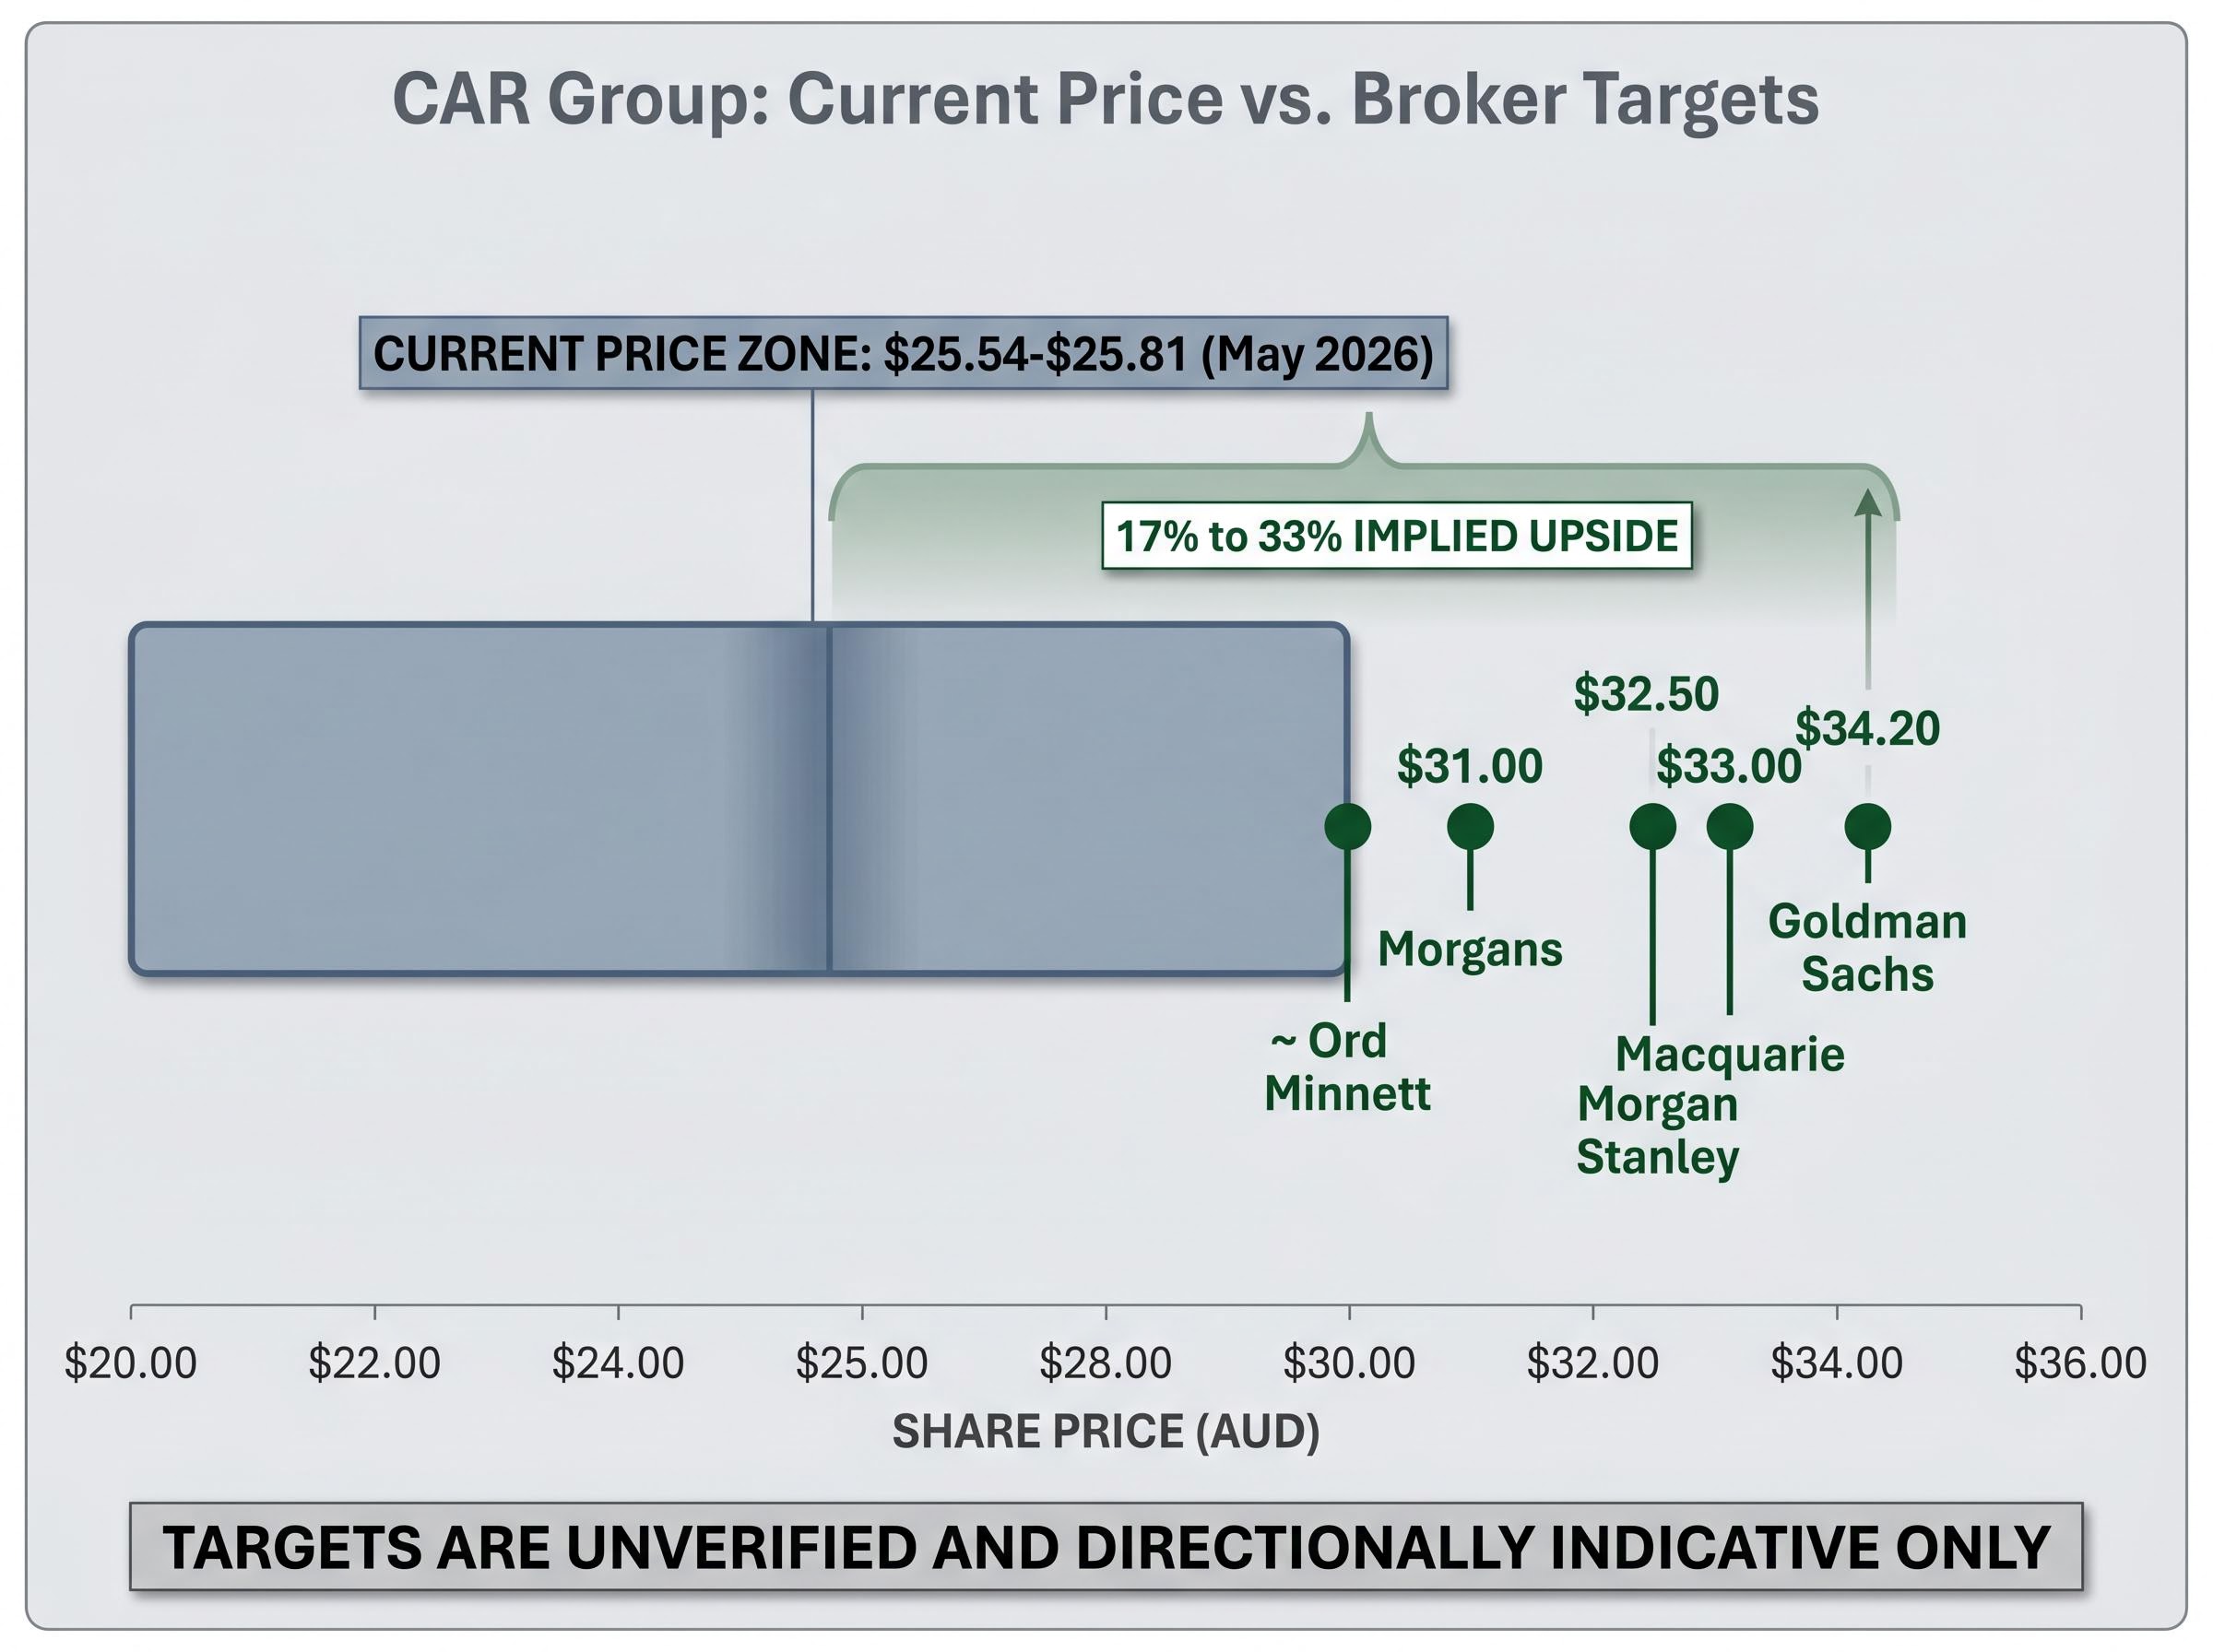
If these unverified targets are directionally accurate, with the cluster sitting between $30 and $34, the implied upside from the current price near $25.70 ranges from approximately 17% to 33%. That gap is wide enough to demand attention but also wide enough to require independent verification.
In global peer context, CAR’s forward P/E has been described as sitting between Auto Trader UK (high twenties to low thirties) and Cars.com (low teens), positioning it as a quality premium over more cyclical competitors but not at the very top of the global auto-classifieds valuation range.
CAR Group’s H1 FY26 earnings result delivered 16% NPAT growth and 13% constant currency revenue growth, with management reaffirming full-year guidance in February 2026, a data point that sharpens the question of whether the share price decline reflects genuine fundamental risk or a sentiment-driven overshoot.
The 20% pull-back has compressed the multiple. Whether it has compressed to fair value or through it depends on which growth assumption an investor chooses to underwrite.
The operating reality has not changed in proportion to the share price movement. Revenue and profit grew in FY25. The international portfolio continued to execute. The platform model’s structural advantages remain intact. What changed is the entry price.
The bull case:
The bear case:
The framing question remains: the 20% decline has changed the entry price but not the operating reality. Investors need to decide which of those two facts matters more to their portfolio right now.
CAR Group is not the only case of ASX growth stocks diverging from fundamentals in the current market cycle; Flight Centre has followed a structurally similar pattern, with its share price falling more than 35% from early 2025 highs even as total transaction value hit a record in H1 FY26, suggesting the de-rating pressure is partly sector-level rather than company-specific.
CAR Group’s operating fundamentals have not deteriorated in proportion to the share price decline. Revenue grew. Profit grew. The international portfolio advanced. “Less expensive than before” and “attractive,” however, are not the same thing, and the distinction matters at a forward P/E that remains above market averages even after the reset.
Investors considering a position should verify FY26 guidance directly from the ASX announcement of 11 August 2025 before acting. Unverified broker targets should be treated as directional, not factual consensus.
Over the next 12 months, three signals will determine whether the current price proves to be an opportunity or a false floor: the trajectory of international revenue contributions (particularly from Trader Interactive and Webmotors), the FY26 NPAT outcome relative to market expectations, and any update to forward guidance that clarifies management’s own view of the growth path ahead.
For investors wanting to see how a similar post-pullback analysis plays out across another ASX platform stock with comparable structural characteristics, our deep-dive into Hub24’s post-pullback numbers examines how funds under administration growth, operating leverage, and broker target dispersion combine to frame whether a de-rated platform has created a genuine entry point or simply reset to fair value.
This article is for informational purposes only and should not be considered financial advice. Investors should conduct their own research and consult with financial professionals before making investment decisions. Past performance does not guarantee future results. Financial projections are subject to market conditions and various risk factors.
CAR Group operates digital marketplaces that connect car buyers, sellers, and dealers across multiple countries, generating revenue from advertising, premium listings, and data products rather than directly selling vehicles.
CAR Group's share price has shed roughly 20% since the start of 2025, despite the company growing revenue to $1.184 billion and net profit to $275 million in FY25, suggesting the decline reflects a valuation re-rating rather than a deterioration in operating fundamentals.
CAR Group's return on equity (ROE) stood at 8.6% in the most recently reported period; this figure appears low by conventional benchmarks, but requires contextual interpretation because goodwill from acquisitions inflates the equity base and compresses the ratio even when underlying operational returns may be stronger.
CAR Group operates in Australia (carsales.com.au), South Korea (Encar), the United States (Trader Interactive), Brazil (Webmotors), and Chile (Chileautos), with each market representing a different stage of the company's digital marketplace monetisation strategy.
Based on available commentary, CAR Group's forward price-to-earnings ratio is described as sitting in the high twenties based on FY26 earnings estimates, positioning it between global peers Auto Trader UK and Cars.com, though investors should verify this figure independently before acting.


