UBS Sets €1,900 ASML Target, €600 Above Next-Highest Analyst
49 mins ago

Commonwealth Bank of Australia trades at roughly 3.5x book value and 23x forward earnings. Every other ASX major bank trades at 1.3x to 1.5x book. The question retail investors need answered is not whether CBA is a quality bank but whether that quality gap is already fully priced into the share price at $165.67 as of 23 May 2026. CBA’s 1H FY2026 results, reported in February 2026, confirmed a net interest margin (NIM) of approximately 2.04%, return on equity (ROE) of 13.1%, and a Common Equity Tier 1 (CET1) ratio of 12.3%, all above the sector average. Against this backdrop, comparing CBA’s fundamentals to ANZ, NAB, and Westpac is no longer an academic exercise; it is the central commercial decision facing investors who hold CBA or are considering whether to rotate into cheaper peers. This article benchmarks CBA across the three metrics analysts prioritise when valuing bank stocks, explains what each one actually measures, and confronts the valuation question directly using a dividend discount model (DDM) cross-check.
Three metrics dominate the analytical framework for comparing Australian bank stocks. Understanding them in combination gives retail investors a tool to assess profitability, efficiency, and safety simultaneously.
APRA’s “unquestionably strong” CET1 minimum sits at approximately 10.25-10.5% under the Basel 3+ framework effective 1 January 2025. All four ASX major banks currently exceed this threshold by a comfortable margin.
Read together, these three numbers reveal whether a bank is earning well (NIM), using its capital efficiently (ROE), and carrying enough buffer to absorb shocks (CET1). Every figure in the sections that follow connects back to this framework.
The three-ratio framework at the centre of ASX bank stock analysis, NIM for pricing power, ROE for capital efficiency, and CET1 for regulatory resilience, was designed precisely because no single number captures how a bank is performing across all three dimensions simultaneously.
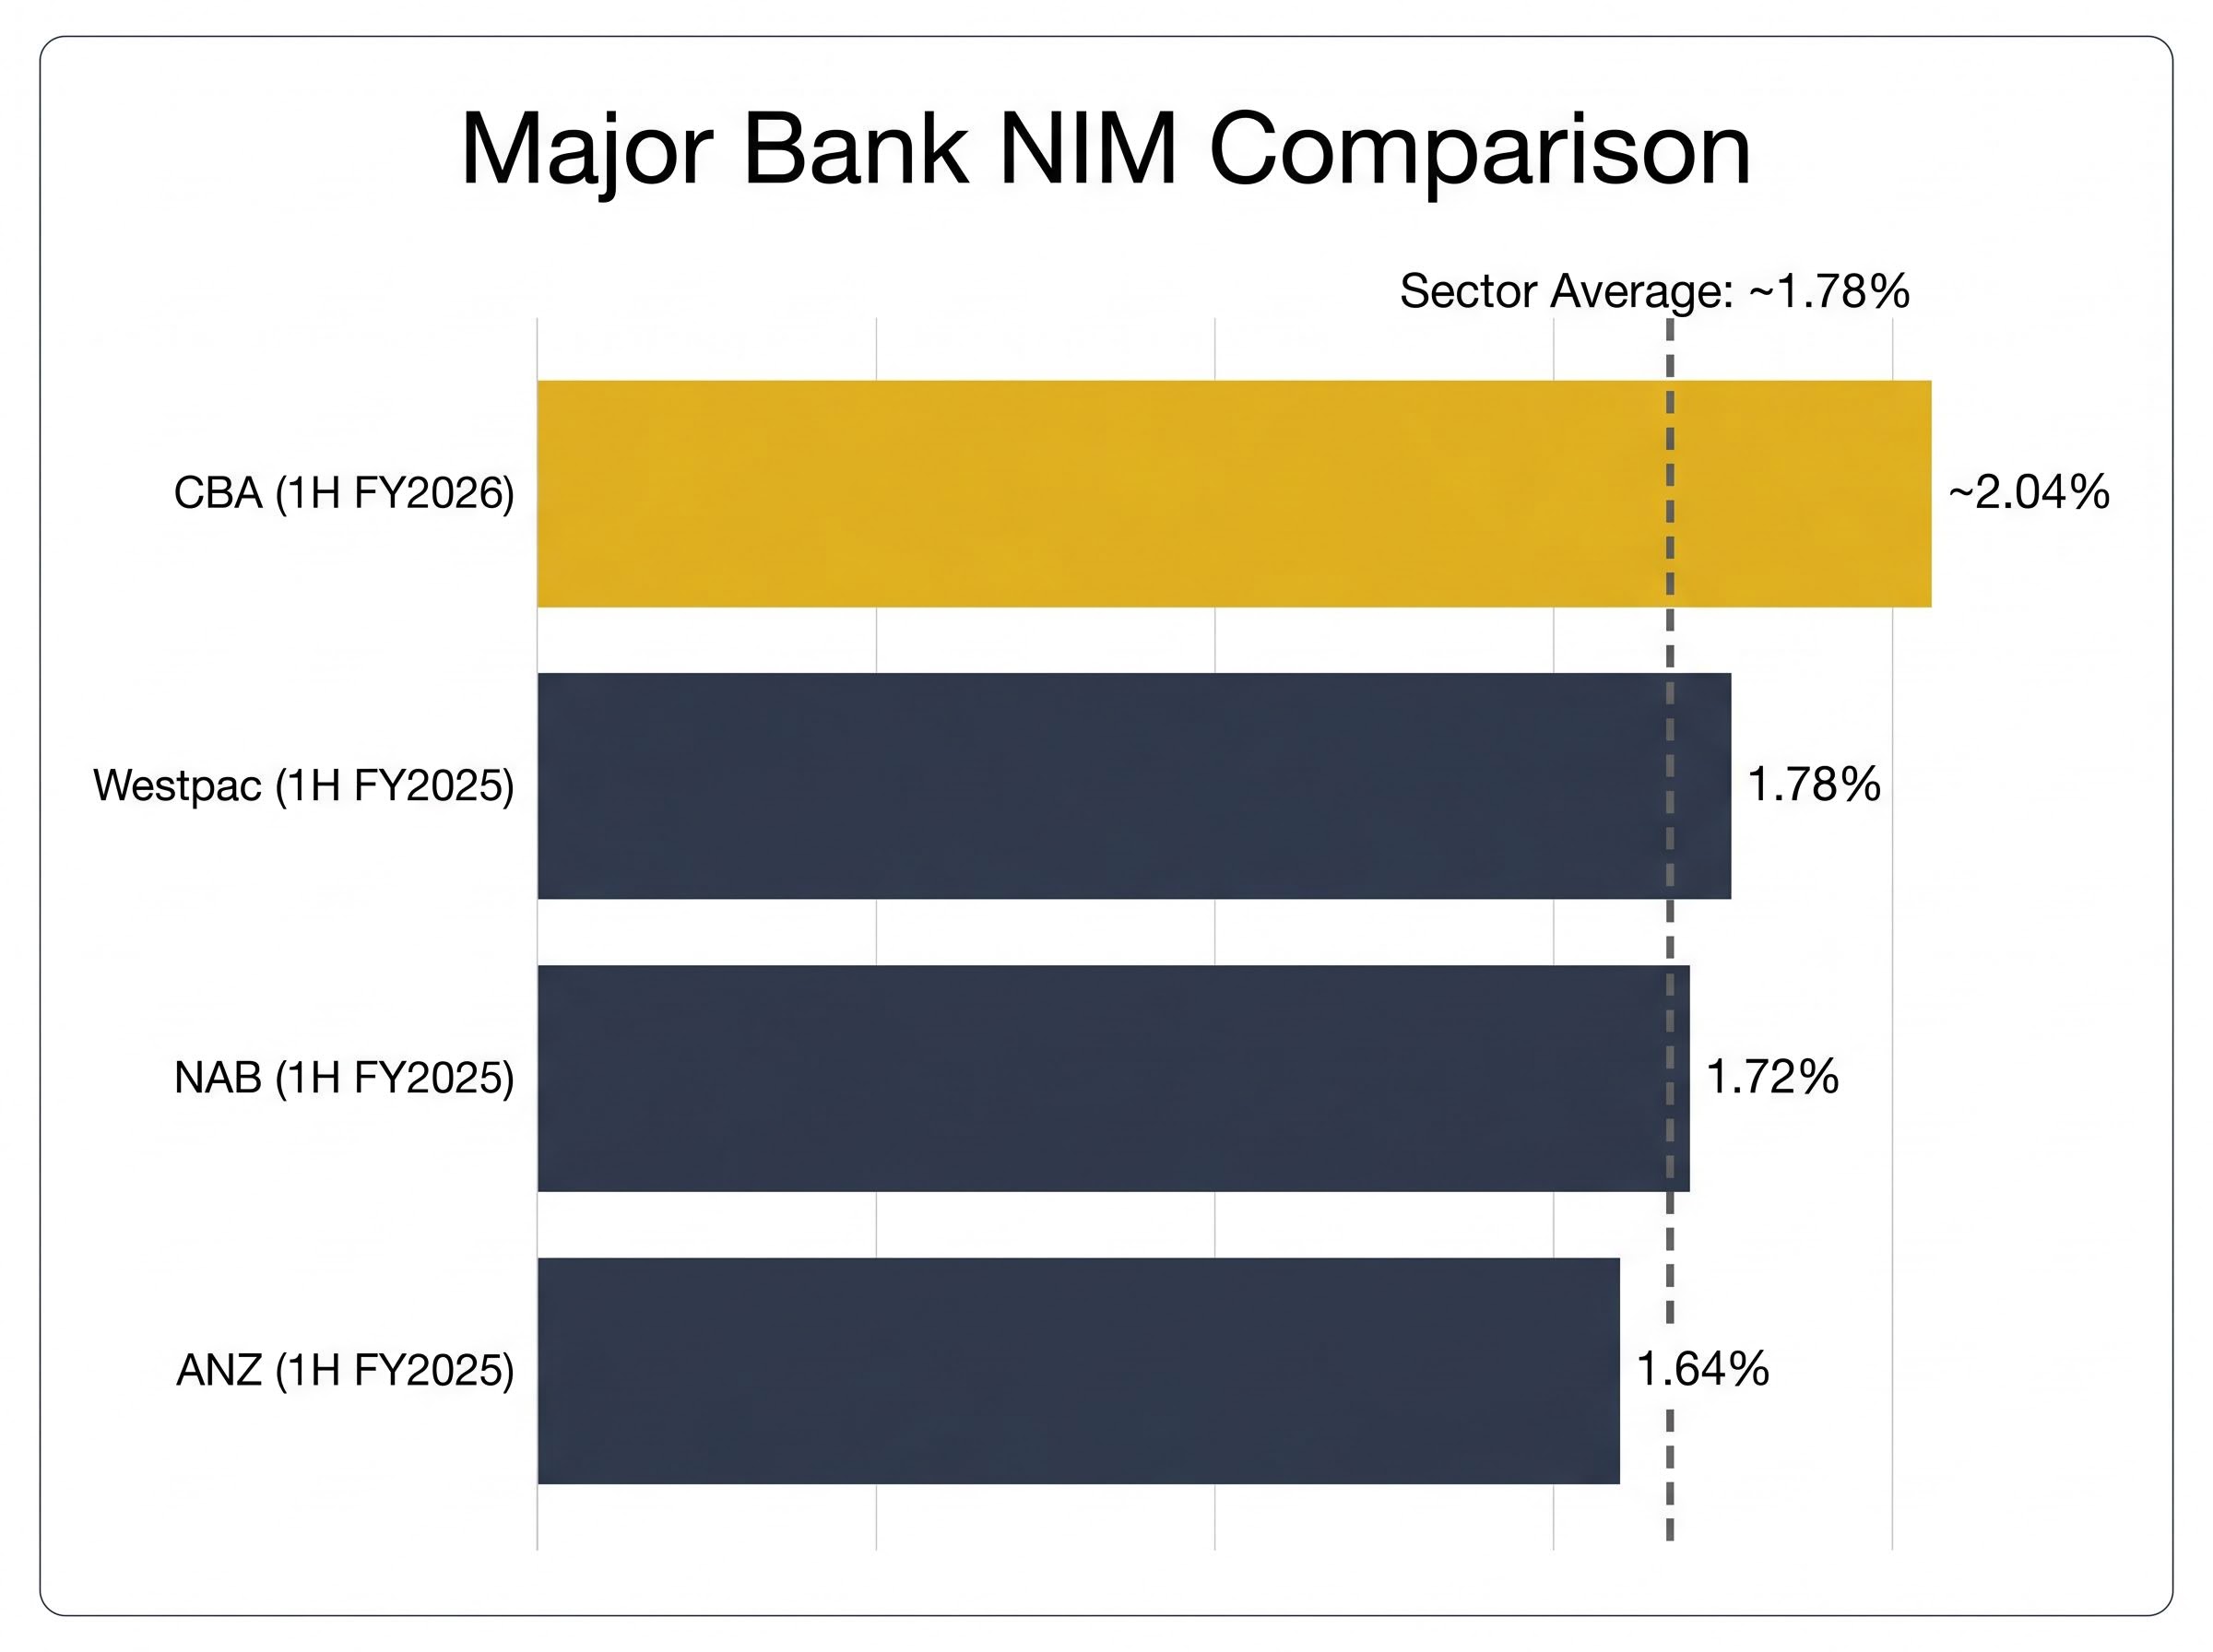
CBA’s NIM of approximately 2.04% (1H FY2026) sits above every major peer. The gap is not marginal.
| Bank | NIM (latest available) | Period | Notes |
|---|---|---|---|
| CBA | ~2.04% | 1H FY2026 | Confirmed current |
| Westpac | 1.78% | 1H FY2025 | FY2025 ~1.94-1.95% reported subsequently |
| NAB | 1.72% | 1H FY2025 | More recent data may exist |
| ANZ | 1.64% | 1H FY2025 | More recent data may exist |
CBA’s 26 basis point advantage over the Rask Invest-calculated sector average of approximately 1.78% reflects a stronger transaction deposit franchise, retail pricing discipline, and lower reliance on costly wholesale funding. Each basis point of NIM advantage translates directly into higher revenue per dollar of loans, which flows through to earnings, dividends, and the valuation multiples the market assigns.
APRA’s quarterly ADI performance statistics, published through March 2026 and covering the December 2025 quarter, provide the sector-level NIM and ROE benchmarks that underpin peer comparisons, offering investors a primary source to verify how individual bank results sit relative to the broader authorised deposit-taking institution population.
APRA’s quarterly ADI performance statistics, published through March 2026 and covering the December 2025 quarter, provide the sector-level NIM and ROE benchmarks that underpin peer comparisons, offering investors a primary source to verify how individual bank results sit relative to the broader authorised deposit-taking institution population.
The advantage is real, but the direction of travel matters. CBA management characterised NIM as having peaked during the February 2025 results and guided to “broadly stable to slightly lower” conditions. All four banks flagged modest compression driven by deposit competition and fixed-rate roll-offs during the 1H FY2025 reporting season.
The renewed RBA hiking cycle, with three 25bp increases pushing the cash rate to 4.35% as of May 2026, introduces a more complex picture. If deposit costs lag behind rate rises, NIMs could stabilise. If competition captures the benefit quickly, compression may continue. J.P. Morgan reportedly forecast incremental NIM compression of 5-10bp across the majors over FY2025-FY2026, while noting CBA was “better insulated than peers” due to its transaction deposit base.
The NIM gap, while real, should not be extrapolated as permanent.
NIM trajectory risk is the one qualitative variable that conventional bank valuation multiples, including price-to-earnings and price-to-book, cannot price with any precision, because the direction of margin movement in a rate cycle depends on deposit competition dynamics that shift faster than annual earnings guidance.
CBA’s ROE: 13.1%. ASX banking sector average: 9.35%. The gap: approximately 375 basis points.
That spread is not a one-year result. It reflects structural franchise characteristics that CBA has compounded over decades.
Three factors drive the ROE advantage:
ROE is the single clearest measure of whether a bank generates adequate returns on the capital shareholders have entrusted to it. A 375bp ROE advantage is material, and analysts consistently cite it as the primary quantitative justification for CBA’s structural valuation premium.
The qualification: UBS reportedly estimated CBA’s 2025 ROE at approximately 13.3% versus peers at 9.5%, characterising the current multiple as pricing in a 3-4 percentage point ROE edge “indefinitely.” Multiple analysts identify that CBA needs to sustain a 300-350bp ROE advantage over the full cycle to justify the premium on numbers alone. Whether that is achievable as competition intensifies is the central debate.
CET1 ratios across the four majors tell a different story from NIM and ROE. Here, the interesting finding is not that one bank leads but that all four sit comfortably above regulatory minimums.
| Bank | CET1 Ratio | Period | vs APRA Minimum (~10.25-10.5%) |
|---|---|---|---|
| ANZ | 13.3% | 1H FY2025 | +~280-305bp surplus |
| Westpac | 12.9% | 1H FY2025 | +~240-265bp surplus |
| NAB | 12.7% | 1H FY2025 | +~220-245bp surplus |
| CBA | 12.3% | 1H FY2026 | +~180-205bp surplus |
CBA at 12.3% is actually the lowest of the four, despite leading on NIM and ROE. This is not a concern. All four banks hold 200-300bp of surplus buffer above APRA’s “unquestionably strong” minimum, and the Basel 3+ framework effective January 2025 represents a stable operating environment with no near-term step-changes flagged.
Capital adequacy is not currently a differentiator among the majors. The more productive investment question is what each bank does with its surplus capital:
Peer CET1 figures are from 1H FY2025 filings and may have been updated in subsequent reporting periods.
CBA’s capital position has evolved since the 1H FY2026 figures cited here, with the Q3 FY2026 Pillar 3 disclosure reporting a CET1 ratio of 11.6% as risk-weighted assets expanded 2.4% to $517.5 billion, a movement worth tracking for investors monitoring whether surplus capital supports further buybacks or dividend growth.
CBA’s current multiples tell a specific story. Trailing price-to-earnings sits at approximately 26x, forward P/E at approximately 23x, and price-to-book at approximately 3.5x. Peers trade at approximately 1.3-1.5x book. On a price-to-tangible book basis, Macquarie reportedly described this as a roughly 60% premium to the sector, characterising it as “stretch” while accepting a structural premium is warranted.
The ROE and NIM gap justifies a premium in direction. The question is magnitude.
Analyst commentary has characterised CBA as “priced for near-perfection” with limited margin of safety for retail investors.
Morgan Stanley reportedly held an Underweight rating on CBA while overweighting selected peers. UBS reportedly rated CBA Neutral, preferring NAB and Westpac on valuation grounds. Macquarie reportedly expressed caution on further upside, preferring discounted majors for risk-reward.
A dividend discount model offers a simplified but instructive cross-check. Using CBA’s most recently declared full-year dividend of $4.65 per share, dividend growth assumptions of 2-4% annually, and risk discount rates of 6-11%, the Rask Invest DDM analysis produced three scenario outputs:
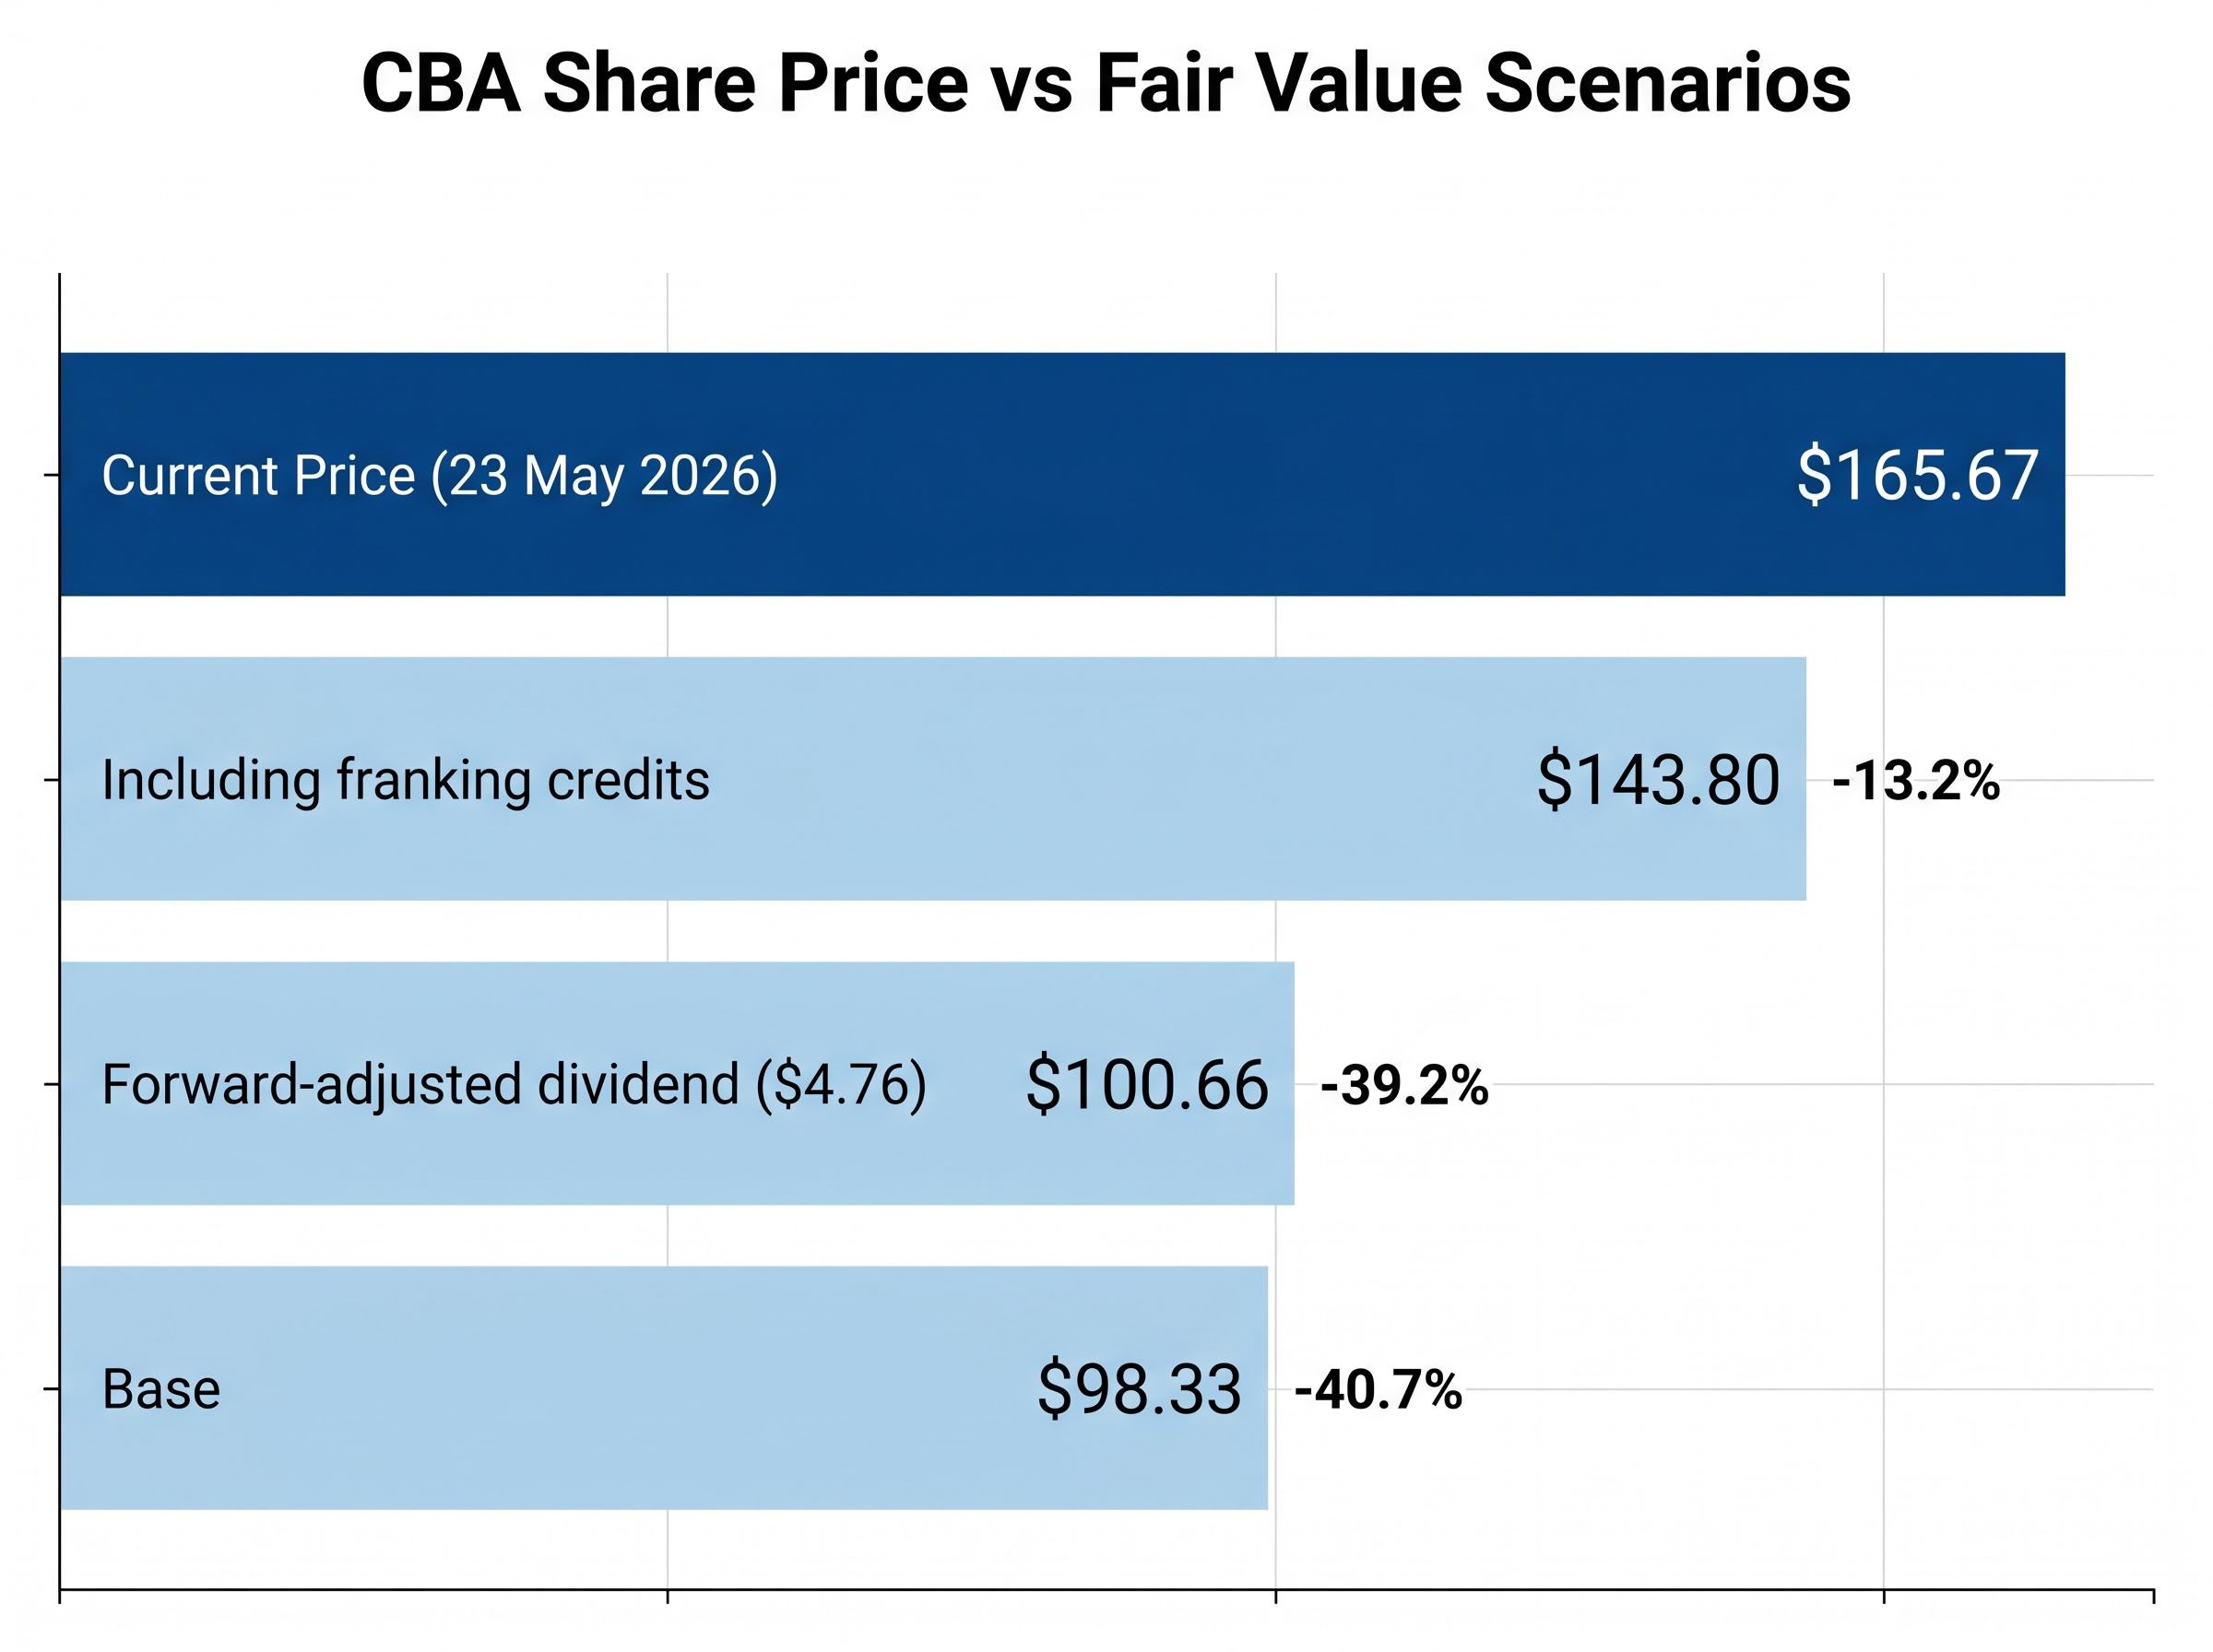
| DDM Scenario | Estimated Fair Value | vs Current Price ($165.67) |
|---|---|---|
| Base (current dividend) | $98.33 | -40.7% |
| Forward-adjusted dividend ($4.76) | $100.66 | -39.2% |
| Including franking credits | $143.80 | -13.2% |
The franking-adjusted estimate of $143.80 is the most favourable interpretation available, and it still sits approximately 13% below the current share price of $165.67. The base case produces an estimate 41% below.
DDM is a simplified tool and one input, not a trading trigger. Rask Invest’s own analysis notes it should form one component of a broader evaluation process. What the DDM signals here is consistent with the broader analyst view: every conventional valuation methodology produces a value below the current share price, which does not make CBA a sell but does calibrate the risk of paying this premium.
The metrics confirm the franchise quality. CBA leads on NIM (approximately 2.04% versus sector approximately 1.78%), leads on ROE (13.1% versus sector 9.35%), and maintains adequate capital at 12.3% CET1, even if it sits lowest among the four majors. A supplementary qualitative signal aligns with the thesis: CBA’s employee culture score of 3.4 out of 5 on the Seek platform (as of May 2026) exceeds the ASX banking sector average of 3.1.
The structural franchise factors supporting the premium direction:
The risk factors that could challenge the current premium:
At $165.67, CBA’s dividend yield is lower than peers despite higher absolute dividends per share ($4.65 full-year), making the income case weaker than the capital appreciation case. The premium is directionally justified but quantitatively stretched, and the margin of safety at current prices is thin by most conventional measures.
Investors weighing CBA against its peers will find the quality case compelling and the valuation case uncomfortable at the same time. Both are accurate readings of the data. Which one matters more depends on investment horizon and risk tolerance.
For investors wanting to apply a structured checklist before acting on these numbers, our comprehensive walkthrough of Australian bank stock qualitative assessment covers the five factors, income structure, property exposure, unemployment trajectory, management discipline, and arrears trends, with current 2026 data points for each of the four majors.
This article is for informational purposes only and should not be considered financial advice. Investors should conduct their own research and consult with financial professionals before making investment decisions. Past performance does not guarantee future results. Financial projections are subject to market conditions and various risk factors.
As of May 2026, CBA trades at approximately 3.5x book value, while ANZ, NAB, and Westpac trade at 1.3x to 1.5x book, representing a significant structural premium that analysts attribute to CBA's superior NIM and ROE metrics.
Net interest margin (NIM) is the spread between what a bank earns on loans and what it pays depositors and wholesale lenders, expressed as a percentage of interest-earning assets; a higher NIM signals stronger pricing power and greater earnings capacity per dollar of loans.
CBA reported an ROE of 13.1% for 1H FY2026, compared to an ASX banking sector average of approximately 9.35%, a gap of around 375 basis points that analysts cite as the primary quantitative justification for CBA's valuation premium.
A DDM analysis using CBA's $4.65 full-year dividend produces a base case fair value of $98.33, a forward-adjusted estimate of $100.66, and a franking-credit-adjusted estimate of $143.80, all of which sit below the current share price of $165.67.
CBA holds the lowest CET1 ratio among the four majors at 12.3% (1H FY2026), compared to ANZ at 13.3%, Westpac at 12.9%, and NAB at 12.7%, though all four banks sit comfortably above APRA's unquestionably strong minimum of approximately 10.25-10.5%.