Vanguard VIHY Declares First Distribution at 49.49 Cents per Unit
1 hr ago

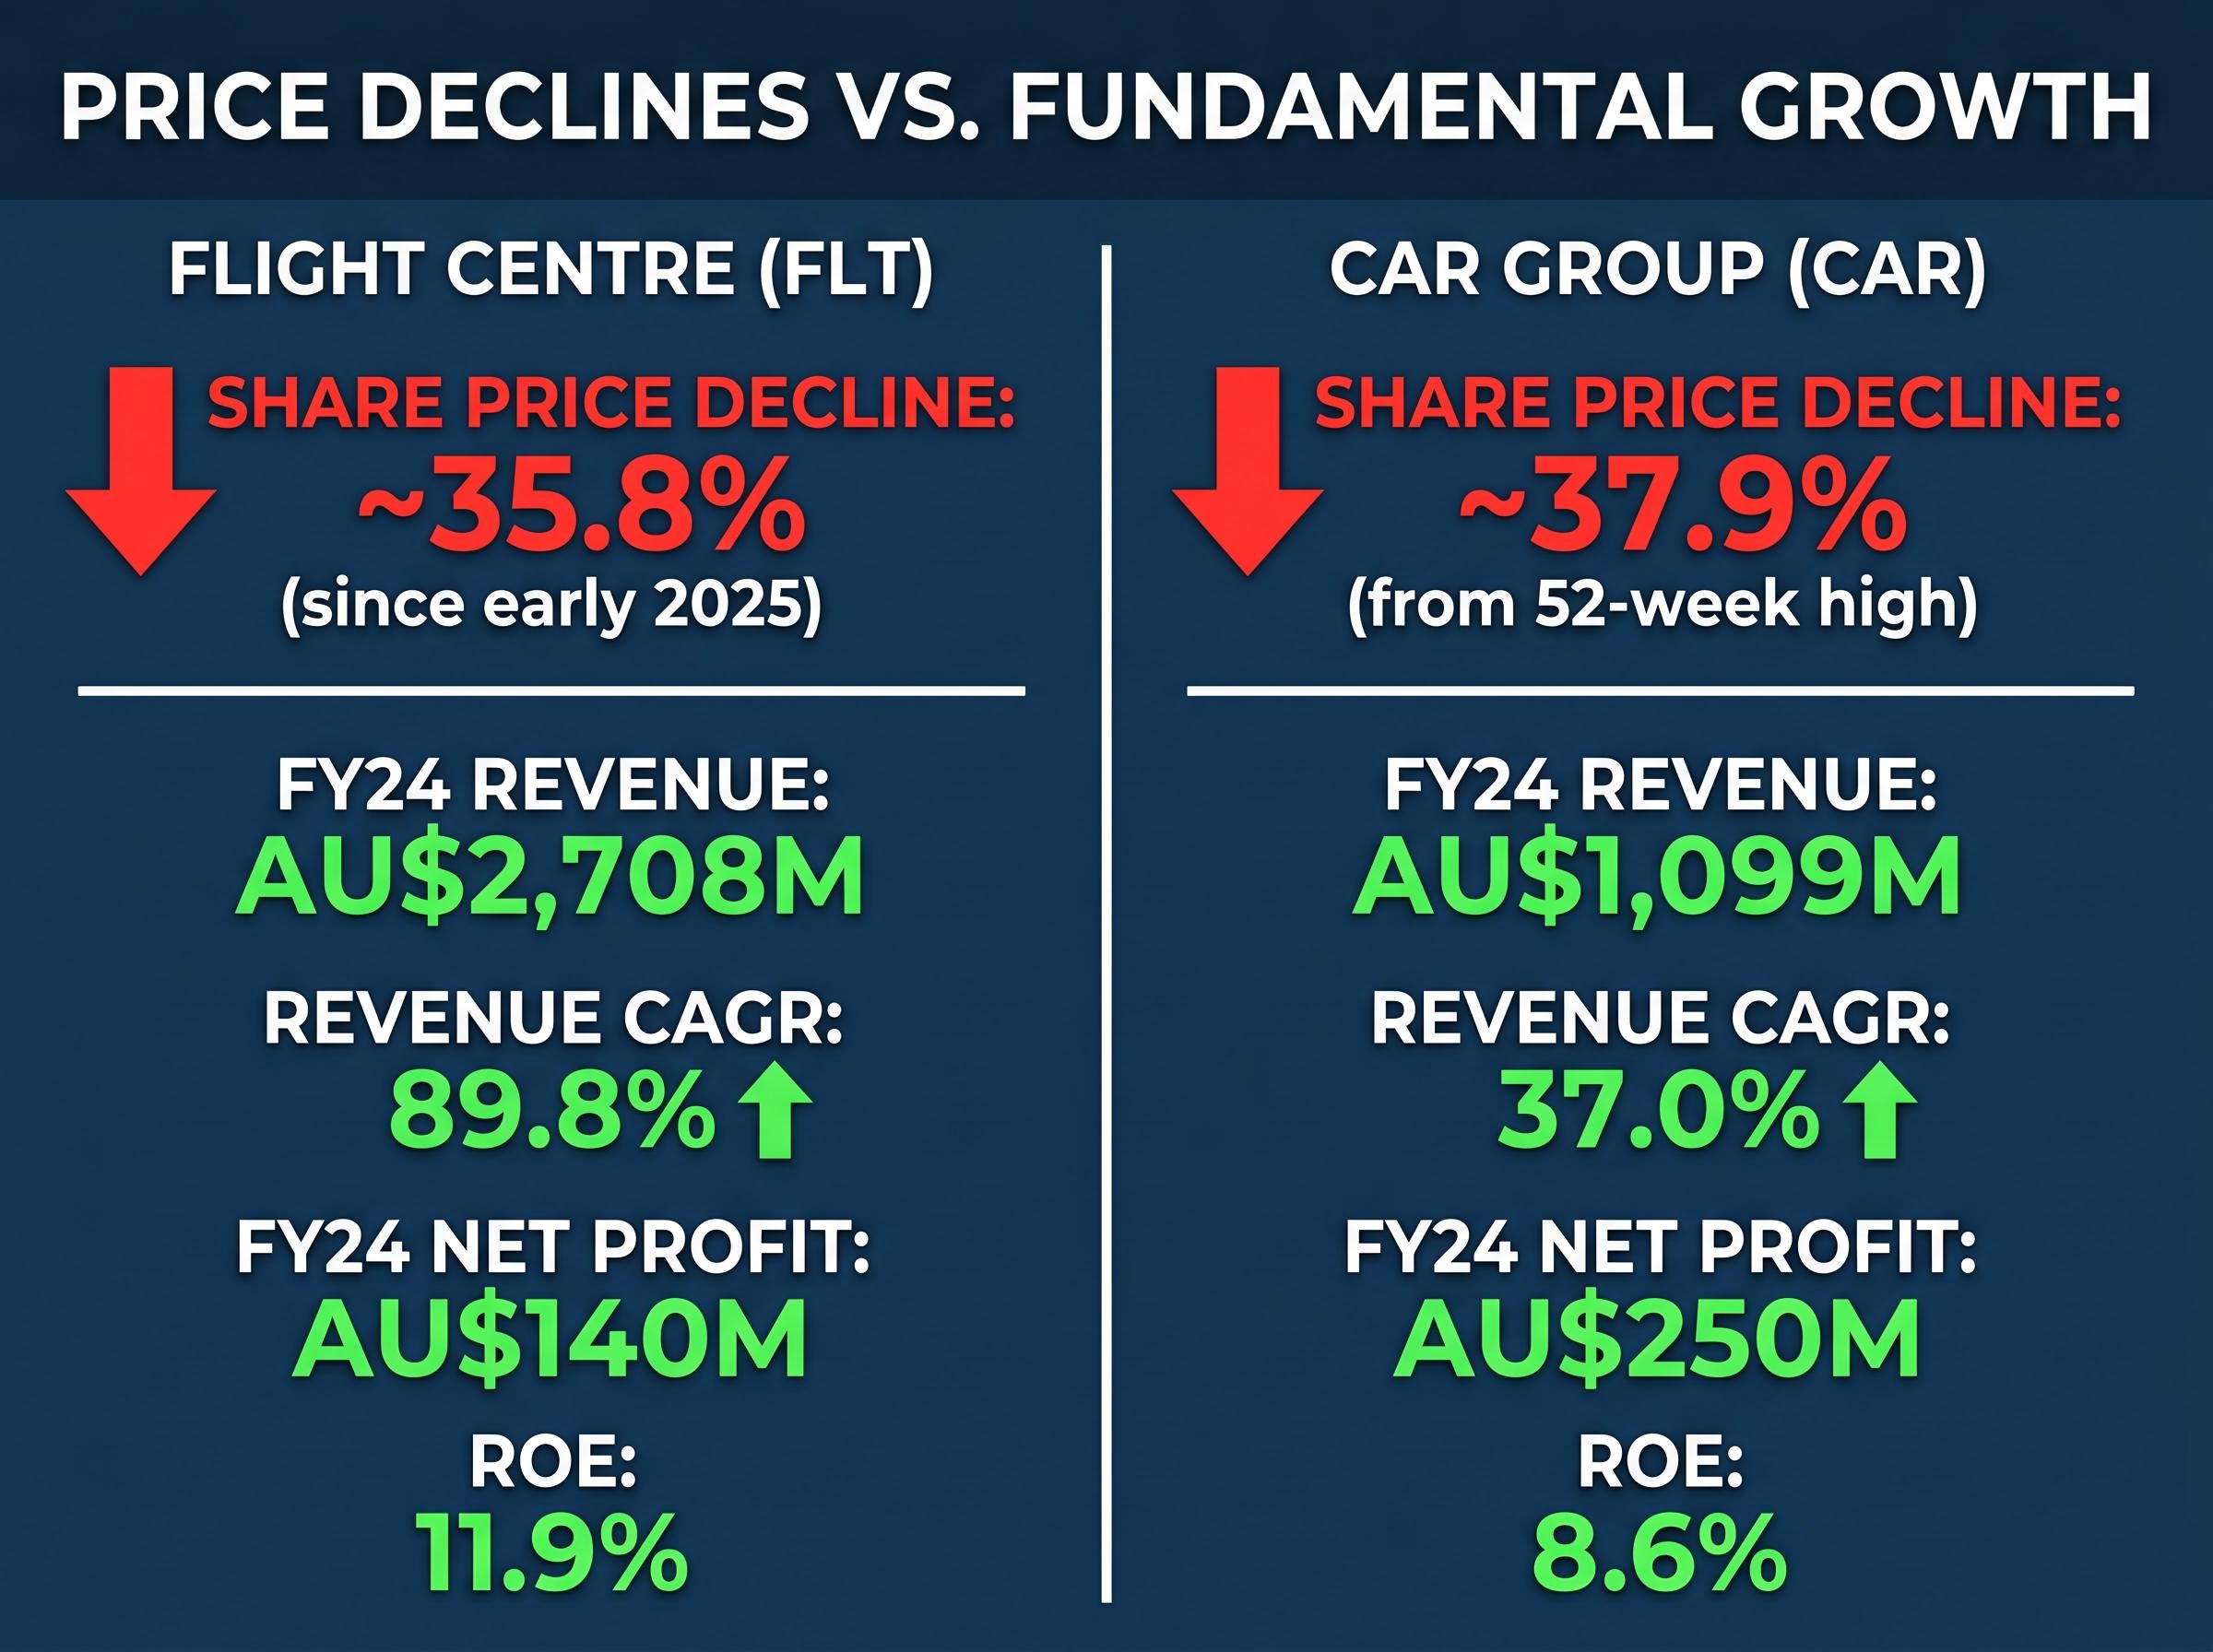
Two recognisable ASX names, one a travel services giant and the other a digital automotive marketplace leader, have each shed more than a third of their value since the start of 2025. Yet their underlying businesses have continued to grow revenue and return to profitability. Flight Centre Travel Group (ASX: FLT) is trading at approximately A$9.98, down roughly 35.8% since early 2025. CAR Group (ASX: CAR) closed at A$26.70 on 19 May 2026, sitting nearly 37.9% below its 52-week high.
For Australian investors, sharp drawdowns in well-known companies prompt a fundamental question: are the numbers telling a different story to the share price? What follows is an examination of what the financial data actually shows for both companies, covering revenue growth rates, profit recovery, and return on equity (ROE), alongside a practical framework for thinking about beaten-down growth stocks on the ASX.
The scale of the declines is worth stating plainly:
“Both stocks have lost more than a third of their value in the past year, yet their most recent financial results tell a markedly different story.”
Sharp falls in growth-oriented stocks do not automatically signal that the business itself has deteriorated. Both companies operate in sectors, travel services and digital automotive marketplaces, that carry cyclical and sentiment-driven valuation risk. When broader market conditions shift, whether through rising interest rates, currency headwinds, or softer consumer confidence, stocks in these sectors can see price moves that overshoot what the underlying earnings trajectory would justify.
That distinction, between price movement and business performance, is the question the rest of this article examines.
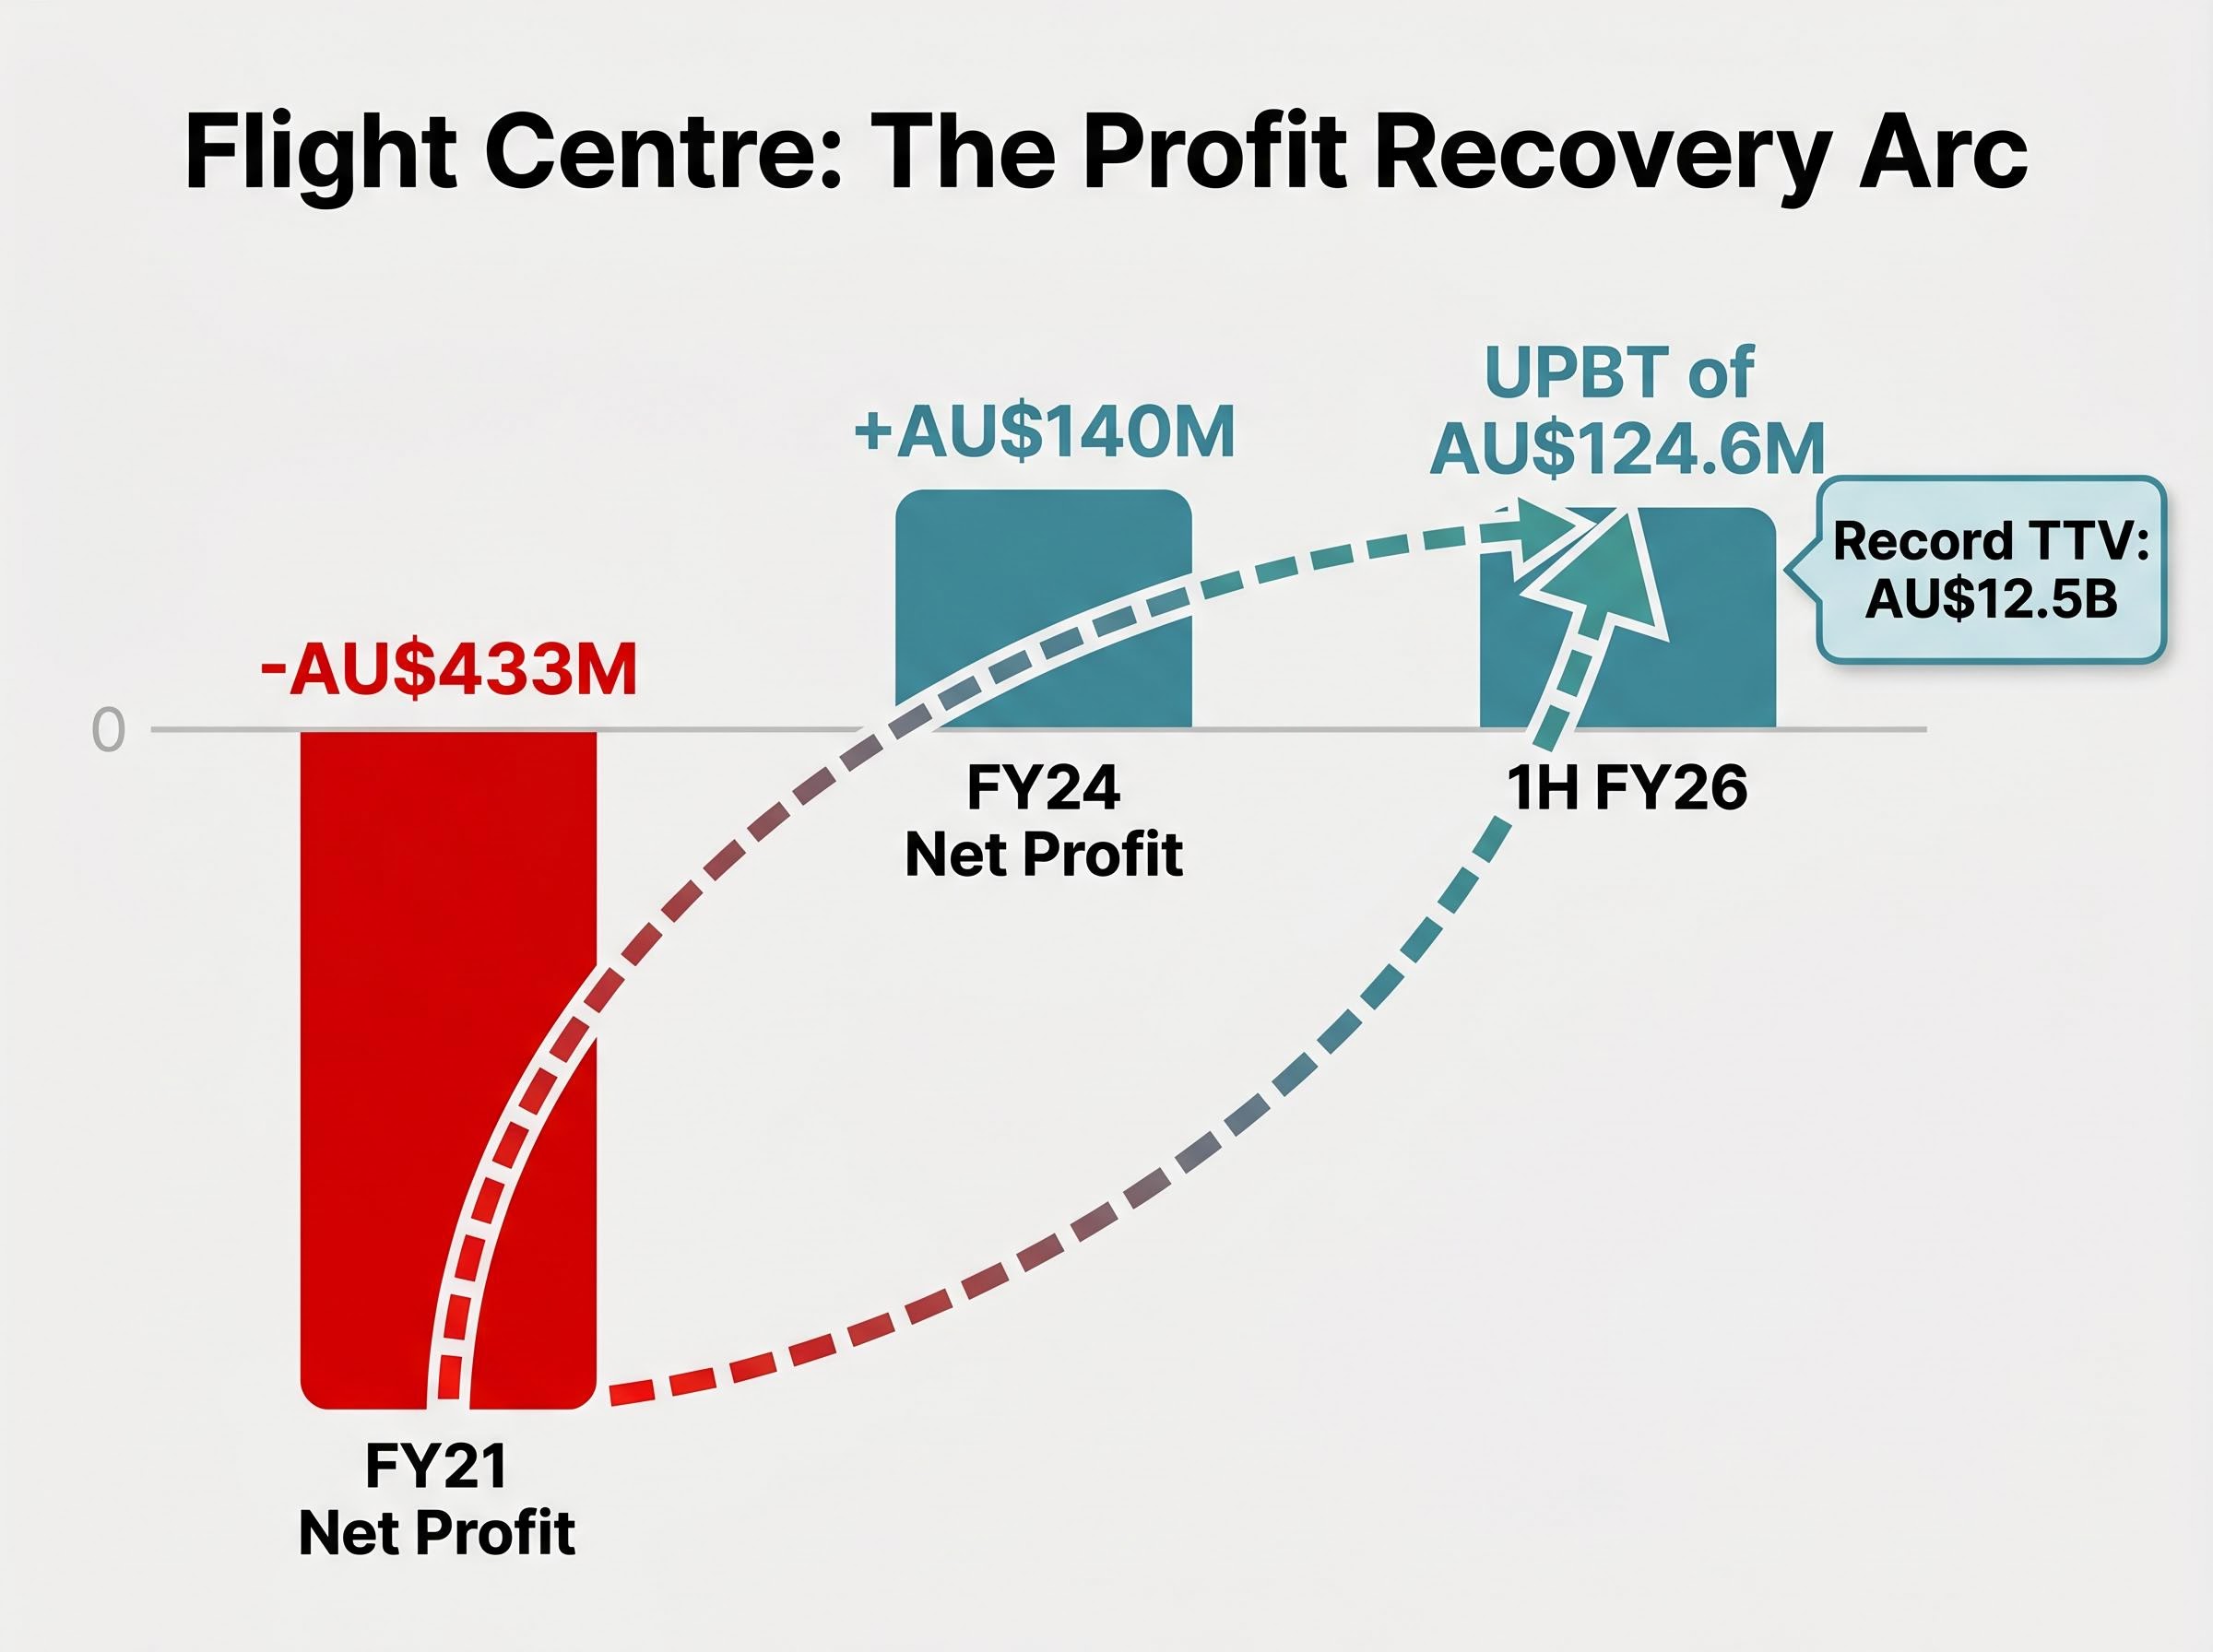
Flight Centre’s post-pandemic financial arc is one of the more striking turnarounds on the ASX. Revenue has grown at a compound annual growth rate (CAGR) of approximately 89.8% per year since 2021, reaching AU$2,708 million in FY24. Net profit swung from a loss of AU$433 million to a gain of AU$140 million over the same period.
Those headline figures carry important context. The revenue CAGR is dramatically elevated because the starting base was a pandemic-era trough, a point addressed in the educational section below. What matters more for assessing the current trajectory is whether the recovery has continued into the most recent reporting period.
The 1H FY26 results, reported on 25 February 2026, confirm it has.
ASIC financial reporting obligations require disclosing entities such as ASX-listed companies to lodge both annual and half-year financial reports, which is why the 1H FY26 and FY24 results cited throughout this analysis carry a standardised basis that allows meaningful comparison across reporting periods.
| Metric | FY21 / Start of Period | FY24 / 1H FY26 |
|---|---|---|
| Revenue | Pandemic-era trough | AU$2,708M (FY24); AU$1.41B (1H FY26, +6% YoY) |
| Net Profit | -AU$433M | +AU$140M (FY24) |
| ROE | Negative | 11.9% |
| TTV (Total Transaction Value) | N/A | AU$12.5B (1H FY26, +7% YoY, record) |
“AU$12.5 billion in total transaction value for the half-year represents a record for Flight Centre.”
The 1H FY26 underlying profit before tax (UPBT) came in at AU$124.6 million, up 4% year-on-year. A fully franked interim dividend of 12 cents per share was declared. Revenue for the half rose 6% to AU$1.41 billion.
The story these numbers tell is of a business that has moved from existential loss to profitable growth over five years. The share price, down more than a third, does not reflect that trajectory on its face.
The corporate division profit growth story is particularly instructive: for the nine months to March 2026, corporate UPBT rose 23% to AU$177 million while corporate TTV grew only 4%, a pattern that suggests the earnings recovery is being driven by margin expansion as much as volume, rather than simply riding a travel demand tailwind.
CAR Group presents a structurally different but comparably instructive case. Where Flight Centre’s growth story is one of pandemic recovery, CAR Group’s is one of compounding revenue driven by domestic market dominance and international platform expansion.
Revenue grew at a CAGR of approximately 37.0% per year over the three years to FY24, reaching AU$1,099 million. Net profit rose from AU$131 million to AU$250 million over the same period, nearly doubling. The most recently reported ROE sits at 8.6%.
| Metric | Start of Period (3 years prior) | FY24 |
|---|---|---|
| Revenue | Base year | AU$1,099M |
| Net Profit | AU$131M | AU$250M |
| ROE | N/A | 8.6% |
A significant portion of that growth has come from international acquisitions. CAR Group’s platform portfolio now spans four markets:
That international footprint is both a growth driver and a complexity layer. Each platform carries its own execution risk, competitive dynamics, and currency exposure. Investors evaluating CAR Group at current levels would benefit from reviewing the most recent half-year results and platform-level performance data, which fall outside the confirmed data available for this analysis.
Investors wanting to go beyond the FY24 snapshot covered here will find our full analysis of CAR Group’s profit growth and valuation gap covers the H1 FY26 result in detail, including a breakdown of why the P/S ratio has compressed to a 35% discount to its five-year average and what key risks, including the RBA rate environment and structural competition from Facebook Marketplace, the re-rating thesis depends on.
The three financial indicators used throughout this article, revenue CAGR, profit trajectory, and return on equity, each serve a specific purpose when assessing growth-oriented companies. A brief explanation of each:
Return on equity, revenue growth, and profit trajectory each answer a different question about the same business, and knowing how these fundamental analysis metrics interact is what separates a surface-level reading of a result from a genuine assessment of business quality.
ROE is calculated by dividing net profit by shareholders’ equity. A higher figure generally signals that the business generates more profit per dollar of equity invested. However, sector norms vary, and elevated debt levels can inflate the figure by reducing the equity base.
FLT’s ROE of 11.9% and CAR’s ROE of 8.6% provide a useful contrast. Neither figure is definitively superior without understanding each company’s capital structure and sector context. These metrics are best treated as a starting screen rather than a complete valuation.
Examining each company individually builds understanding, but placing them side by side is where the comparative value sharpens.
| Metric | FLT Value | FLT Period | CAR Value | CAR Period |
|---|---|---|---|---|
| Revenue | AU$2,708M | FY24 | AU$1,099M | FY24 |
| Revenue CAGR | 89.8% | Since 2021 | 37.0% | 3 years to FY24 |
| Net Profit (most recent) | AU$140M | FY24 | AU$250M | FY24 |
| ROE | 11.9% | Most recent | 8.6% | Most recent |
| Share Price Decline | ~35.8% | Since start of 2025 | ~37.9% | From 52-week high |
“Both stocks are down more than 35% from recent highs, yet both have grown revenue and profit over the same period. That divergence between price and fundamentals is where investor analysis begins.”
The most striking contrast sits in the revenue CAGR column. FLT’s 89.8% figure is dramatically higher, but that is driven largely by pandemic-recovery arithmetic; the starting base was a decimated travel industry. CAR’s 37.0% reflects a more structurally compounding trajectory from a higher base.
On profitability, CAR currently generates a larger net profit (AU$250 million vs AU$140 million) despite lower revenue, pointing to a higher-margin business model. FLT carries a higher ROE, suggesting greater capital efficiency at this stage of its recovery.
The 1H FY26 result for FLT is the most current confirmed data point available. A fully current comparison would require updated CAR Group results, which investors should seek before drawing final conclusions.
The financial data examined here establishes a clear baseline for both companies. Flight Centre has moved from deep pandemic-era loss to sustained profitability, with its most recent half-year confirming record transaction volumes and continued revenue growth. CAR Group has nearly doubled its net profit over three years while expanding across four international markets.
Both businesses have grown. Both share prices have fallen. Resolving that divergence requires analysis that extends beyond the three metrics covered in this article. Investors considering either name could take the following next steps:
This analysis is a starting screen, not a recommendation. The numbers suggest the businesses behind these share prices have not deteriorated in line with the declines, but further due diligence is where informed investment decisions are made.
Whether a beaten-down profitable business represents a value play or value trap ultimately depends on structural questions this article does not resolve: competitive position in the leisure segment, free cash flow history, and the technology investment cycle that management expects will drive future margin improvement.
This article is for informational purposes only and should not be considered financial advice. Investors should conduct their own research and consult with financial professionals before making investment decisions. Past performance does not guarantee future results.
Revenue CAGR, or compound annual growth rate, measures how quickly a company's revenue has grown on an annualised, compounding basis over a set period. It smooths out unusually high or low single-year figures, giving investors a clearer picture of the underlying growth trend.
Flight Centre's share price has declined roughly 35.8% since the start of 2025, even though revenue reached AU$2,708 million in FY24 and the company returned to profitability with a net profit of AU$140 million. Growth-oriented stocks in cyclical sectors like travel can experience price moves driven by interest rate expectations, consumer sentiment, and broader market conditions rather than earnings alone.
CAR Group operates across four markets: carsales in Australia, Encar in South Korea, Trader Interactive in the United States, and chileautos in Chile. This international expansion has been a key driver of the company's revenue CAGR of approximately 37% over the three years to FY24.
Return on equity (ROE) measures how efficiently a company converts shareholder funds into profit, calculated by dividing net profit by shareholders' equity. Flight Centre's ROE stands at 11.9% and CAR Group's at 8.6%, though both figures should be assessed in the context of each company's capital structure and sector norms rather than in isolation.
Investors should review each company's most recent half-year results, examine broker consensus price targets, assess current valuation multiples against historical averages, and consider macro factors such as interest rate expectations and consumer sentiment. Comparing current price-to-earnings ratios against historical norms can help determine whether a share price decline reflects a genuine business deterioration or a sentiment-driven overshoot.