Barclays: Iran Deal Could Spark Cross-Asset Rally on Oil Drop
5 hrs ago

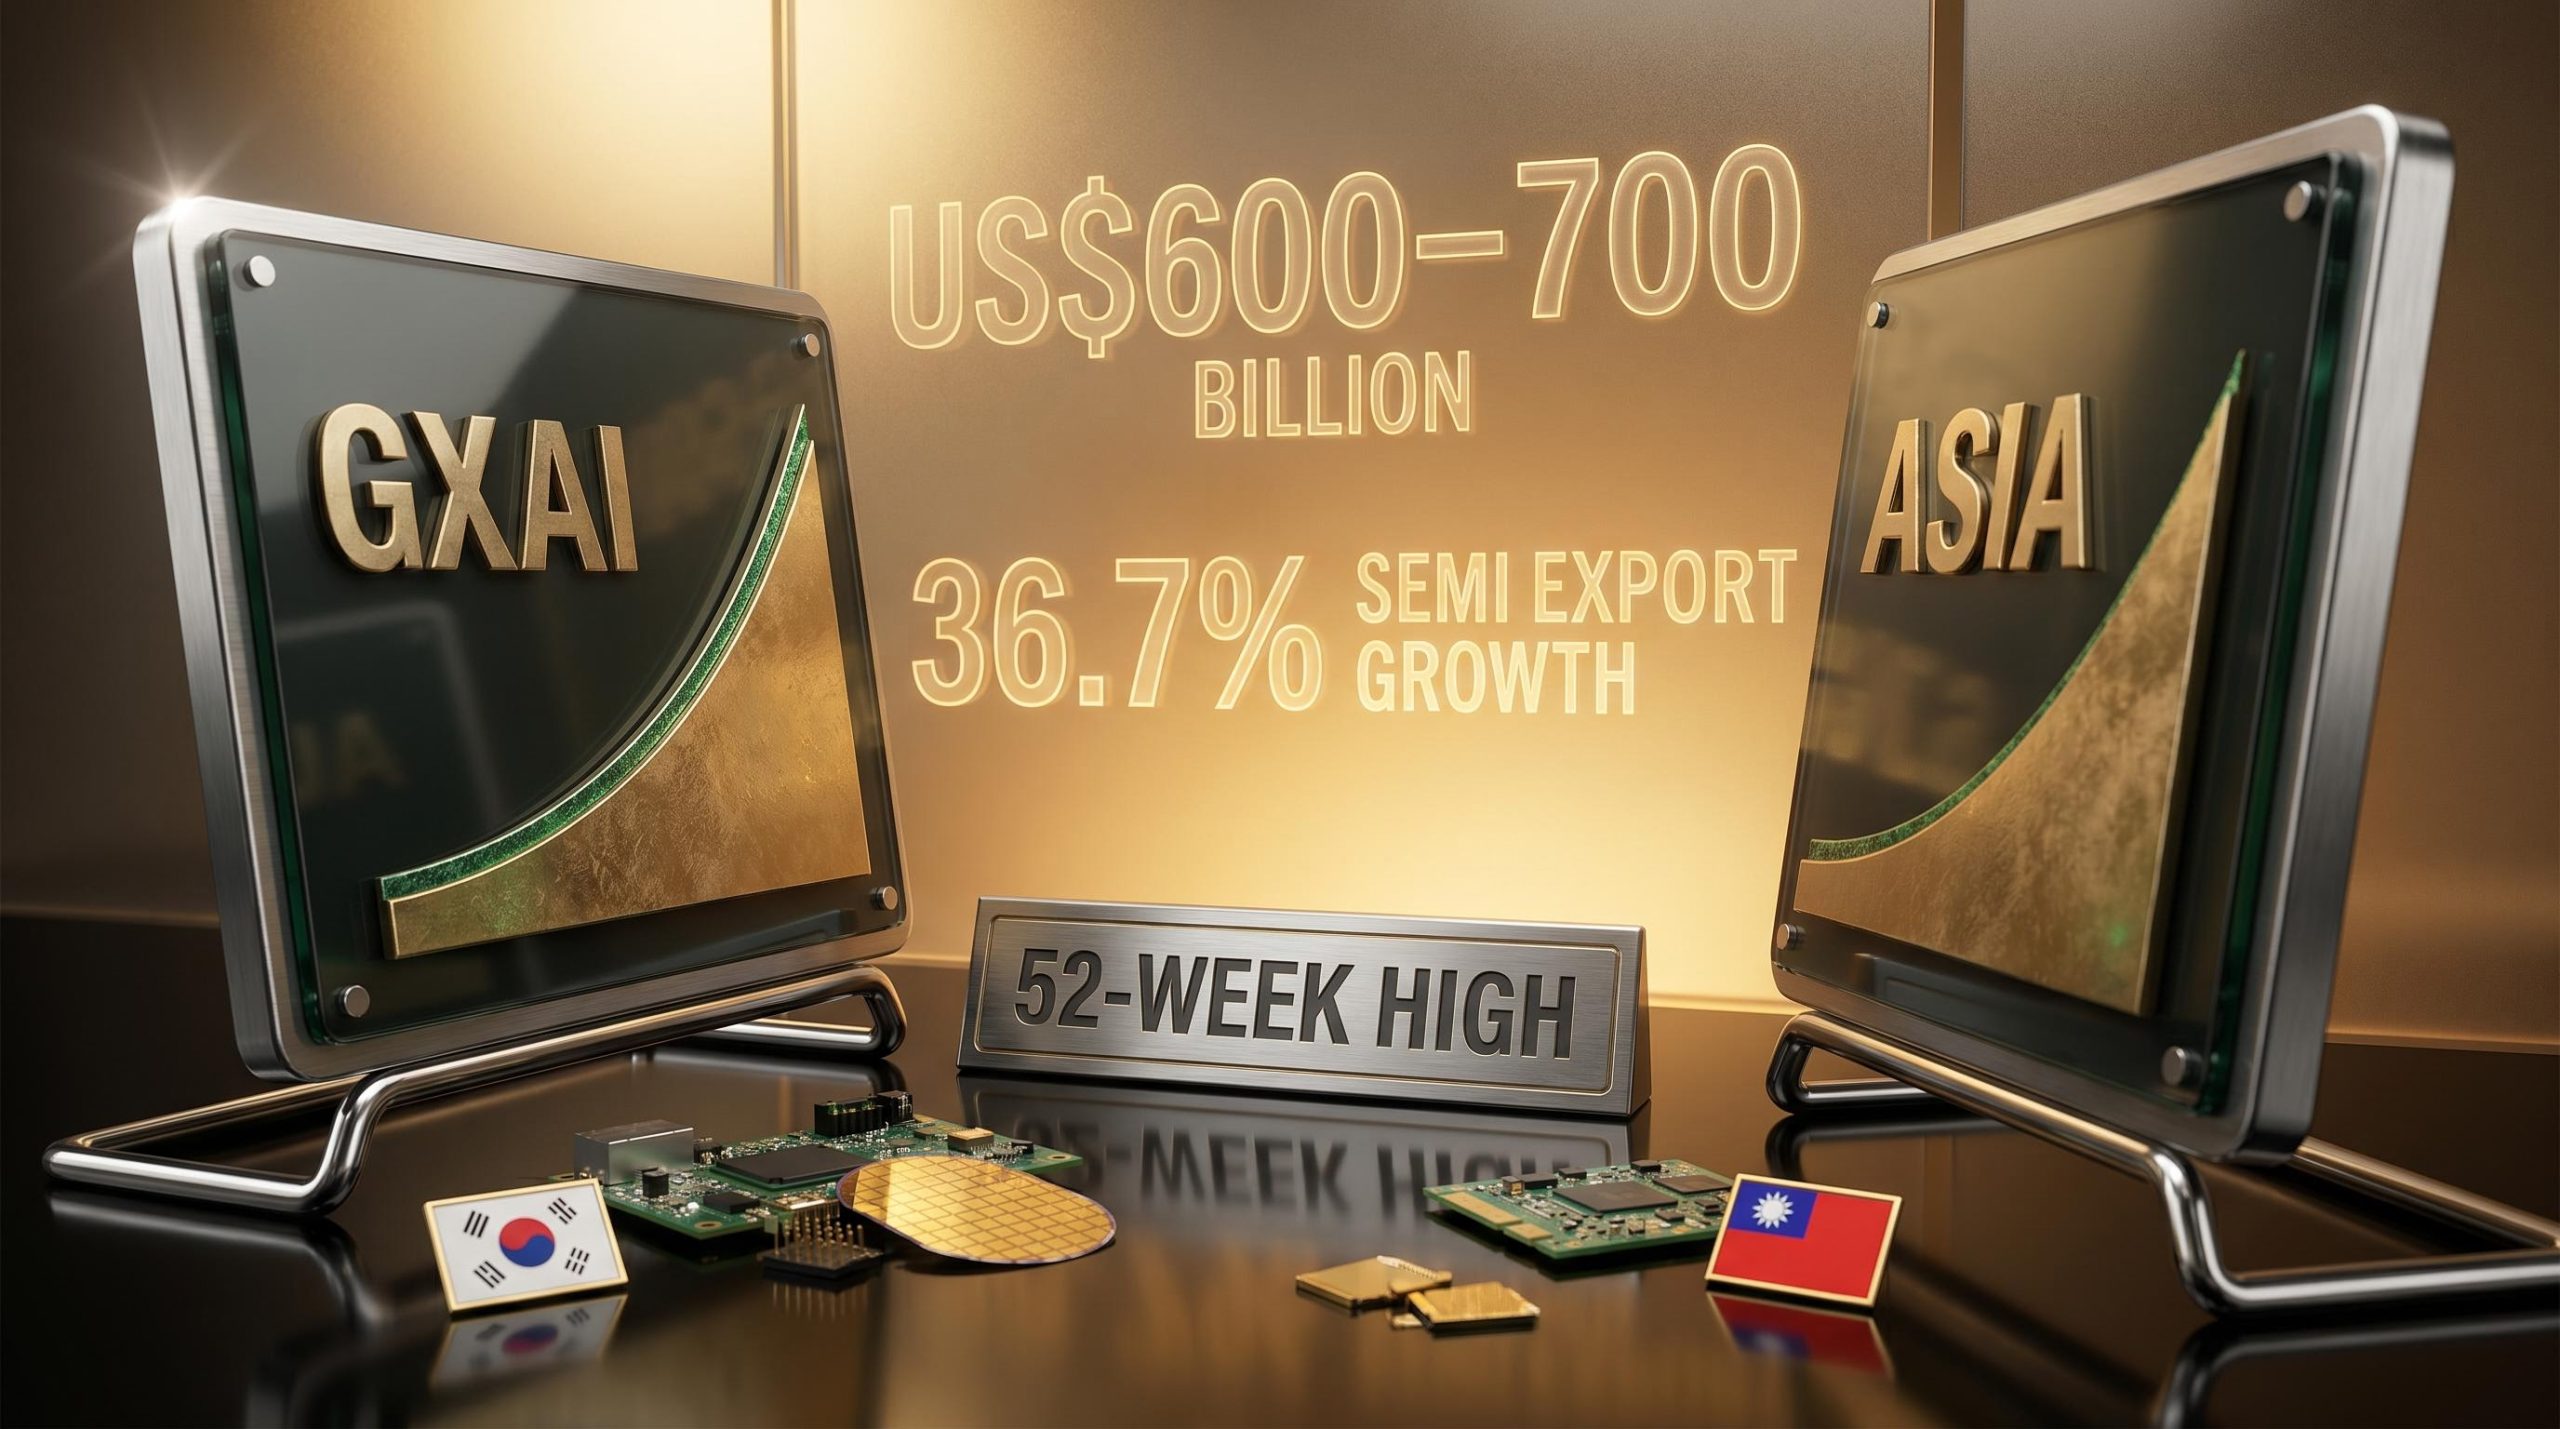
Most investors instinctively hesitate when a fund is trading at its highest price in a year. That hesitation has a name in behavioural finance, and it costs money. In May 2026, two ASX-listed ETFs focused on artificial intelligence and Asian technology, Global X Artificial Intelligence ETF (ASX: GXAI) and BetaShares Asia Technology Tigers ETF (ASX: ASIA), reached simultaneous 52-week highs. Rather than triggering confidence, the milestone triggered caution among many retail investors.
The instinct to avoid buying ETFs at 52-week highs is understandable. It is also, in most documented cases, wrong. What follows is an analytical framework for evaluating whether a 52-week high is a warning signal or a buy signal, grounded in momentum theory, two live Australian ETF case studies, and a practical investor-profile checklist. The goal is not a recommendation but a structure for clearer thinking.
The discomfort has a precise name: price anchoring. When an ETF reaches a 52-week high, many investors treat that high as a ceiling, a price the fund “should” be at or below, rather than a reference point on a longer trajectory. The anchor is arbitrary, set by whatever the price happened to do over the prior 12 months, yet it shapes decisions as though it carries predictive weight.
It does not. A 52-week high reflects what has already happened to prices. It carries no information about what will happen next. Conflating the two is a category error, and it is among the most common mistakes retail investors make.
Price anchoring is one of six interlocking biases that research on investor psychology and cognitive bias identifies as forming a feedback loop during both bull and bear markets, with each bias amplifying the others precisely when the stakes are highest.
The distinction that matters: Price memory (where the fund has been) is not price direction (where the fund is going). Anchoring confuses the first for the second.
New highs also attract attention-driven flows, as investors who missed the initial move buy in on momentum. That self-reinforcing dynamic is worth understanding rather than simply reacting to, because it sits at the centre of one of the most replicated findings in finance.
Jegadeesh and Titman’s research, first published in the 1990s and replicated across equity markets globally (including Asia-Pacific contexts), established a clear pattern: assets that have outperformed over the prior 6-12 months tend to continue outperforming over the next 6-12 months. The effect is not marginal. It is one of the most durable anomalies in the academic record.
Jegadeesh and Titman’s momentum research, published in the Journal of Finance in 1993 and replicated across equity markets globally, established that strategies buying past strong performers generate significant positive returns over three to twelve month holding periods, making it one of the most durable anomalies in the academic record.
One caveat matters here. The momentum factor describes behaviour across broad, diversified markets. Thematic ETFs like GXAI and ASIA add concentration risk that modifies the clean momentum picture. The signal is real; its application to narrow sector funds requires more care.
The question for investors is not whether GXAI has risen. It is whether the underlying environment would have to change for the price move to prove unsustainable. Working through the fundamentals clarifies what, specifically, would need to go wrong.
GXAI provides diversified exposure across the artificial intelligence value chain, spanning:
Key underlying holdings include names such as NVIDIA, Broadcom, and other AI-infrastructure-exposed companies. The fund is issued by Global X ETFs Australia, is actively listed on the ASX, and carries primarily USD-denominated underlying exposure.
The structural tailwind is hyperscaler capital expenditure. 2026 consensus forecasts point to well above US$600-$700 billion in AI infrastructure spending by major cloud and technology companies, with projections exceeding US$1 trillion for 2027, according to reporting on big tech capex trajectories.
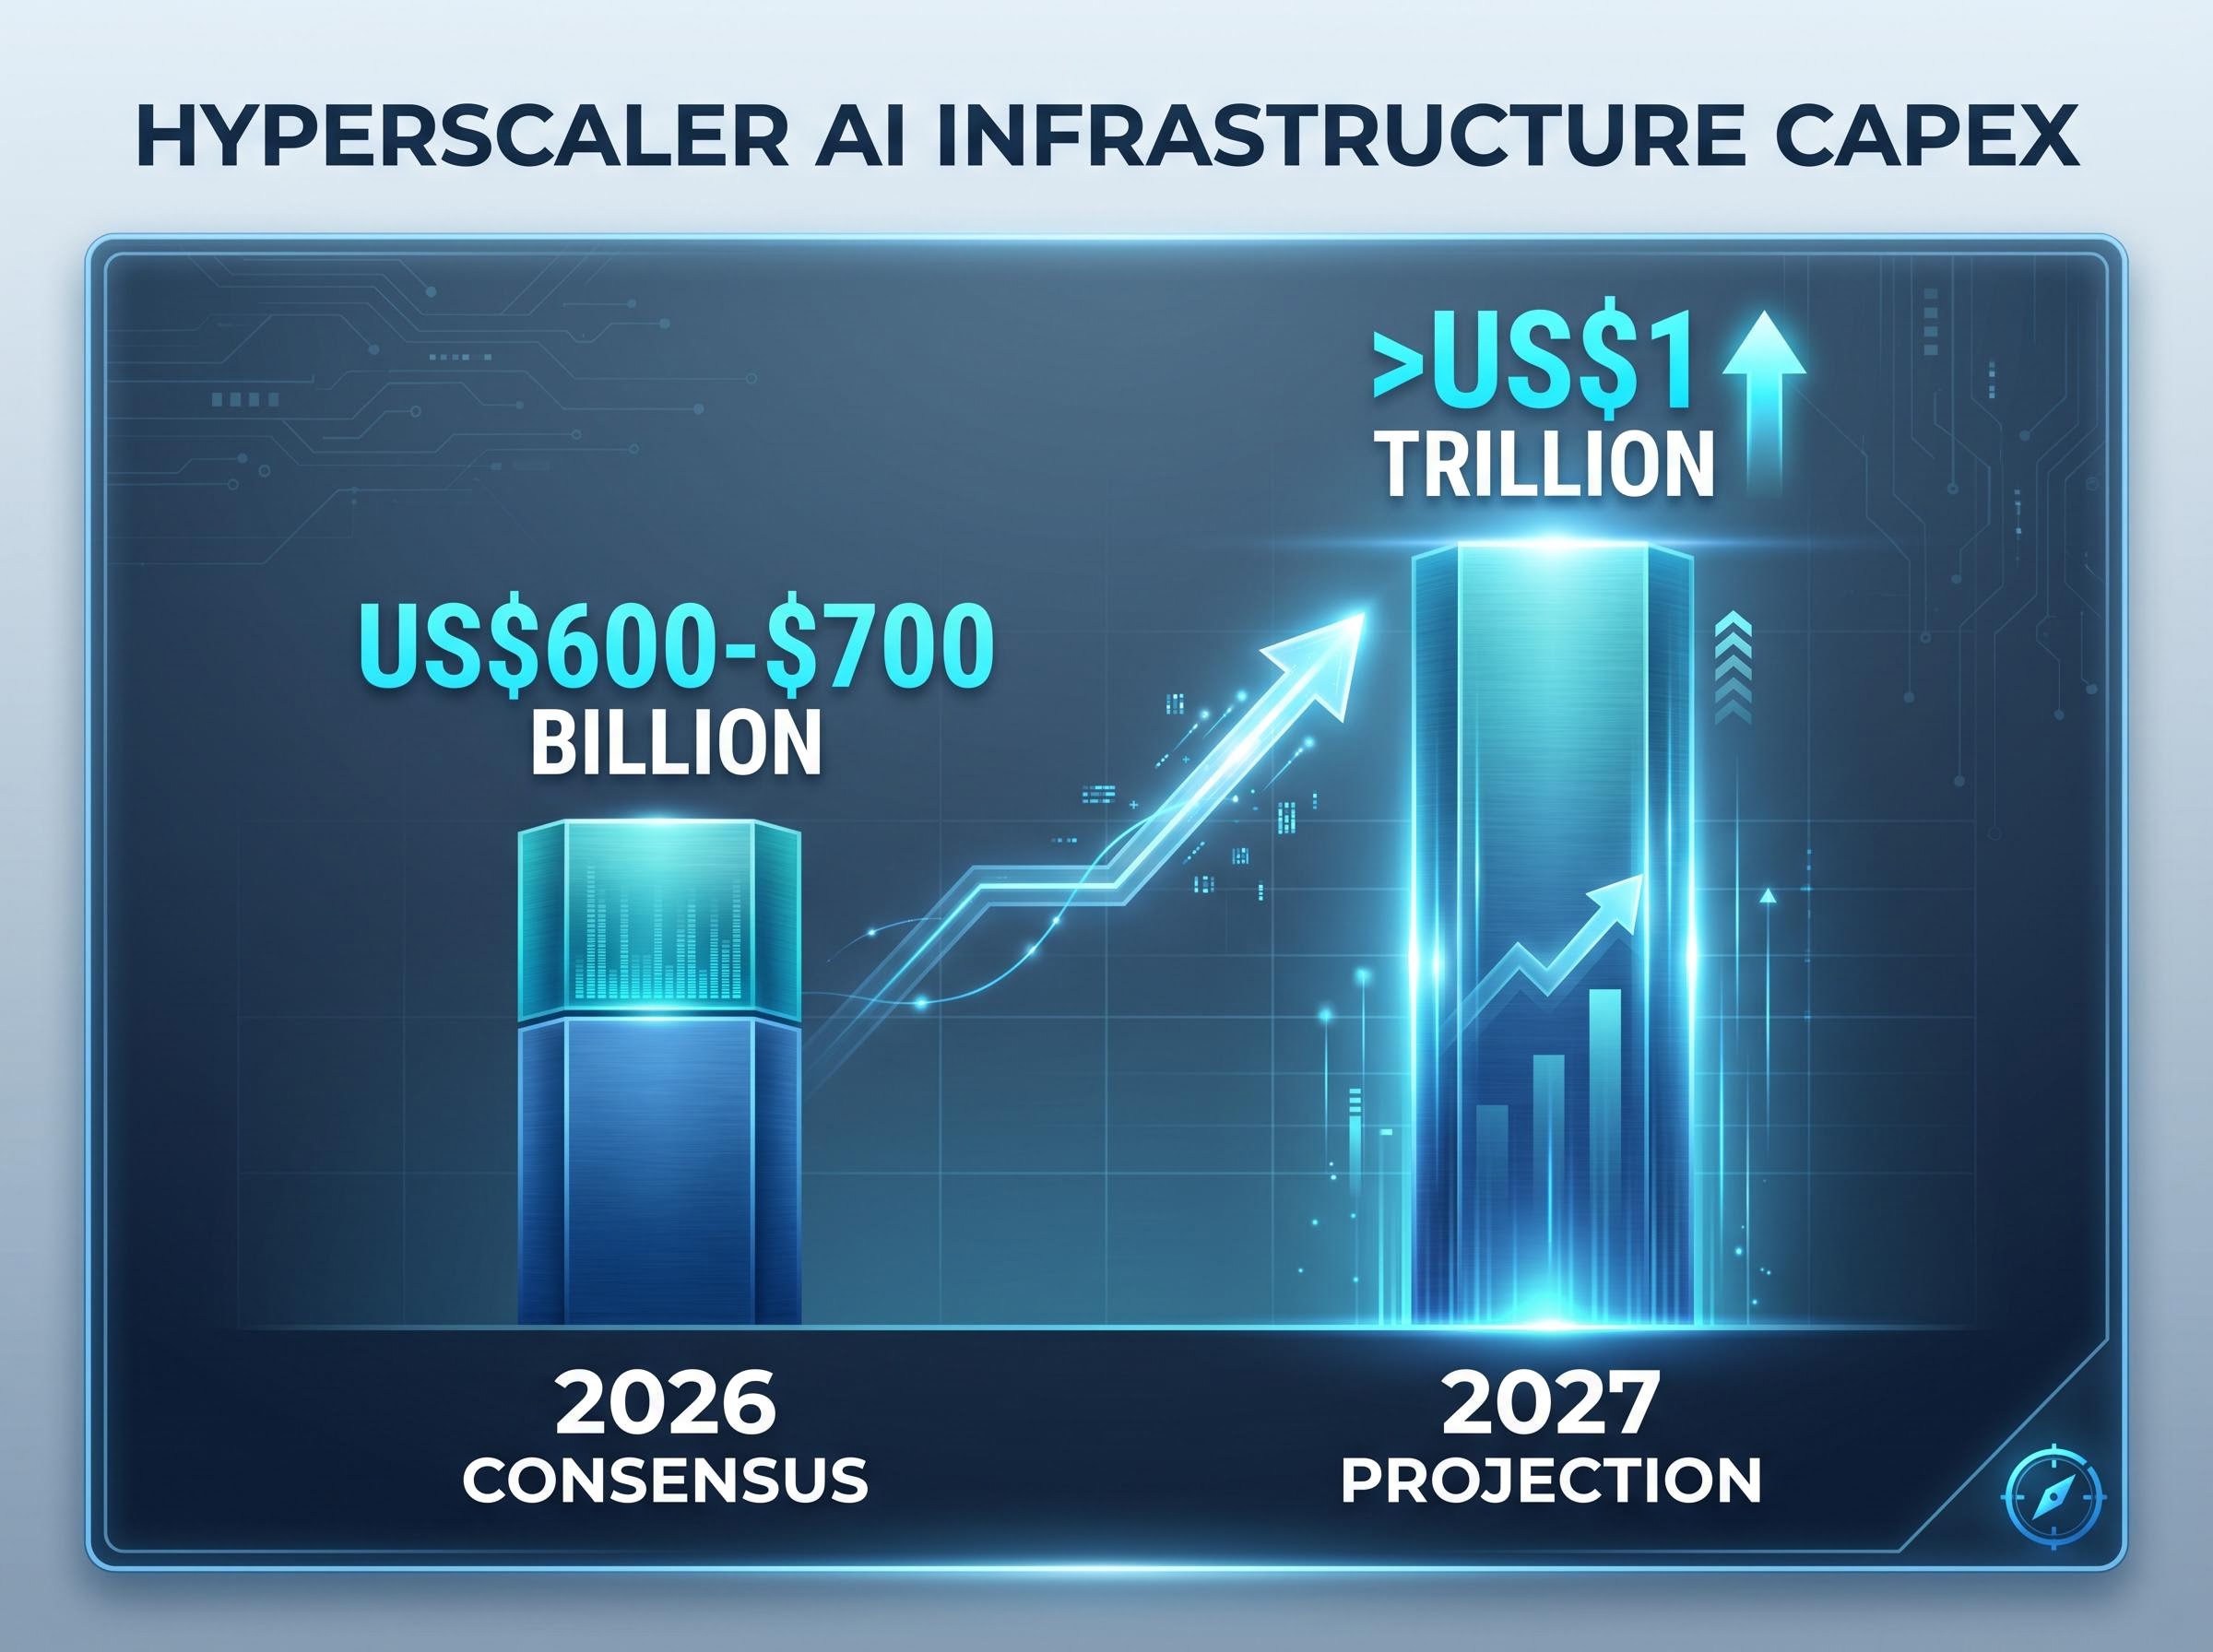
Hyperscaler AI spending above US$600 billion in a single year is not a forecast that requires optimistic assumptions. It is the baseline that multiple large-cap technology companies have already guided toward.
Corporate AI adoption remains in relatively early stages, suggesting the growth curve extends well beyond any single-year rally. The structural case does not guarantee returns, but it does mean the price movement has identifiable fundamental support beneath it.
A 52-week high is a trailing metric. It measures where prices have been over the prior year, not where they are heading. This distinction sounds simple, but the number of investment decisions made as though a trailing high were a forward signal suggests it is not widely internalised.
Two distinct investor reactions follow a new high. The first is to sell the news, treating the high as a peak and taking profits. The second is to read the high as trend confirmation, evidence that the market is repricing the asset higher for structural reasons. Both responses have internal logic. Neither is automatically correct.
The distinction that separates informed decisions from reactive ones is between price momentum and fundamental momentum. Price momentum is what has happened to the share price. Fundamental momentum is what has happened to the underlying earnings, revenue, or sector spending environment.
The strongest case for buying at a high occurs when both are aligned. The weakest case is when price momentum is running ahead of fundamentals. For GXAI, the hyperscaler capex cycle provides identifiable fundamental support. For ASIA, Korean semiconductor export growth of approximately 36-37% in 2026 offers a similar anchor. Whether that support is sufficient is a judgement call, but the framework for making it is clear.
| ETF Type | Concentration Level | Momentum Signal Reliability | Reversion Risk | Suitable Holding Horizon |
|---|---|---|---|---|
| Broad-market (e.g., A200, VGS) | Low | Higher (diversified factor exposure) | Lower | 3-5+ years |
| Thematic (e.g., GXAI, ASIA) | High | Moderate (sector-specific drivers) | Higher | 5+ years (to absorb drawdowns) |
Academic research suggests the momentum effect operates most reliably across 6-12 month holding periods. Beyond 12-18 months, returns tend to mean-revert. For thematic ETFs, where concentration amplifies both gains and losses, a longer time horizon is typically required to absorb that reversion risk. ASIC’s general regulatory posture on thematic ETFs emphasises disclosure of concentration risk, a signal that investors should understand what drives a high before acting on it.
The assumption that Asian technology is a single, undifferentiated risk does not survive contact with ASIA‘s holdings. The fund spans South Korea, Taiwan, China, and other Asian markets, covering semiconductors, digital platforms, e-commerce, gaming, and payments. That is genuine geographic and sub-sector diversification within the technology theme.
The most concrete fundamental tailwind is Korean semiconductor exports, which grew approximately 36.7% in 2026, according to reporting from Chosun English in April 2026. That growth flows directly through to holdings such as Samsung and SK Hynix. Other top holdings include TSMC, Tencent, and Alibaba, each operating in distinct sub-sectors of the Asian technology economy.
ASIA is issued by BetaShares, is actively listed on the ASX, and carries multi-currency exposure across KRW, TWD, HKD, and CNH, among others.
Typical Australian retail portfolios overweight domestic equities and US-listed names, with Asian technology systematically underrepresented relative to its global market weighting. A 52-week high for ASIA may partly reflect a rerating of a structurally undervalued region rather than speculative excess. This is a portfolio construction consideration, not a standalone call to buy.
The material risk factors deserve equal weight:
After building the structural case, the honest next step is to identify what could unwind it. Momentum strategies are most dangerous precisely when they feel most compelling.
Both GXAI and ASIA are thematic ETFs with significantly higher sector concentration than broad-market alternatives. When a concentrated sector reverses, the drawdowns are sharper and faster than in a diversified fund. Buying at a trailing high means paying a premium that requires continued fundamental momentum to justify. If hyperscaler capex guidance disappoints, or if semiconductor export growth decelerates, the correction could be steep.
The thematic ETF behaviour gap, documented most starkly in the ARK Innovation case where a reported 233% time-weighted return translated into an estimated negative 35% money-weighted return for the typical investor, is the structural risk that buying at a trailing high concentrates: inflows near peak valuations lock in precisely the timing that costs most.
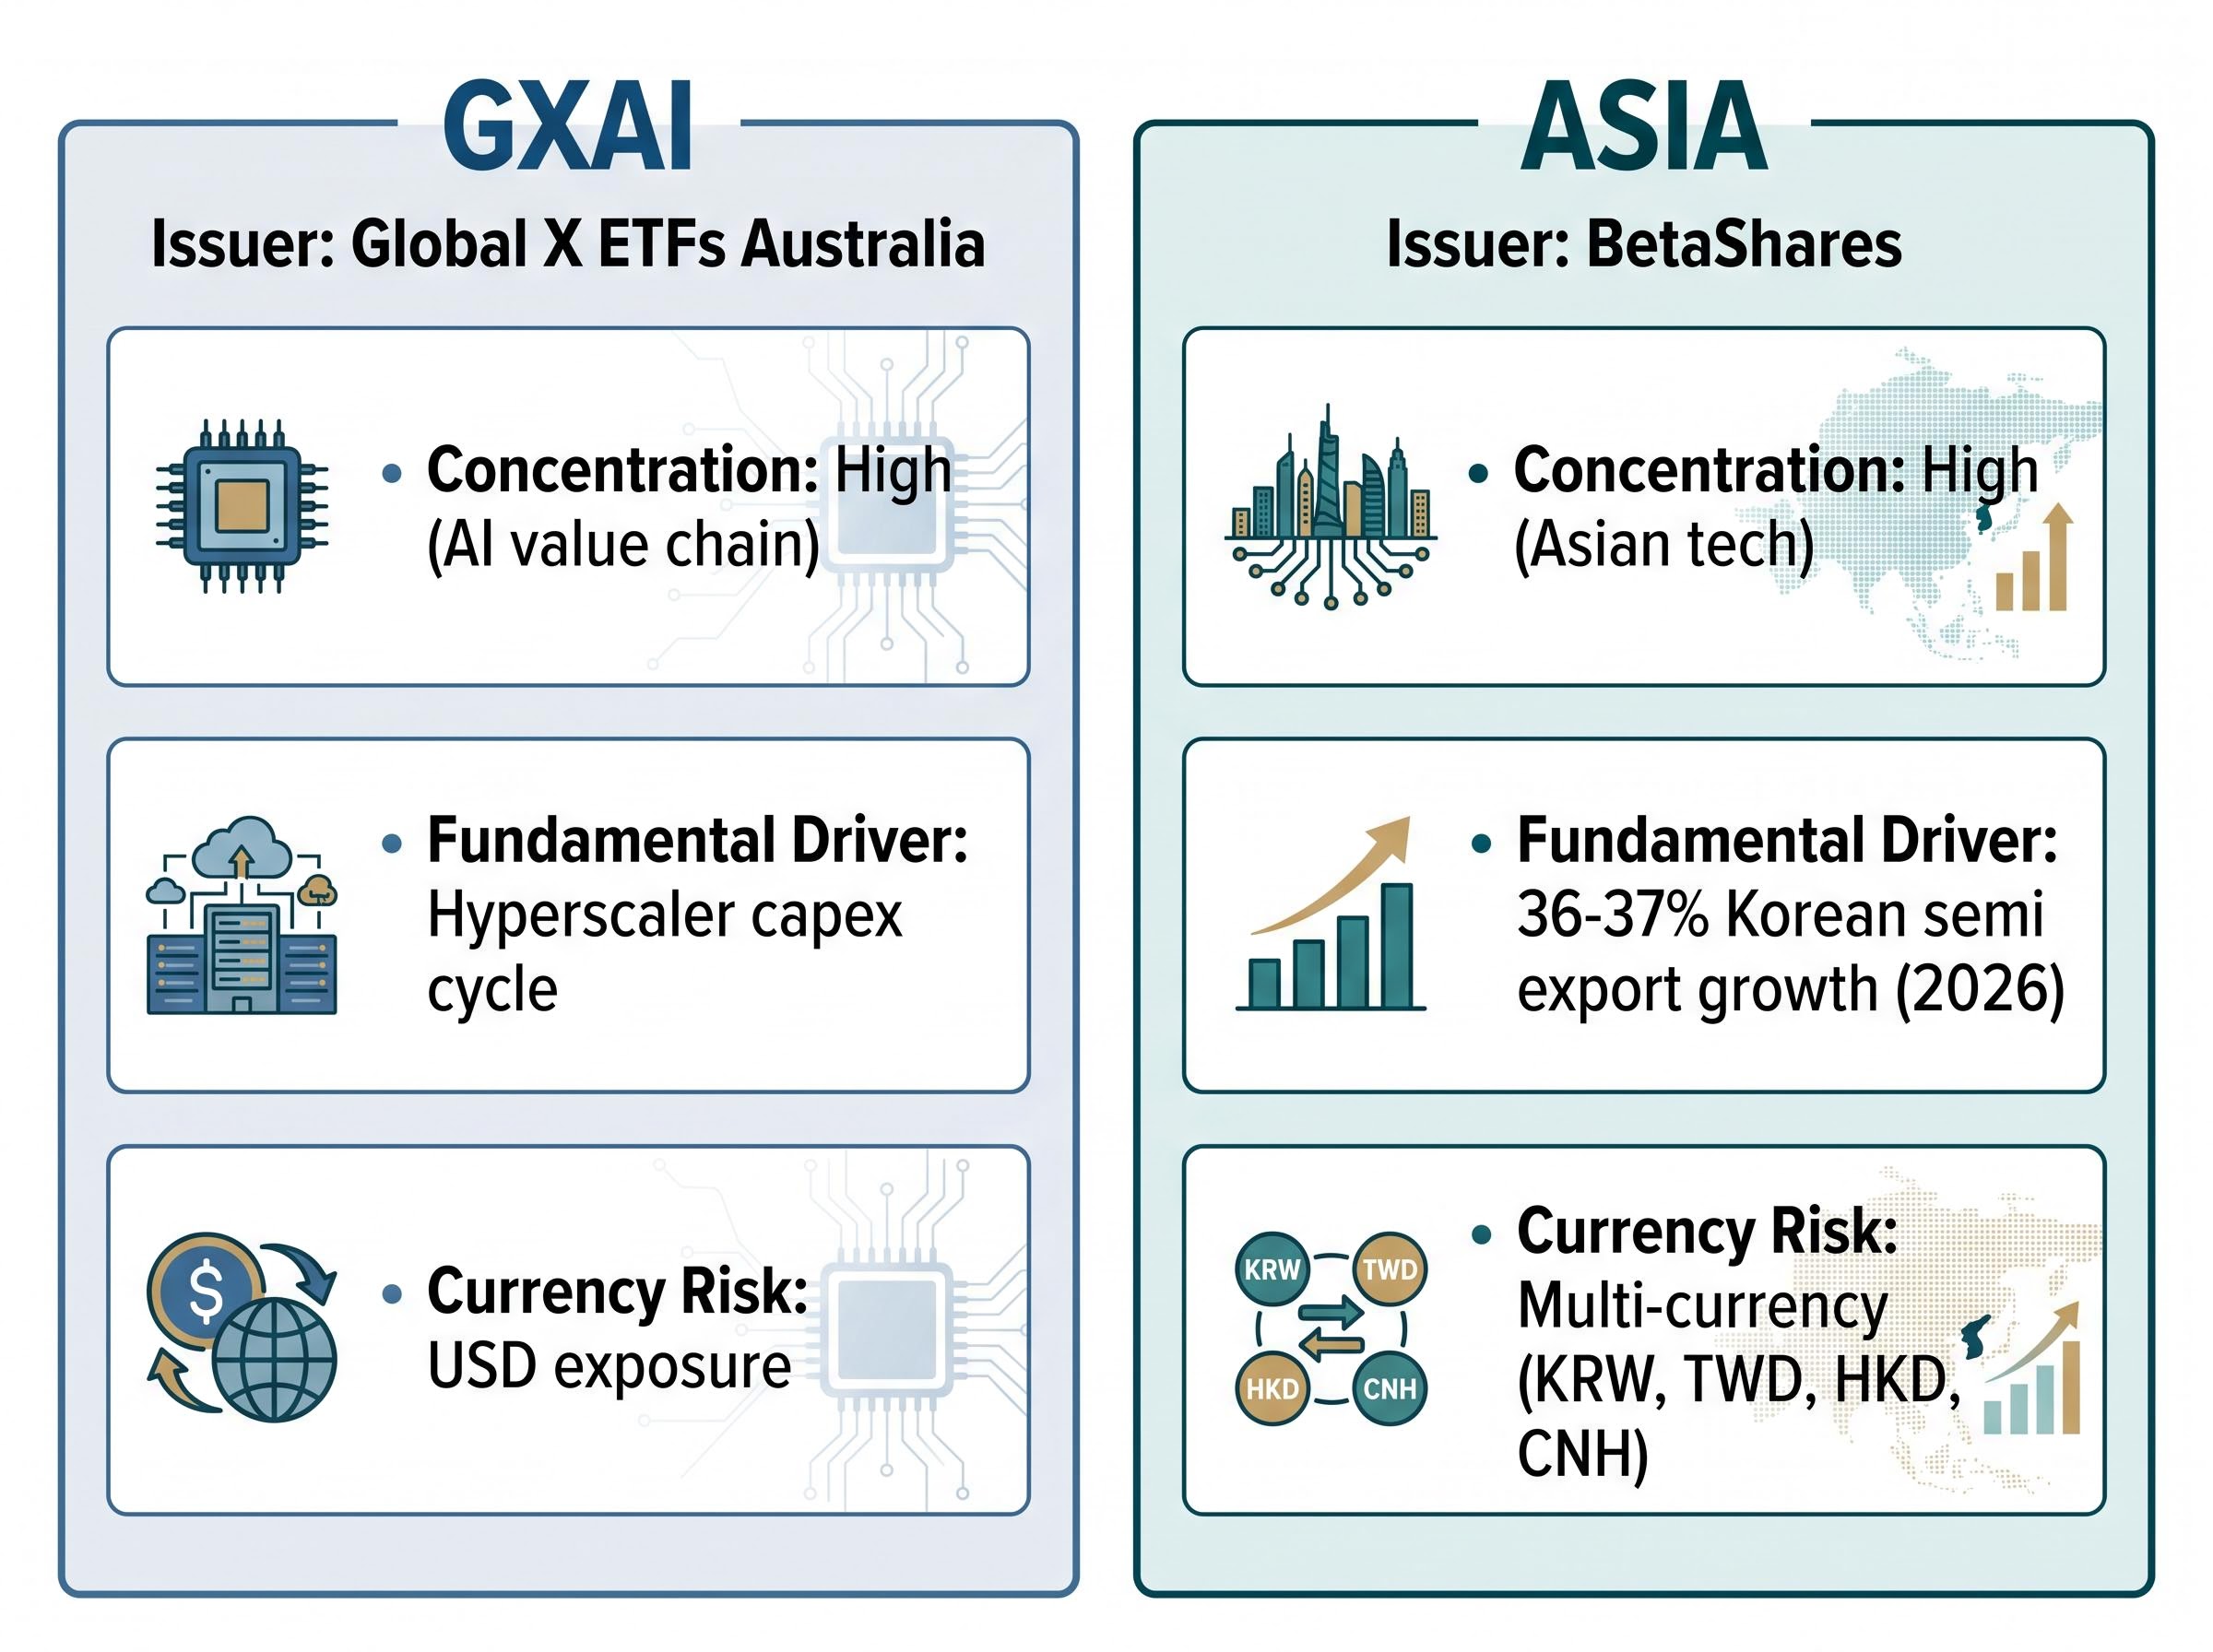
| ETF | Sector Concentration | Currency Risk | Momentum Profile | Suited Risk Tolerance |
|---|---|---|---|---|
| GXAI | High (AI value chain) | USD exposure | Strong (capex-driven) | High |
| ASIA | High (Asian tech) | Multi-currency (KRW, TWD, HKD, CNH) | Strong (semi exports) | High |
| A200 | Low (ASX broad market) | AUD (domestic) | Moderate | Moderate |
| VGS | Low (global broad market) | Multi-currency (developed markets) | Moderate | Moderate |
Currency adds another layer. Australian investors in GXAI hold USD exposure; those in ASIA hold exposure to multiple Asian currencies. AUD appreciation against those currencies erodes returns regardless of how the underlying holdings perform.
Momentum strategies require a time horizon long enough to survive the drawdowns that will occur. The question is not whether a reversal will happen but whether the investor can hold through it.
AI and semiconductor stocks remain sensitive to earnings cycles, rate expectations, and capex guidance from major hyperscalers. ASIC’s general posture on thematic ETFs reinforces the point: concentration risk demands that investors understand the specific drivers before committing capital.
Not every investor belongs in this trade. The profile suited to act on momentum at a 52-week high has three specific characteristics:
What distinguishes momentum investing from speculation in this context is the presence of structural fundamental support. The AI capex cycle and the Asian technology rerating are identifiable, measurable forces. They may prove insufficient, but they are not sentiment alone.
Australian investors holding GXAI alongside a broad US index fund may be carrying more overlapping exposure than they realise, since mega-cap concentration in AI-exposed portfolios means that NVIDIA and Broadcom appear as significant weights in both the thematic fund and the cap-weighted index, amplifying the sector bet rather than diversifying it.
Practical position-sizing principles follow from the concentration risk:
Corporate AI adoption is characterised as still in early stages, which suggests GXAI‘s investment case extends beyond a single market cycle if the thesis proves correct. That “if” is doing meaningful work in the sentence.
A 52-week high is a trailing price signal. The decision to act on it should rest on whether the fundamental momentum behind it is durable, not on the price level itself. The two-part test applies: is price momentum supported by fundamental momentum, and is the time horizon long enough to absorb reversion risk?
For GXAI, hyperscaler capex above US$600 billion in 2026 provides identifiable support. For ASIA, Korean semiconductor export growth of approximately 36-37% offers a similar anchor. Neither is a guaranteed outcome. Both carry real concentration and geopolitical risks that any honest investor must weigh against the structural tailwinds.
The framework’s value is not in answering the question for the reader but in giving the reader the right question to ask: does the fundamental case justify the price, and can the portfolio absorb the risk if it doesn’t?
Australian investors should consult a licensed financial adviser for personal investment decisions, consistent with ASIC expectations.
This article is for informational purposes only and should not be considered financial advice. Investors should conduct their own research and consult with financial professionals before making investment decisions. Past performance does not guarantee future results. Financial projections are subject to market conditions and various risk factors.
A 52-week high means the ETF's price is at its highest point over the prior 12 months. It is a trailing price metric reflecting past performance, not a forward-looking signal about future returns.
Academic research, including Jegadeesh and Titman's momentum studies, shows that assets outperforming over the prior 6-12 months tend to continue outperforming over the next 6-12 months, suggesting 52-week highs are not automatically a reason to avoid buying.
Price momentum refers to recent share price gains, while fundamental momentum refers to improvements in underlying earnings, revenue, or sector spending. The strongest case for acting on a high occurs when both are aligned.
Both funds carry high sector concentration, meaning drawdowns can be sharper and faster than in broad-market ETFs. Additional risks include currency exposure, geopolitical tensions affecting Asian technology, and the possibility that hyperscaler capex guidance disappoints.
Investors suited to thematic ETFs at a 52-week high typically have a time horizon of five years or more, genuine tolerance for 20-30% drawdowns without panic selling, and existing core diversification in broad-market funds before adding thematic satellite positions.