
How Hormuz Closure at $104 Oil Is Reshaping Every Asset Class
5 hrs ago

Brent crude crossed $105 per barrel on 27 April 2026, its highest level in weeks, after President Trump cancelled a planned U.S. envoy mission to Islamabad and diplomatic engagement with Iran collapsed over a single weekend. The cancellation of the Witkoff and Kushner visit, combined with Iran’s offer to reopen the Strait of Hormuz in exchange for delaying nuclear talks, has pushed geopolitical risk back to the centre of energy pricing. Only five ships transited the Strait in a 24-hour window around 24-26 April, a figure that quantifies just how constrained global oil supply has become.
What follows is an analysis of the diplomatic sequence, the physical supply disruption, the price and equity market signals visible as of today, and the forward risks that will determine whether this is a temporary spike or the start of a sustained price regime shift for U.S. investors navigating oil and Iran-driven uncertainty.
The speed of the breakdown matters as much as the breakdown itself. A plausible path to de-escalation existed on Friday. By Monday morning, it was gone.
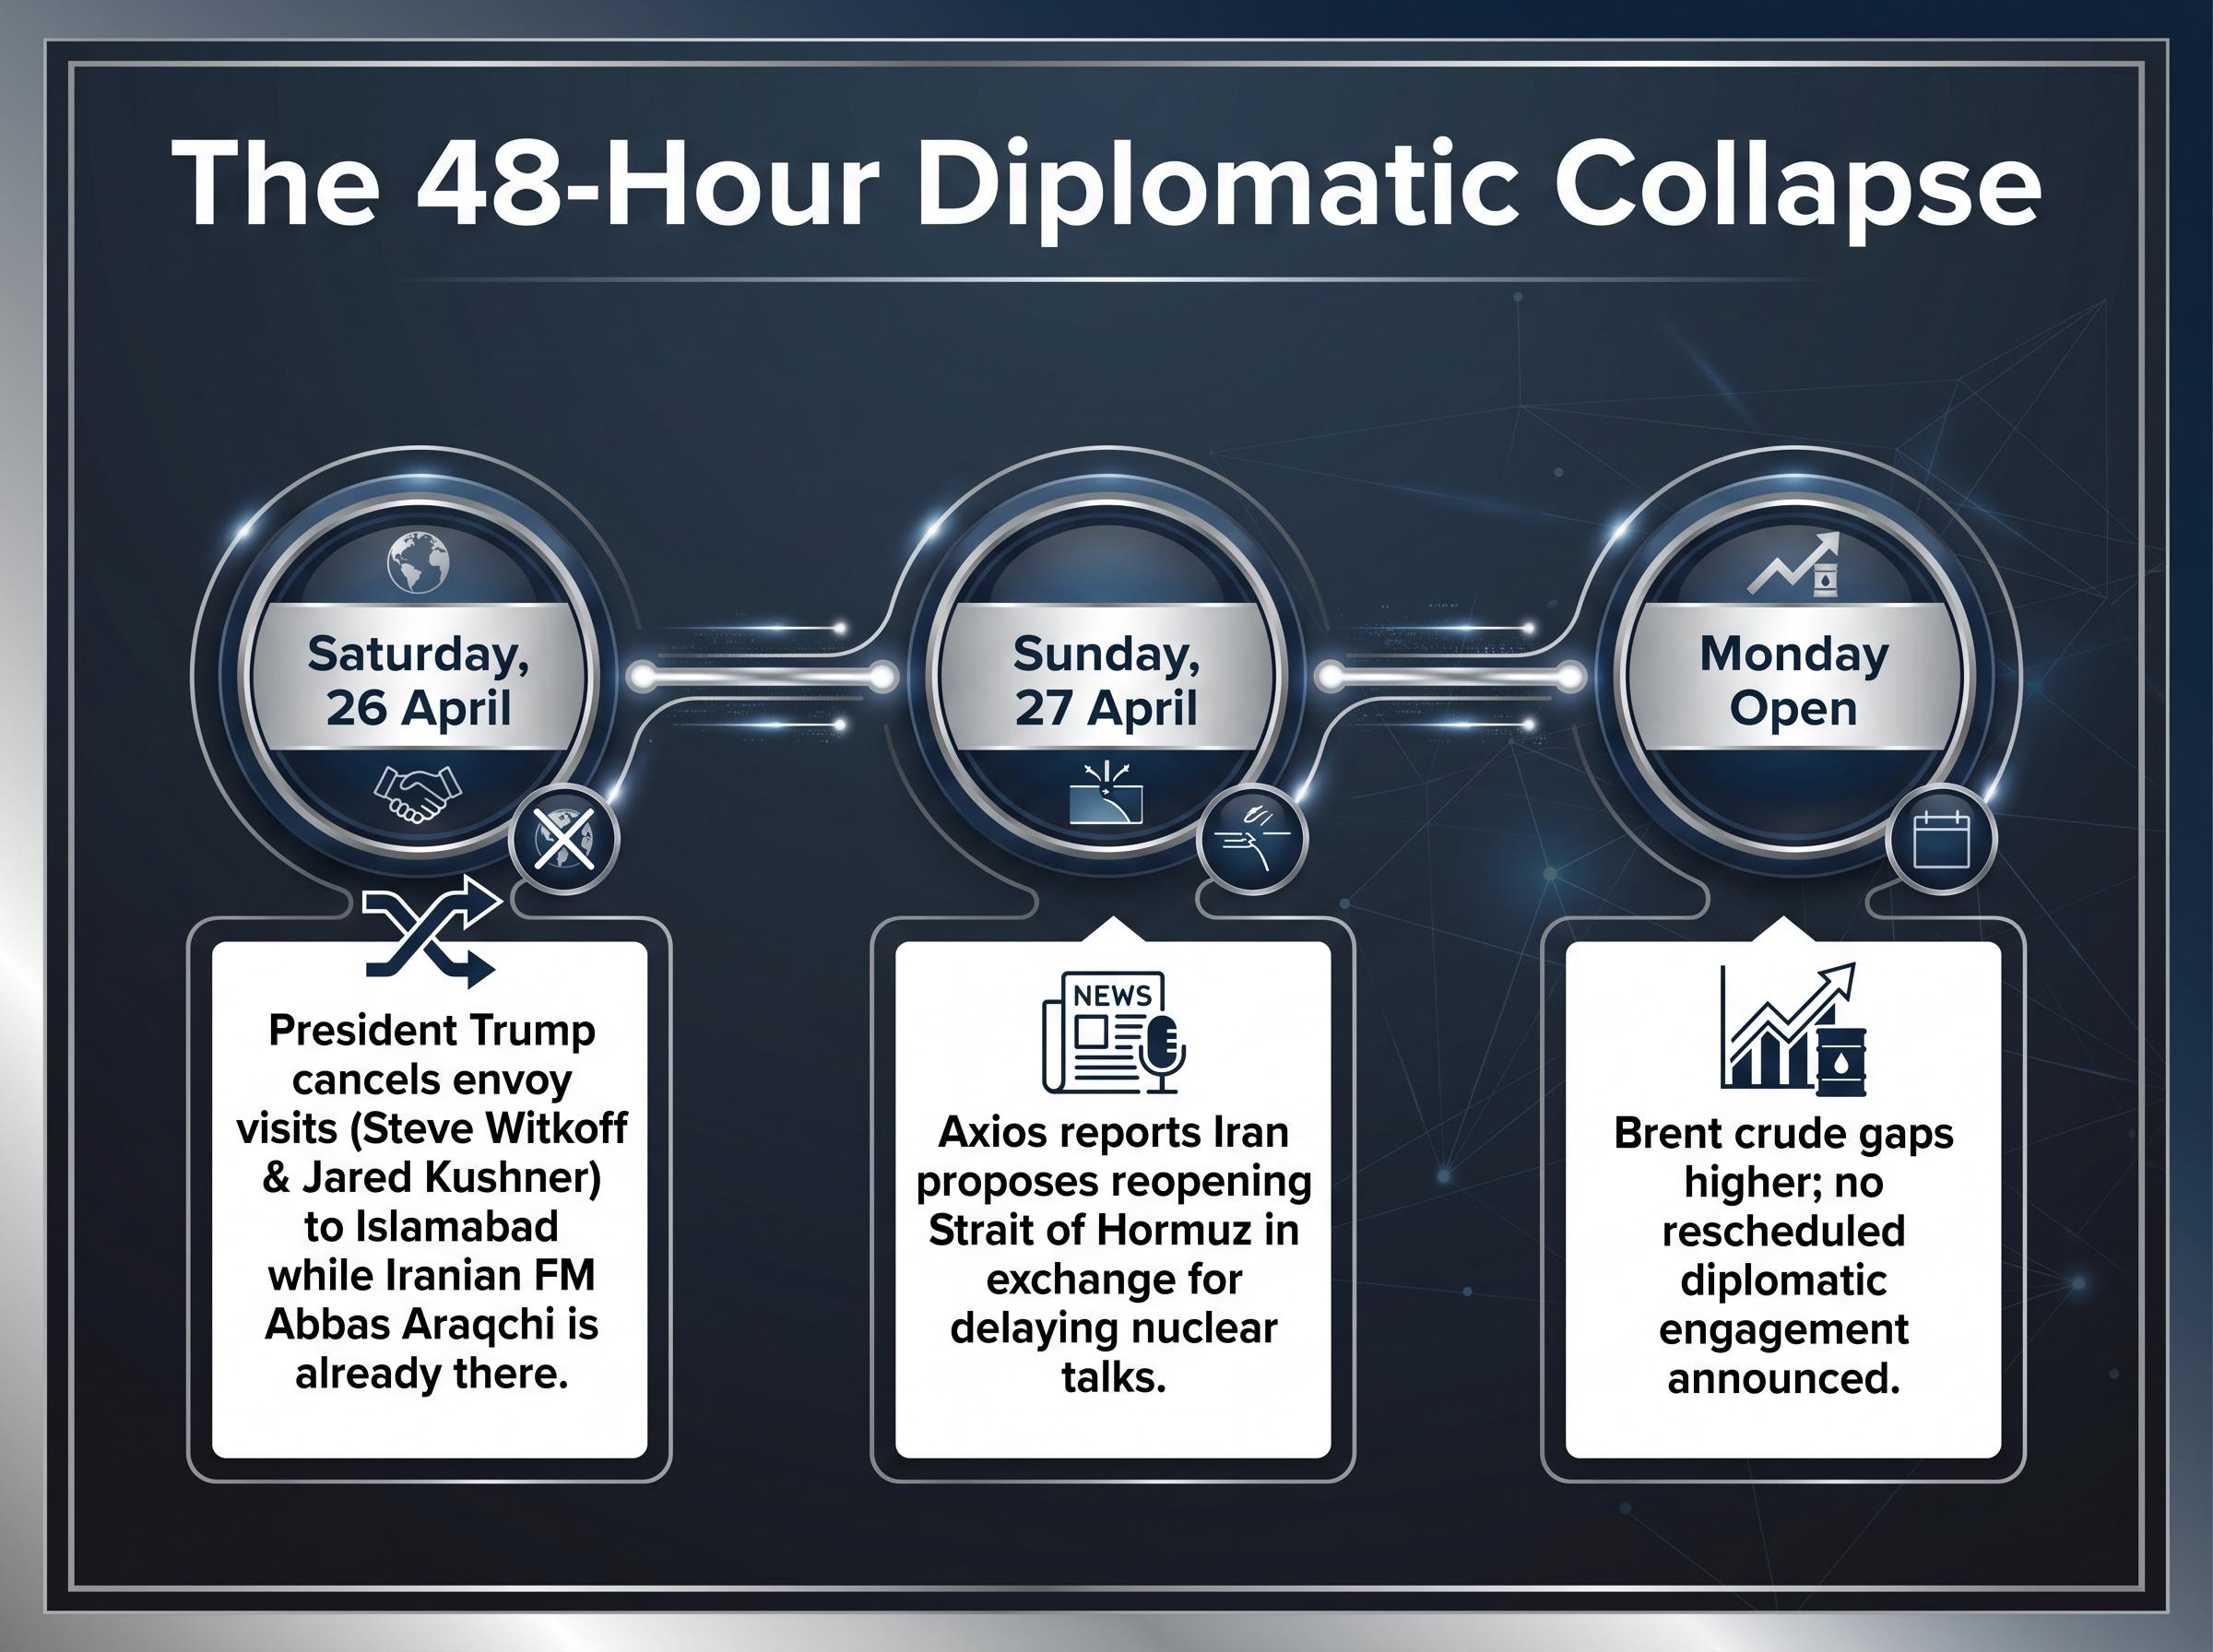
The timing dissonance was stark. Araqchi landed in Pakistan as the American delegation was pulled. The two sides were not merely failing to agree; they were no longer in the same room.
Goldman Sachs analyst Rich Privorotsky noted that Tehran’s proposal could theoretically give Washington an exit option, but only if it resolved operational control of the Strait’s shipping lanes. It did not. Iran offered to reopen the waterway while retaining the physical capacity to close it again, a condition that made the offer structurally weak from any credibility standpoint.
The credibility problem deepened further when Friday’s announcement of a full Strait reopening, initially backed by Trump, reversed within 24 hours. Goldman cited this reversal as evidence of uncoordinated Iranian decision-making and maintained its scepticism that de-escalation could hold given the unprecedented scale of the supply shock.
Five ships. That was the total transit through the Strait of Hormuz in the 24-hour window spanning 24-26 April 2026. One of those was an Iranian oil products tanker. The rest of the world’s energy trade through the most important chokepoint on the planet had effectively stopped.
The five-ship transit figure on 24-26 April is severe, but the precedent was set earlier when zero commercial tanker transits recorded on 19 April following the U.S. Navy seizure of the Iranian cargo vessel Touska, reversing a brief reopening that had seen more than 20 vessels pass through on 18 April.
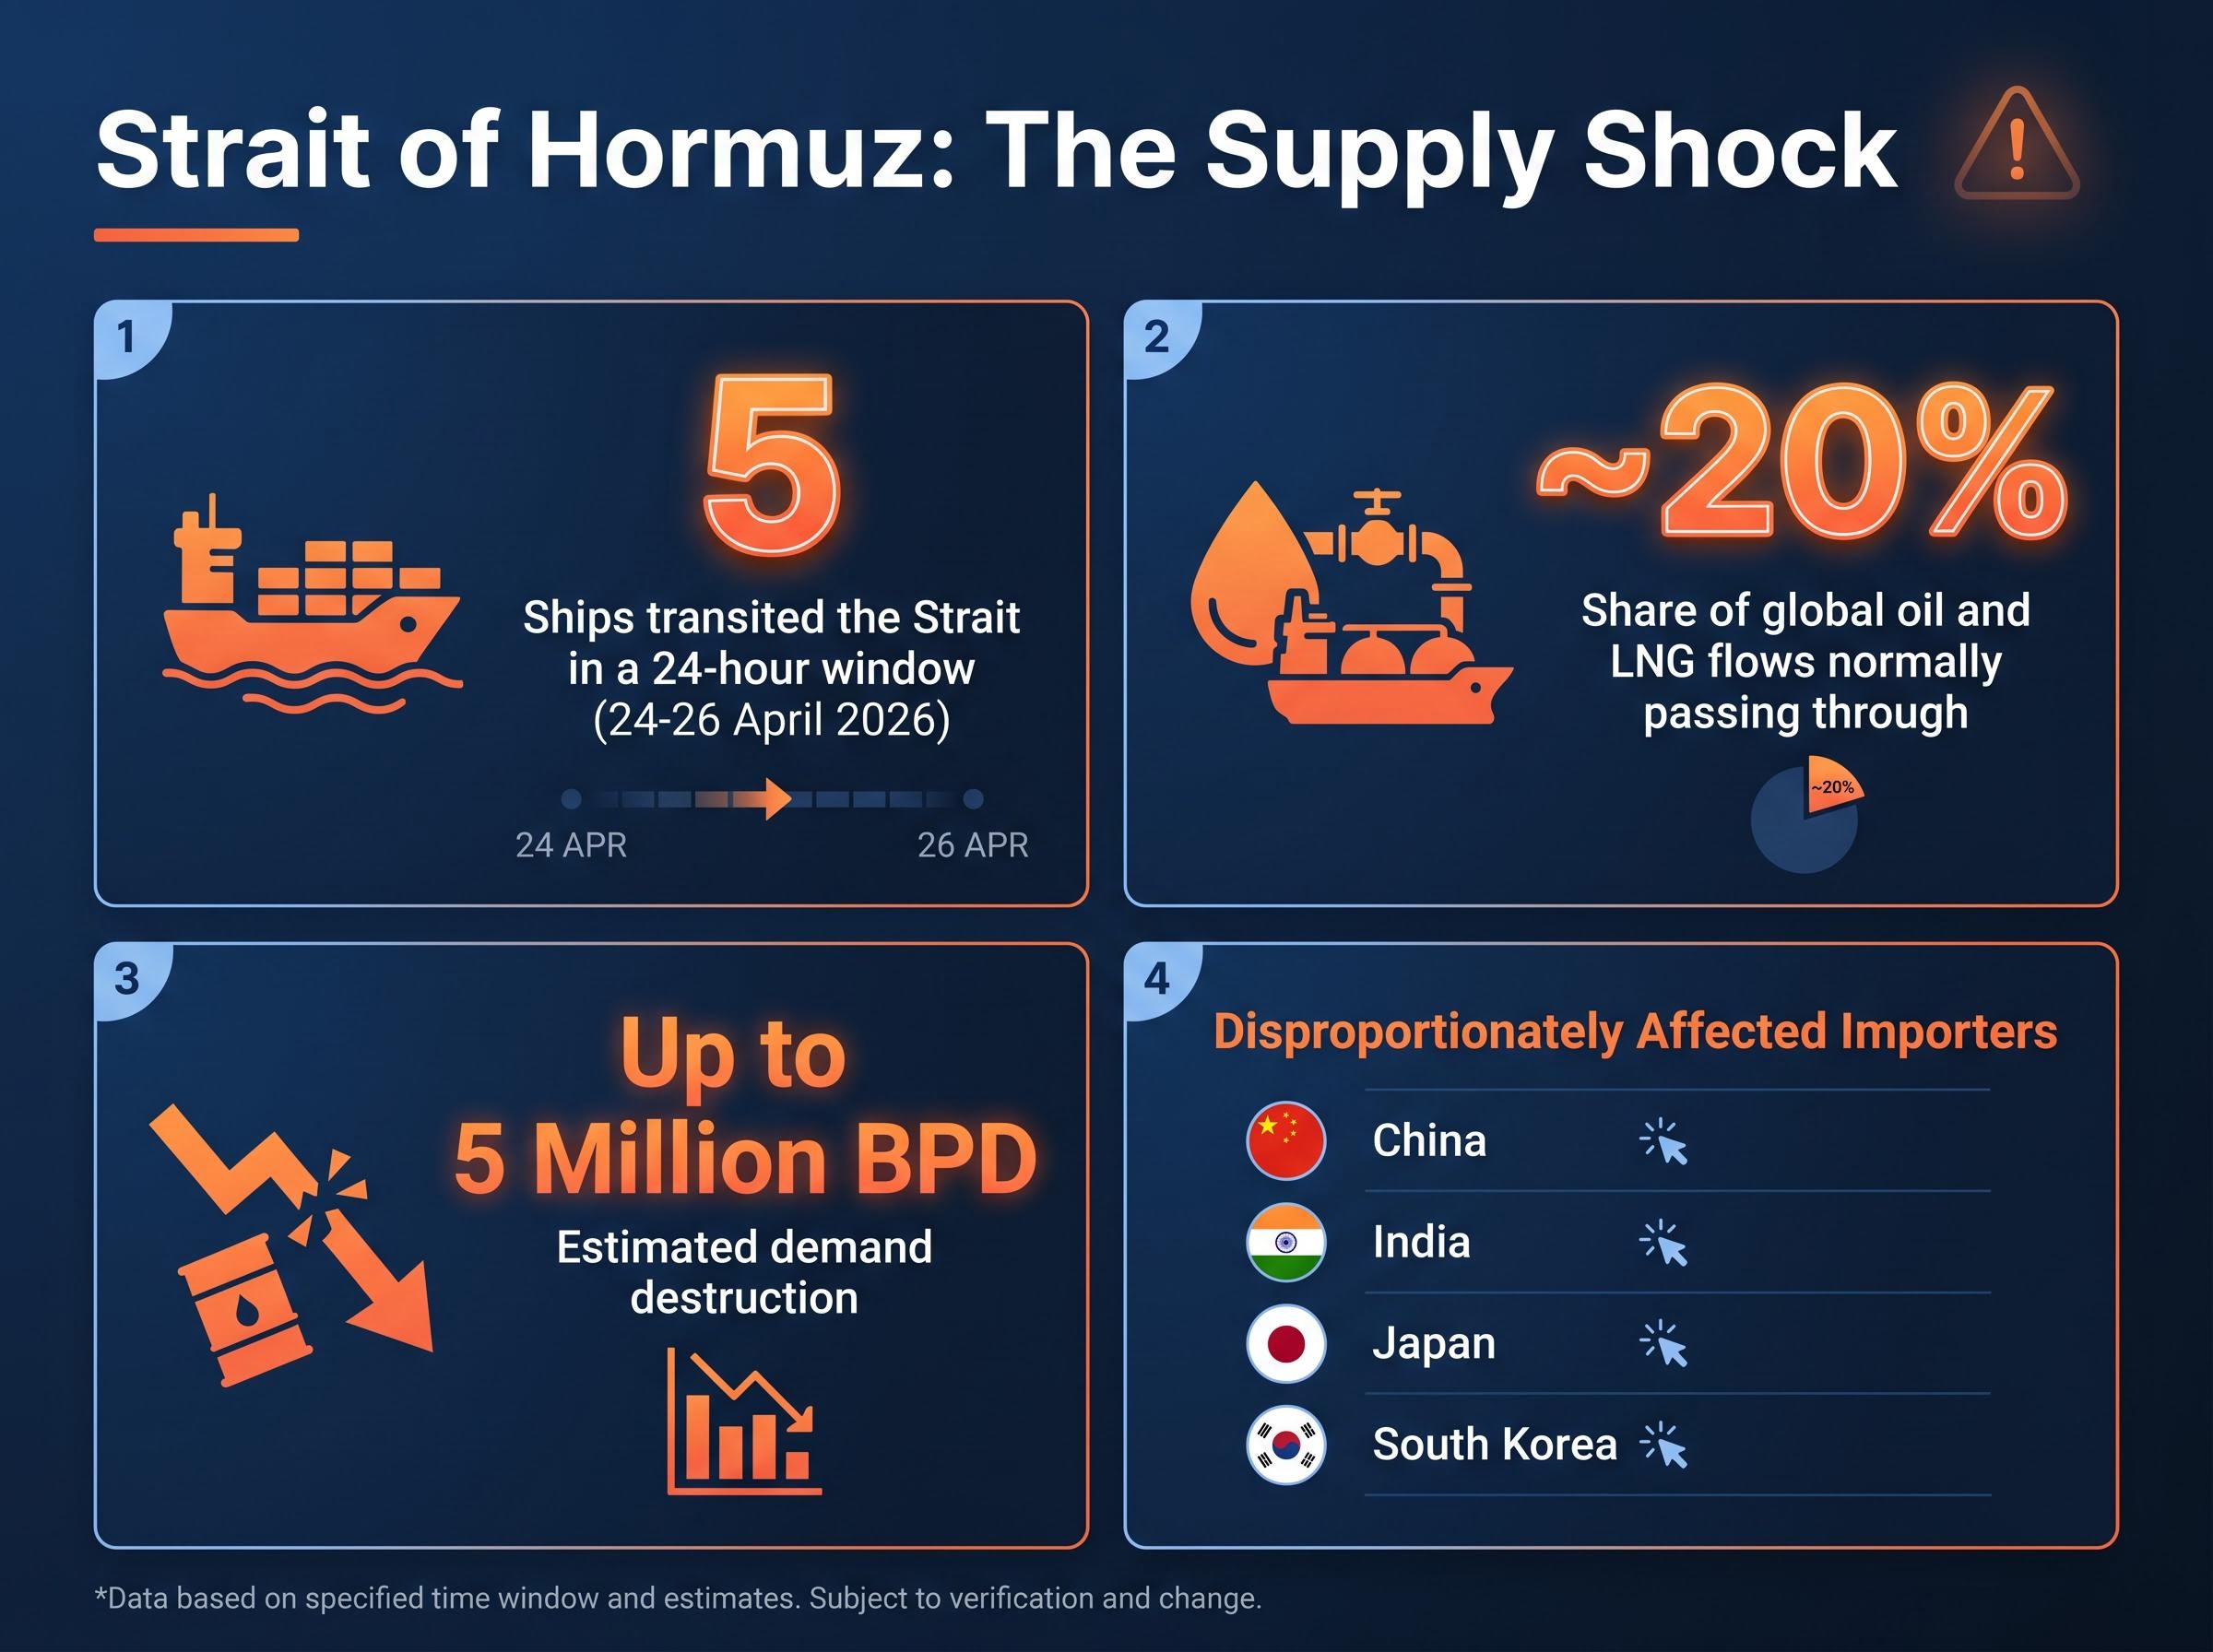
Approximately 20% of global oil and liquefied natural gas (LNG) flows through the Strait under normal conditions. The closure falls disproportionately on Asian importers: China, India, Japan, and South Korea bear the concentrated weight of lost supply, with demand destruction estimates reaching up to 5 million barrels per day.
| Metric | Figure | Implication |
|---|---|---|
| Strait daily transits (24-hr window) | 5 ships | Near-total shutdown of normal traffic |
| Share of global oil and LNG flows | ~20% | Disproportionate impact on Asian importers |
| Demand destruction estimate | Up to 5 million bpd | Concentrated in China, India, Japan, South Korea |
| Iran storage risk | Capacity limits approaching | Potential forced oilfield closures deepening supply shock |
The constraint extends beyond tanker counts. IG analyst Tony Sycamore warned that Iran itself may be forced to close aging oilfields because domestic storage capacity is running out, a consequence that would deepen the supply shock independently of any diplomatic outcome.
“The clock is ticking loudly,” Sycamore said, noting that Iran’s storage constraints could force production shutdowns that outlast any future ceasefire.
Both the U.S. naval blockade and Iran’s closure posture remain in place. The physical standoff means supply recovery requires not just a diplomatic announcement but the withdrawal of military assets from both sides.
The crude numbers are the starting point, not the full picture. What matters is how the price spike transmits through the economy in layers that compound.
Brent crude settled at approximately $105.07 per barrel on 27 April 2026, a weekly gain of roughly 17%. West Texas Intermediate (WTI) reached approximately $96.07 per barrel, up about 13% over the same week. The Brent premium over WTI has normalised, consistent with a global supply shock centred outside the United States.
| Asset | Level (27 April) | Move |
|---|---|---|
| Brent crude | ~$105.07/bbl | +~17% weekly |
| WTI crude | ~$96.07/bbl | +~13% weekly |
| National avg. gasoline | $4.15/gallon | +12% weekly |
| XLE ETF | $98.50 | +~2.5% |
| S&P 500 futures | Early Asia session | -~0.3% |
| VIX | 19.16 | +2.41% |
The national average retail gasoline price of $4.15 per gallon is the highest since 2022, with Midwest prices running above $4.30 per gallon.
That gasoline figure is where the oil shock meets household budgets directly. S&P 500 futures slipped approximately 0.3% in early Asia trading, and the VIX edged to 19.16, up 2.41%. The U.S. 10-year Treasury yield sat at approximately 4.321%. Broader indices had already been whipsawing on blockade headlines throughout the prior week.
For U.S. investors, the $100+ Brent threshold functions as a macro pressure point. It feeds inflation expectations, compresses consumer discretionary spending, and complicates the Federal Reserve’s rate-path calculus heading into a week where the Fed is scheduled to meet.
The Strait of Hormuz closure’s transmission into U.S. inflation operates through multiple compounding channels: gasoline prices feed directly into headline CPI, rising transport and logistics costs push up producer prices, and the Federal Reserve’s rate-path calculus shifts as energy-driven inflation erodes the 2% target credibility that would have supported cuts.
The surface numbers look straightforward. The XLE Energy Select Sector SPDR Fund climbed approximately 2.5% to $98.50 on 27 April 2026. The major integrated producers followed:
Both are benefiting from higher realised prices. The immediate read is positive for energy holders. The more nuanced read complicates that conclusion.
Stuart Kaiser at Citi observed that energy equities have surrendered most of their relative outperformance when measured against the two-year oil price comparison. The sector is now moving in close correlation with crude itself, meaning the premium investors were earning from energy names over the broader S&P 500 has largely evaporated. Owning energy stocks today requires a directional view on crude prices, not a bet on sector-specific dynamics.
The energy sector’s relative outperformance against the S&P 500 has a complicated recent history: XLE delivered a 38.2% total return in Q1 2026, but became the sole S&P 500 decliner in the week ending 13 April as ceasefire news briefly drove oil prices lower, illustrating how quickly the trade reverses when diplomatic signals shift.
The CBOE Crude Oil Volatility Index (OVX) measures implied volatility in crude oil options, functioning as the oil market’s equivalent of the VIX for equities. A higher OVX means options traders are pricing in larger expected price swings, and hedging through options becomes more expensive.
The OVX peaked at 121 on 11 March 2026 and has since declined to approximately 76-78. Citi characterised this decline as potentially making the OVX an attractive hedging instrument at current levels: options protection is cheaper than it was six weeks ago, even though the underlying supply risk has not resolved.
The index remains historically elevated, signalling that significant residual uncertainty persists. The decline from 121 to the high 70s reflects a partial normalisation of panic, not a resolution of the conditions that caused it.
The temptation at this point in the analysis is to pick a direction. The more useful approach is to identify the specific variables that would break the current trajectory either way.
Goldman Sachs raised its Q4 crude price forecasts, citing a “net upside risk to oil price” from ongoing shortages and elevated refined product costs.
The macro convergence for the week of 28-30 April compounds the uncertainty. The Federal Reserve’s rate decision arrives on 29 April (no change expected from the current 3.50%-3.75% target, and notably Jerome Powell’s final meeting as Fed Chair). Q1 GDP data is scheduled for Thursday, 30 April. And Alphabet, Amazon, Meta, and Microsoft all report earnings on Wednesday, any of which could interact with energy-driven volatility to amplify broader market moves.
Past performance does not guarantee future results. Financial projections are subject to market conditions and various risk factors.
The diplomatic collapse was not a gradual deterioration. It was a weekend event with immediate, measurable consequences across crude, gasoline, equities, and volatility. The absence of rescheduled talks means the supply risk premium is now embedded in prices for the foreseeable term, not as a tail risk but as a baseline assumption.
U.S. investors face a rare convergence this week: a geopolitical supply shock, a Federal Reserve decision, and four of the largest companies in the world reporting earnings, all unfolding in a market that sat at record highs just days ago. The single most important variable to monitor is the credibility of any Iran re-engagement signal. Goldman Sachs provided the analytical test: any proposal must resolve operational control of the Strait, not merely announce a reopening. Until that threshold is met, the current pricing regime holds.
For U.S. investors navigating the convergence of a supply shock, a Fed decision, and major earnings in a single week, our comprehensive walkthrough of investing strategies for the current volatility environment covers sector reallocation frameworks, the case for adding energy and gold exposure, why panic selling during geopolitical events consistently underperforms disciplined rebalancing, and a structured monitoring framework built around Fed policy, inflation data, and corporate earnings.
This article is for informational purposes only and should not be considered financial advice. Investors should conduct their own research and consult with financial professionals before making investment decisions.
US Iran oil prices surged because a planned diplomatic envoy visit to Islamabad was cancelled over a single weekend, eliminating the most plausible path to de-escalation and leaving a near-shutdown of the Strait of Hormuz as the baseline supply reality for global markets.
The Strait of Hormuz is a critical maritime chokepoint through which approximately 20% of global oil and liquefied natural gas flows under normal conditions; its near-closure has removed up to 5 million barrels per day from global supply, disproportionately affecting Asian importers like China, India, Japan, and South Korea.
The closure has pushed the national average retail gasoline price to $4.15 per gallon, the highest level since 2022, with Midwest prices running above $4.30 per gallon, directly impacting household budgets and feeding into headline inflation.
Goldman Sachs identified the key test: any credible de-escalation proposal must resolve operational control of the Strait of Hormuz, not merely announce a reopening; until that threshold is met, the supply risk premium remains embedded in prices as a baseline assumption rather than a tail risk.
The XLE Energy Select Sector SPDR Fund rose approximately 2.5% to $98.50 on 27 April 2026, with Exxon Mobil up roughly 1.8% and Chevron up roughly 2.1%, though Citi analysts note that energy equities are now moving in close correlation with crude itself, meaning investors need a directional view on oil prices rather than a sector-specific thesis.


