
How Hormuz Closure at $104 Oil Is Reshaping Every Asset Class
5 hrs ago

Four of the largest companies in the S&P 500 are set to report earnings on the same afternoon, and each is expected to post double-digit revenue growth. Yet their earnings-per-share figures tell a different story: nearly flat across the group, and in one case, an outright decline. That gap between top-line momentum and bottom-line compression is the defining tension of this earnings season, and it traces directly to how Alphabet, Meta, Amazon, and Microsoft are choosing to spend.
On 29 April 2026, these four companies report after market close in what amounts to the most consequential single session in the quarterly earnings calendar. Markets have recovered to record highs following a volatile start to the year shaped by AI equity rotation, elevated oil prices, and geopolitical uncertainty. Investors arrive at this week already primed to interrogate the relationship between AI capital expenditure and financial returns.
What follows is a framework for understanding why strong revenue growth is not translating into proportional shareholder returns, what each company’s spending strategy signals about its competitive positioning, and what the long-term payoff thesis actually rests on.
The numbers, placed side by side, surface the question before any analysis needs to.
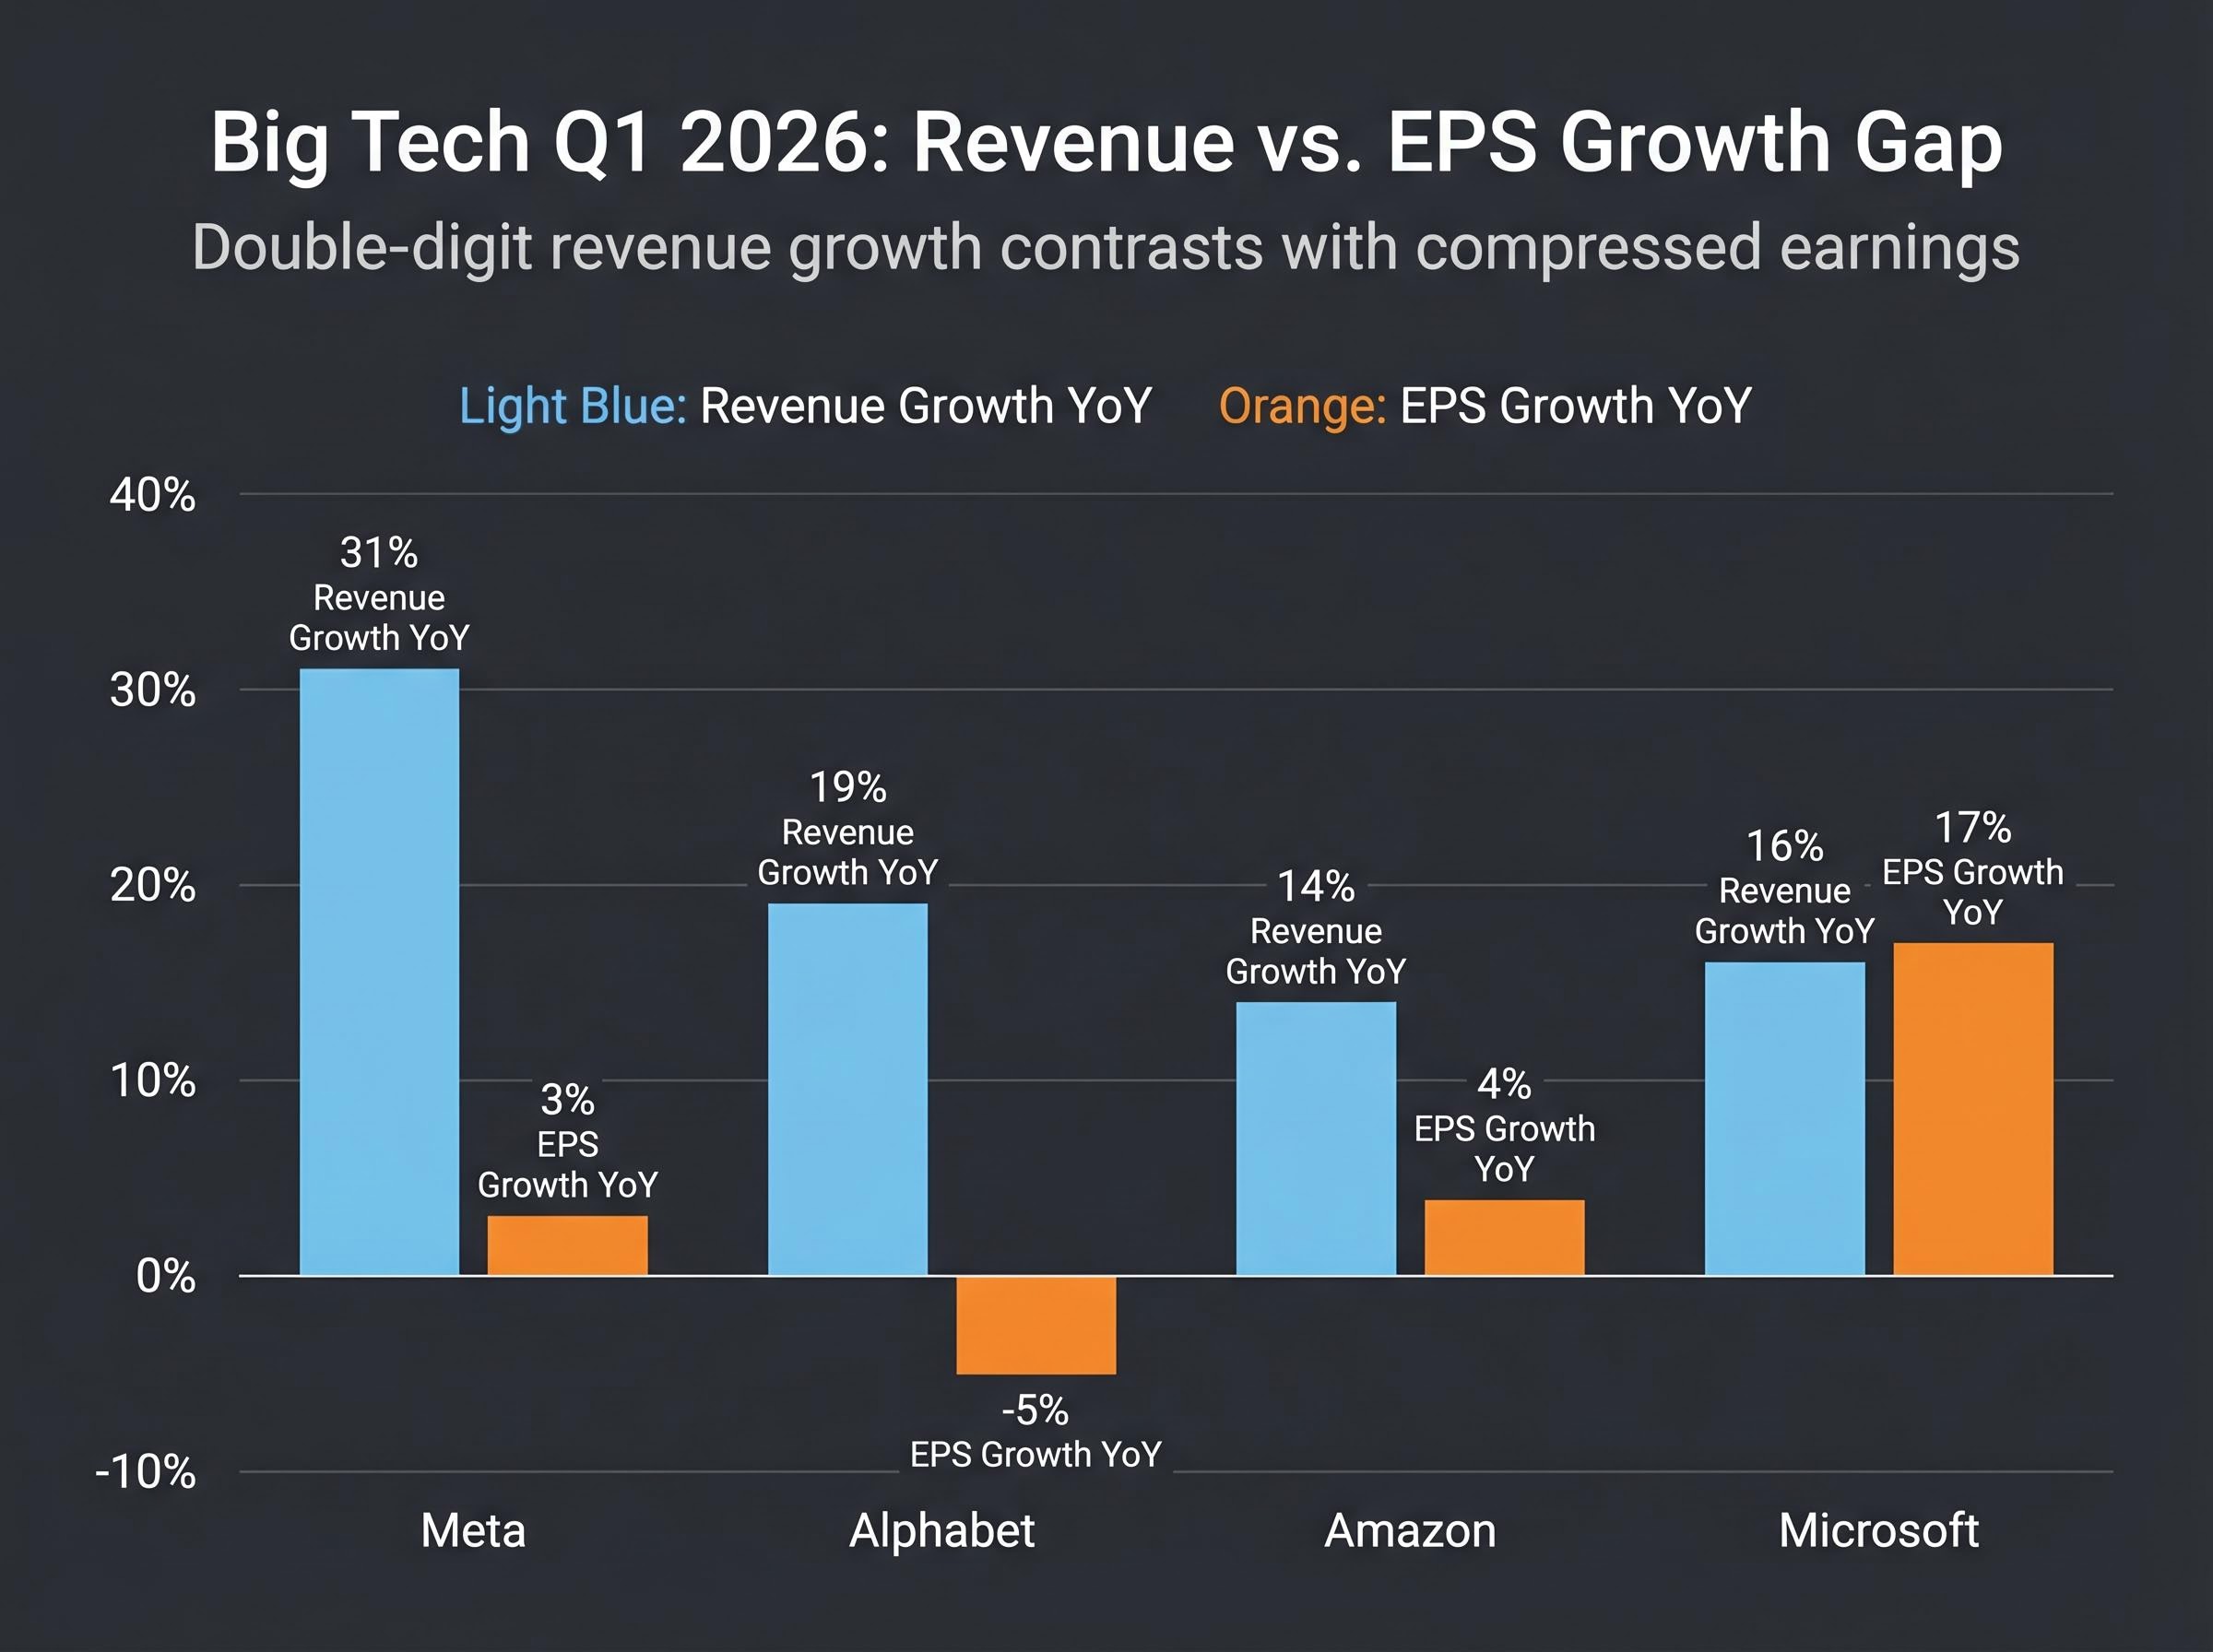
| Company | Q1 2026 Revenue Estimate | Revenue Growth YoY | EPS Estimate | EPS Growth YoY |
|---|---|---|---|---|
| Meta | $55.57 billion | 31% | $6.65 | 3% |
| Alphabet | $107 billion | 19% | $2.67 | -5% |
| Amazon | $177 billion | 14% | $1.65 | 4% |
| Microsoft | $81.4 billion | 16% | $4.06 | 17% |
Combined, these four names represent more than 18% of the S&P 500 by weighting. All four are growing revenue at double-digit rates. Three of the four are expected to deliver EPS growth in the low single digits or worse.
Alphabet offers the sharpest illustration: revenue up 19%, earnings per share down 5%. The top line is accelerating while the bottom line contracts.
This is not a failure of execution. It is a structural condition, the direct financial consequence of capital expenditure decisions made deliberately at the executive level. The divergence is not isolated to one business model or one competitive dynamic. It runs across the entire cohort, and that is what makes it analytically significant. Microsoft, projecting 17% EPS growth, stands as the outlier, a data point worth interrogating separately.
The broader concern underpinning all four companies’ spending decisions is AI capital expenditure ROI uncertainty: consensus hyperscaler capex has already reached hundreds of billions of dollars, yet no major provider has announced a credible path to proportionate returns at the scale of investment currently being made.
The combined AI infrastructure spending projected for these four companies in 2026 falls in the range of $635-665 billion. That figure is abstract at headline level. At the company level, it becomes concrete.
| Company | 2026 Capex Guidance | Primary Allocation Focus |
|---|---|---|
| Amazon | ~$200 billion | AWS AI workloads, data centre expansion |
| Alphabet | $175-185 billion | Gemini, Vertex AI, Google Cloud, Broadcom TPU partnership |
| Meta | $115-135 billion | Llama models, AI advertising infrastructure |
| Microsoft | ~$90-120 billion | Azure, OpenAI partnership, Copilot |
The physical assets absorbing this capital share common categories across all four companies:
Meta’s spending escalation is the steepest in percentage terms: $115-135 billion for 2026, up from $72 billion in 2025, representing a 60-88% increase. CEO Andy Jassy at Amazon has noted that customer commitments cover nearly the entirety of the company’s planned $200 billion capex, a framing designed to pre-empt the overbuilding concern. Alphabet has locked in a new five-year TPU development agreement with Broadcom, signalling that the spending horizon extends well beyond a single fiscal year.
These are not speculative allocations. Management teams across the group have framed the spending as demand-driven, characterising their infrastructure positions as behind capacity rather than ahead of it.
The mechanics that produce the revenue-earnings divergence are structural, not mysterious. Capital expenditure flows through the income statement in three stages:
The result: today’s record capex does not fully hit this quarter’s earnings. Instead, it creates a rolling depreciation burden that accumulates as each successive investment cycle layers onto the last. Elevated depreciation from prior spending cycles is now running through the profit and loss simultaneously with new commitments, compounding the drag on reported earnings even as revenue accelerates.
Meta CFO Susan Li noted on the 28 January 2026 earnings call that compute demand exceeds supply, with capacity constraints expected through much of 2026. GPUs, she indicated, are generating advertising revenue within weeks of deployment.
The evidence that spending is translating into revenue is uneven but real. Amazon’s AI chip division has reached an annualised revenue run rate of $50 billion, growing at more than 100% per year according to CEO Jassy’s commentary. Google Cloud grew 48% year on year to $17.7 billion in Q4 2025, providing a benchmark for cloud monetisation velocity. Microsoft Cloud revenue reached $51.5 billion in fiscal Q2 2026.
Microsoft is the cohort outlier in a meaningful sense: its projected 17% EPS growth suggests that Copilot monetisation and Azure AI services are already flowing through the income statement more efficiently than at peers. Bloomberg reported that Copilot paid conversion met ambitious internal benchmarks last quarter.
Not all of the spending maps to near-term AI monetisation. Alphabet’s potential $40 billion additional investment in Anthropic (in which it holds a 14% ownership stake) represents a bet whose payoff is entirely future-dated. Amazon’s $10.8 billion acquisition of Globalstar targets a satellite service with a projected 2028 launch, illustrating that portions of the capex envelope serve strategic objectives beyond this year’s AI revenue.
The four companies share a common structural dynamic, but the risk profiles and monetisation timelines diverge in ways that matter for anyone evaluating individual positions.
The structural difference in business models matters too. Meta and Alphabet are primarily monetising AI through advertising yield improvement: better targeting, higher click-through rates, and more efficient ad delivery. Amazon and Microsoft are monetising through cloud infrastructure rental and enterprise software subscriptions, a model where utilisation rates and seat counts determine the speed of returns.
Large-scale technology infrastructure investments have historically followed a recognisable multi-year pattern. The current AI spending cycle fits this framework, though the pace appears to be compressing.
The cycle moves through three phases:
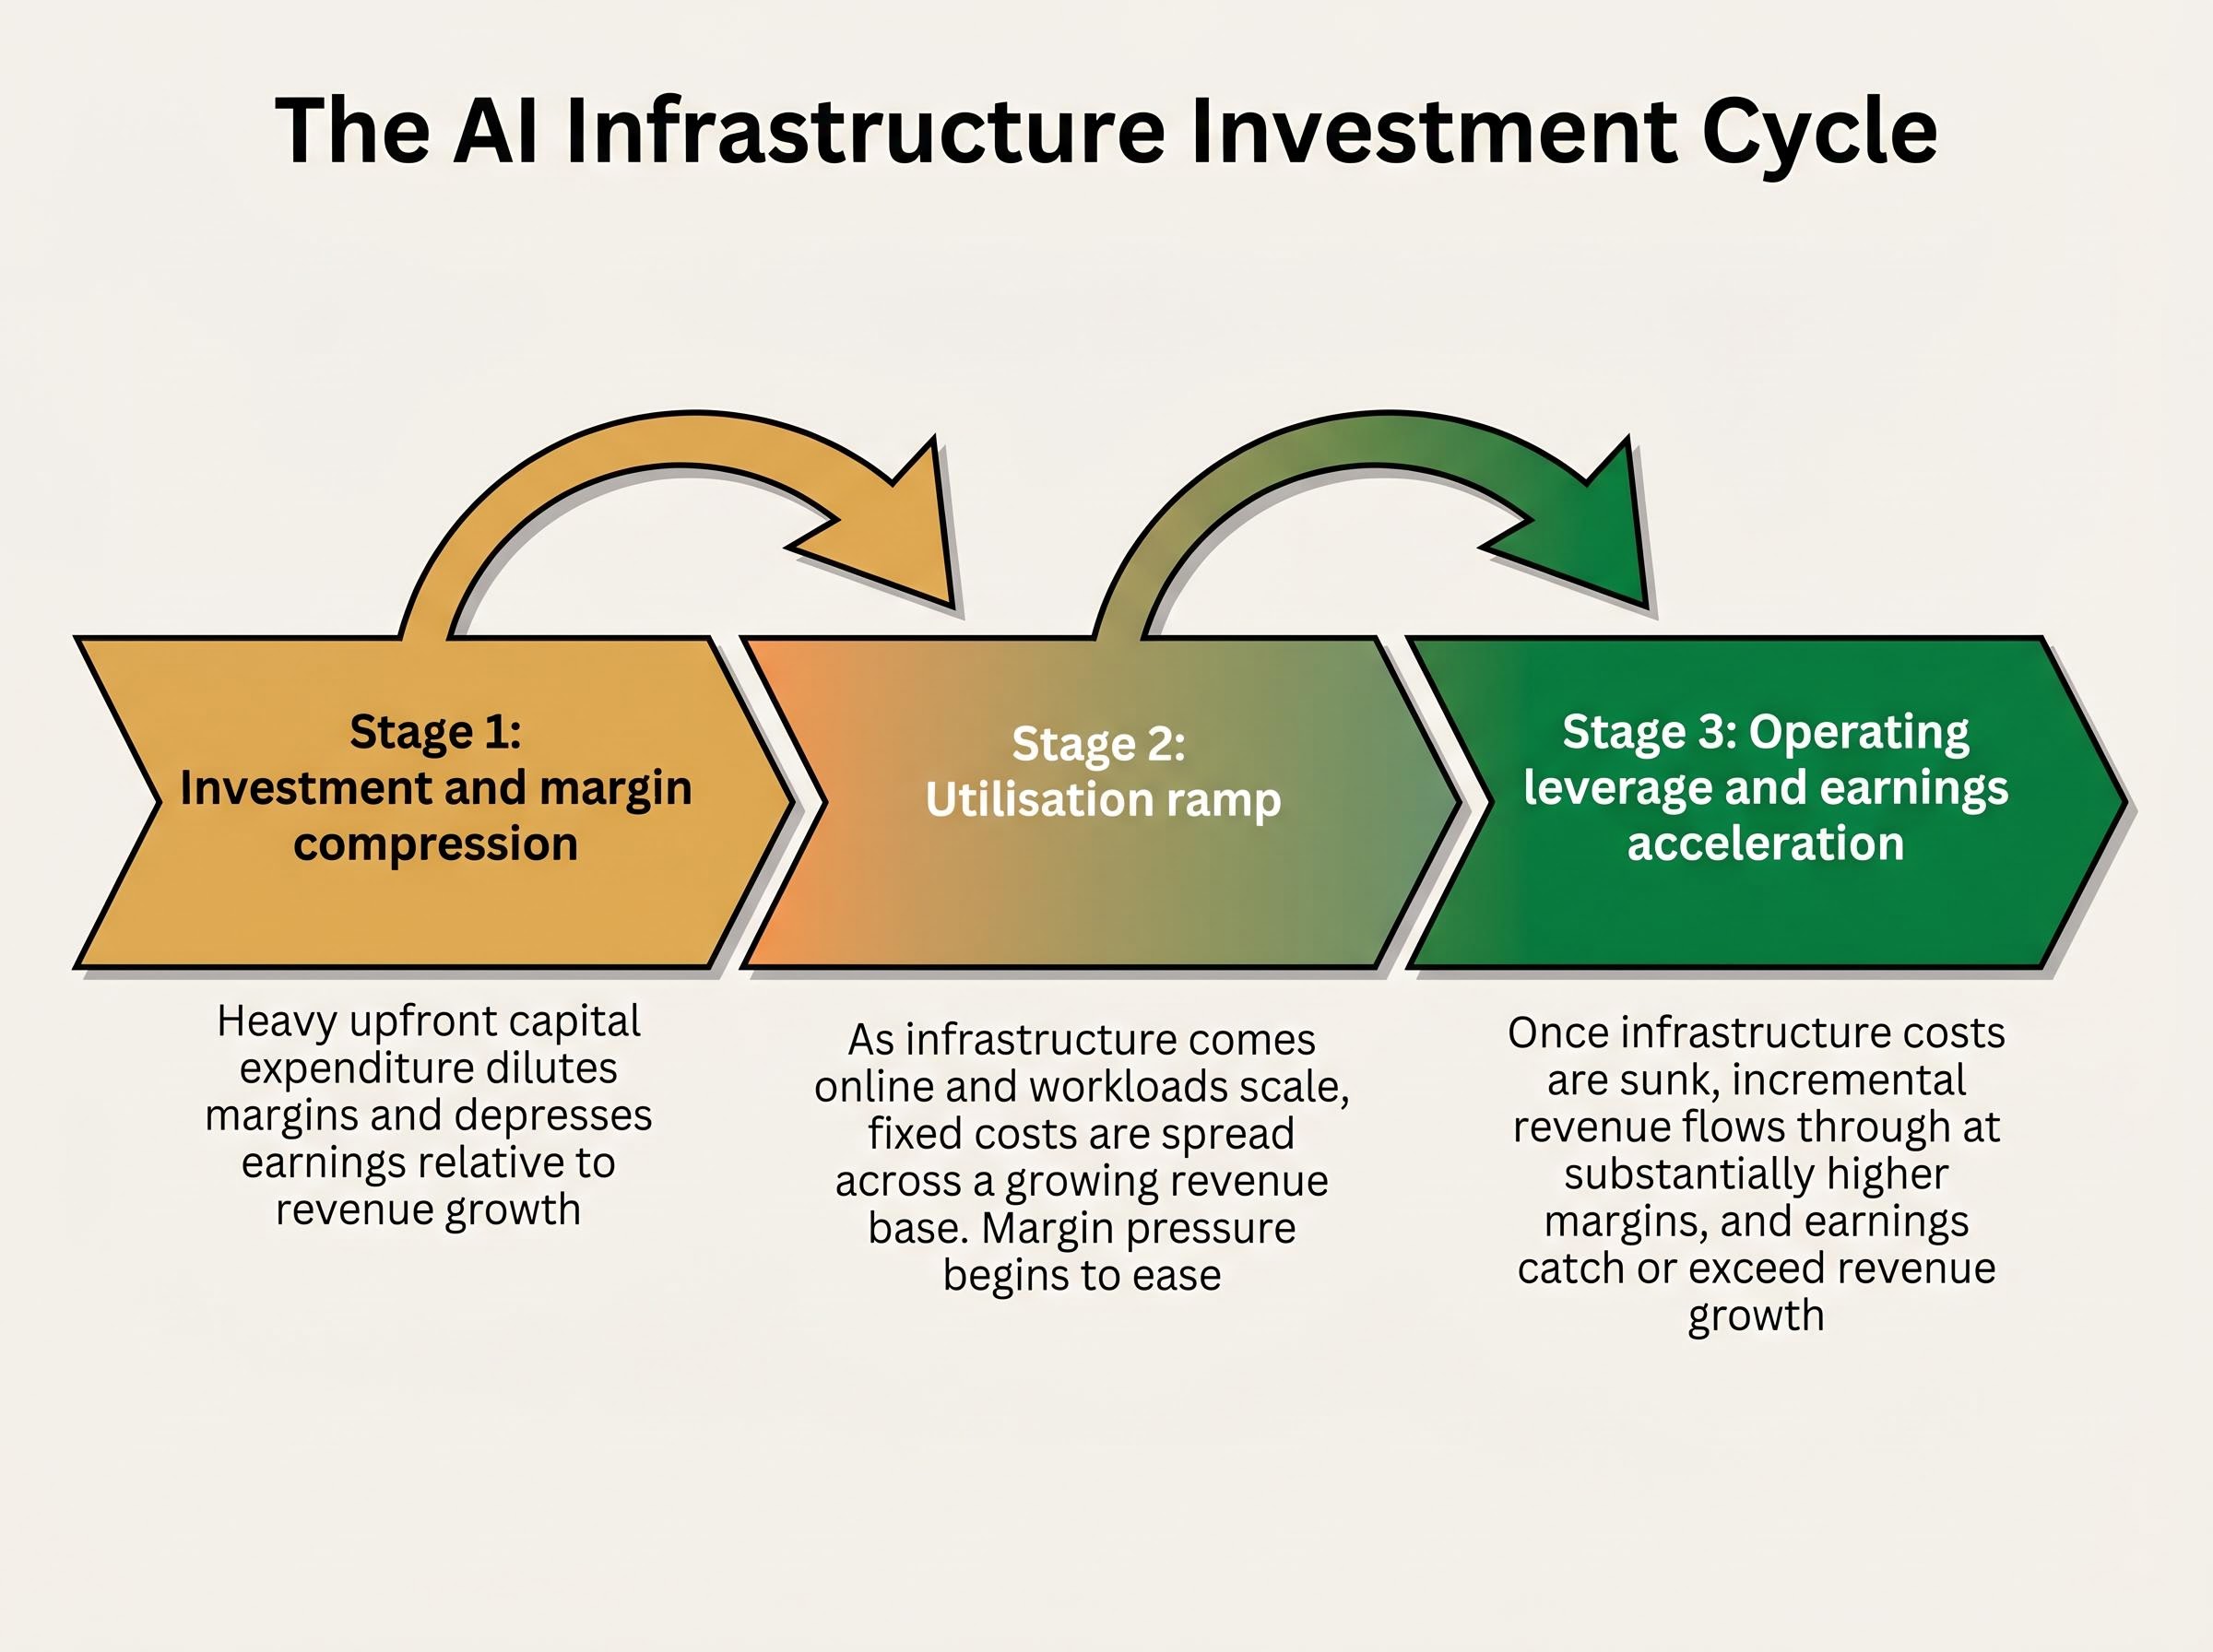
The parallel to the cloud buildout of the early 2010s is instructive without being exact. AWS spent years as a margin-dilutive segment within Amazon before becoming the company’s most profitable division. The current AI capex cycle appears to be moving faster: Meta’s disclosure that GPUs generate advertising revenue within weeks of deployment compresses the timeline between phases one and two relative to prior infrastructure buildouts. Amazon’s $50 billion AI chip run rate, growing at more than 100% year on year, suggests utilisation is already ramping at scale.
Shai Luft of Bench Media has framed the spending calculus this way: current AI investment represents roughly 15-20% of revenue, and the risk of under-investing, given the potential disruption to core search, cloud, and advertising businesses, may exceed the risk of over-investing.
The question for investors is not whether the cycle will play out, but where in the cycle each company currently sits, and how quickly phase two transitions into phase three.
Societe Generale has warned that the investment cycle carries a cash flow consequence most investors have not fully priced: hyperscaler free cash flow turning negative by late 2026 before recovering in Q1 2027, a trajectory that would put further pressure on reported earnings even as AI revenue begins to ramp.
Four categories of data will determine whether the AI investment thesis is tracking or under pressure:
Beyond the numbers, guidance language carries weight. Investors should monitor whether companies maintain, raise, or hedge their capex commitments in light of tariff policy developments and broader market volatility during Q1 2026.
Any new AI revenue run-rate disclosures, following Amazon’s precedent of quantifying its AI chip business at $50 billion annualised, would provide the kind of concrete monetisation evidence the market is looking for. Management tone on demand conditions relative to supply constraints, particularly whether capacity remains the binding limitation, will indicate whether the spending trajectory is intact.
The S&P 500 and Nasdaq sit at record highs as of late April 2026. Expectations are elevated, which raises the bar for a positive market reaction even if headline numbers land in line with consensus.
JPMorgan has explicitly warned investors about options market implied moves this earnings week, with the signal reflecting expected magnitude of price swings rather than direction; the VIX closed at 19.31 on 23 April 2026, and a geopolitical risk premium tied to oil price pressure is amplifying those moves beyond what earnings uncertainty alone would generate.
The tension between record revenue growth and compressed earnings across Alphabet, Meta, Amazon, and Microsoft is not a sign of strategic failure. It is the visible cost of an infrastructure bet that management teams at all four companies have concluded they cannot afford not to make. The alternative, ceding AI infrastructure dominance to a competitor, is assessed as the more dangerous outcome.
The genuine uncertainty remains: the investment thesis rests on utilisation ramps and operating leverage that have not yet fully materialised in reported numbers. Microsoft, with its projected 17% EPS growth, offers the clearest current evidence that the cycle can compress and deliver earnings simultaneously. The other three are at earlier stages of the same curve.
29 April will not resolve the question of whether $635-665 billion in combined AI infrastructure spending was the right call. But it will provide the first 2026 data points on monetisation velocity, capex conviction, and management confidence in the demand trajectory, all inputs to a multi-year thesis playing out in real time.
The metrics that matter most are those that speak to where each company sits in the infrastructure investment cycle, not the headline EPS number that has already been telegraphed as subdued.
For investors who want to stress-test the bullish infrastructure thesis further, our deep-dive into Hussman’s debt-dependency argument for AI valuations examines how over $38 trillion in federal debt and more than $2.5 trillion in corporate debt maturing before 2027 could compress AI sector margins independently of whether the infrastructure investment itself proves commercially sound.
This article is for informational purposes only and should not be considered financial advice. Investors should conduct their own research and consult with financial professionals before making investment decisions. Past performance does not guarantee future results. Financial projections are subject to market conditions and various risk factors.
The gap is caused by record capital expenditure on AI infrastructure. Spending is capitalised as fixed assets and then depreciated over several years, so accumulated depreciation charges from successive investment cycles compress reported earnings even as revenue accelerates.
The four companies have a combined projected capex of $635-665 billion for 2026, with Amazon leading at roughly $200 billion, followed by Alphabet at $175-185 billion, Meta at $115-135 billion, and Microsoft at $90-120 billion.
Microsoft is the clear outlier, projecting 17% EPS growth versus near-flat or negative growth at the other three, driven by Copilot paid conversion and Azure AI services already flowing through its income statement.
Investors should focus on capex guidance reaffirmation, cloud growth rates for Google Cloud, AWS, and Azure, any new AI-attributed revenue disclosures, and management commentary on whether capacity constraints remain the binding limitation on AI monetisation.
Management teams at all four companies have characterised their spending as demand-driven rather than speculative; Amazon's CEO noted that customer commitments cover nearly all of the company's planned $200 billion capex, and Meta's CFO stated that GPUs are generating advertising revenue within weeks of deployment.


