
Investors making portfolio decisions about Australian bank shares have been operating on a flawed premise: that a higher Reserve Bank of Australia cash rate is good for bank earnings. The data from FY26 and the third quarter of 2026 says otherwise.
All four majors now expect the RBA to hold at 4.35% through the end of 2026, with cuts pencilled in for 2027. That consensus shift reframes the entire investment thesis that has propped up elevated bank valuations this year. And the earnings from Commonwealth Bank, Westpac, NAB, and ANZ confirm the high-rate environment has not delivered the margin expansion many buyers anticipated.
What follows maps the actual numbers against the assumptions, so you can make a more informed call on where the four banks sit in your portfolio. After reading, you will know where margins stand across each major, which banks are priced for perfection and which offer more realistic entry points, and what the rate plateau means for income versus growth positioning.
The rate outlook has flipped: what the new RBA consensus means for bank investors
The forecasting reversal happened quietly, and if you built a position on the old view, it happened beneath you.
Not long ago the four majors were positioned for another hike. Westpac’s chief economist had penciled in an August rise, and NAB carried a similar expectation. The RBA’s February 2026 Statement on Monetary Policy leaned on market pricing that implied around 60 basis points of further tightening. The direction of travel looked upward.
That view has now collapsed. Following a softer inflation print, Westpac’s chief economist reversed the August hike call, and NAB dropped its own hike expectation, flagging that the next move would be down. All four majors now expect the RBA to leave the cash rate at 4.35% for the rest of 2026, with easing beginning next year.
Here is where each bank now sits:
- CBA: two 25 basis point cuts, in May and August 2027
- ANZ: 50 basis points of easing across the second half of 2027
- Westpac: reversed its prior August hike call after softer inflation data
- NAB: dropped its August hike expectation, next move expected down
The RBA itself has not signalled cuts. At its meeting on 11 August 2026, the Monetary Policy Board unanimously held at 4.35%, and the language was pointedly hawkish.
The RBA’s August 2026 monetary policy decision confirmed the Board discussed only whether to hike or hold, with no rate cut deliberation, and explicitly flagged that further tightening remained possible if upside inflation risks materialised.
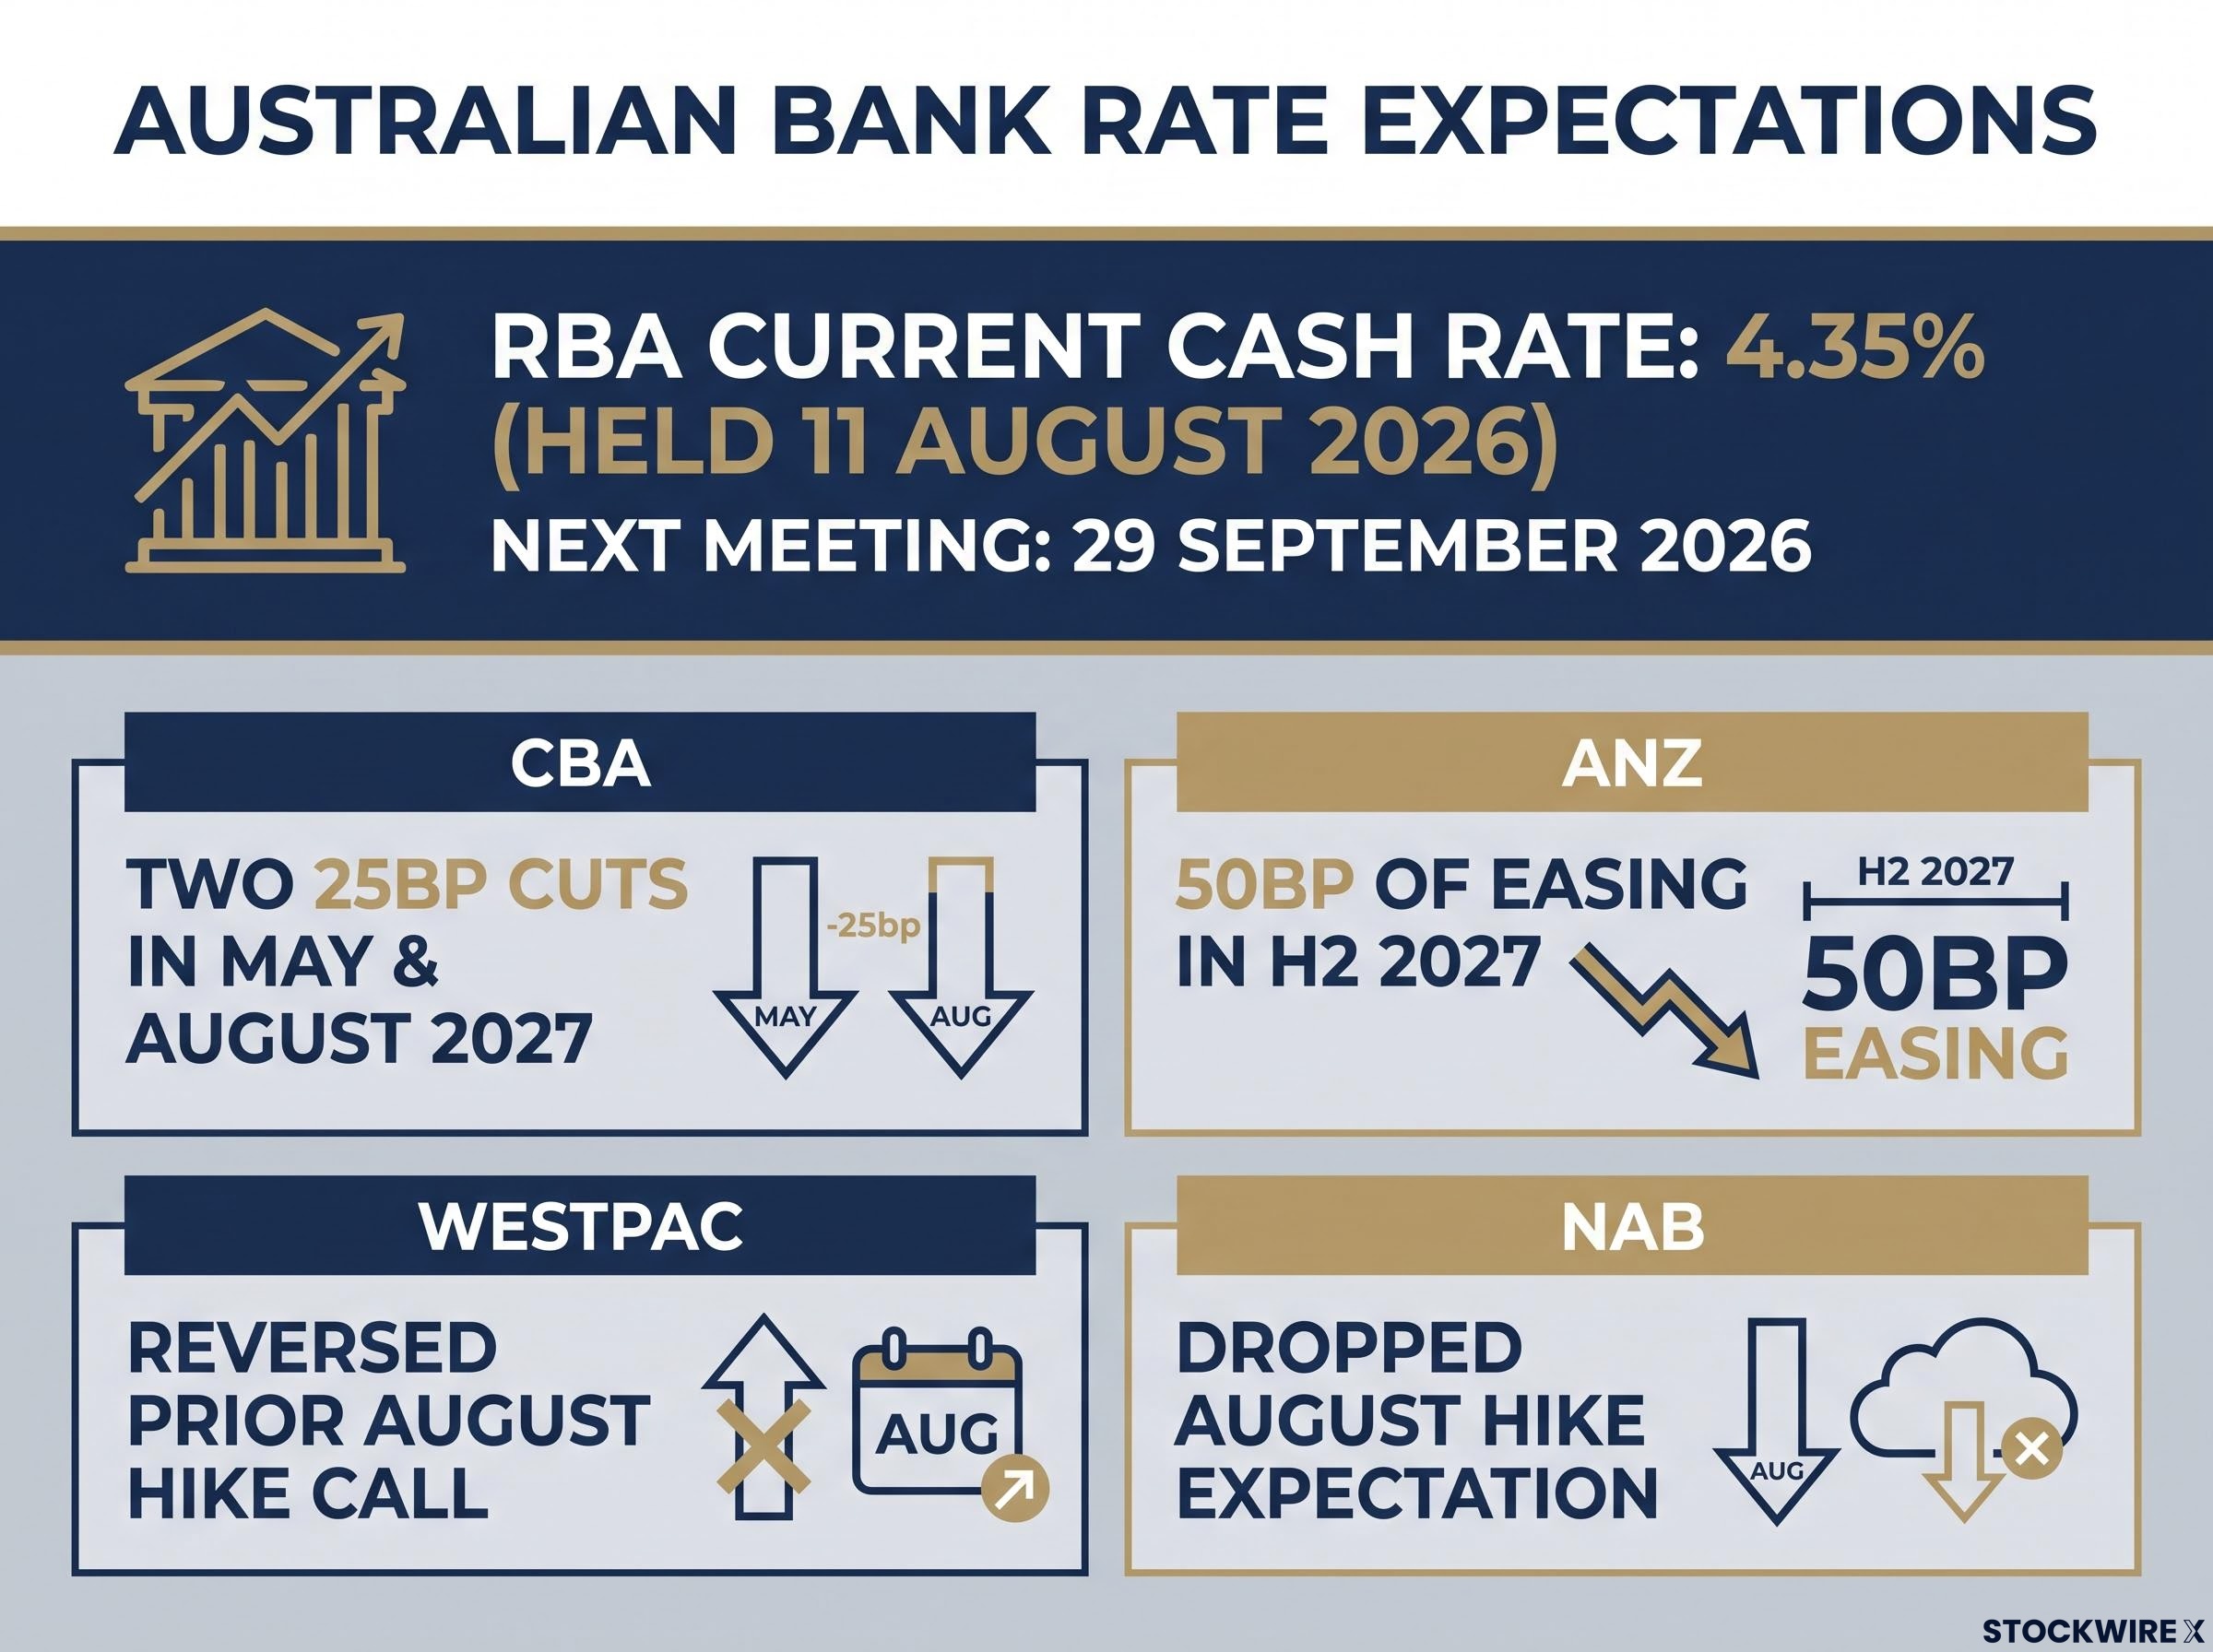
The Board did not discuss rate cuts, only whether to hike or hold. The pause allows more time to assess economic conditions, with further tightening described as “quite possible” if inflation does not moderate.
That gap between the banks’ forecasts and the RBA’s tone matters. If you bought bank shares expecting margin-boosting rate rises, the macro tailwind you anticipated has been replaced by a plateau, then cuts. Rate expectations drive bank valuations more than almost any other single variable, and the four majors themselves no longer see a hike coming. The next decision lands on 29 September 2026.
RBA forward guidance language has moved markets independently of any rate change throughout 2026; the June and August holds both demonstrated that the wording of Bullock’s statement, not the decision itself, is what reprices bond yields, the AUD, and rate-sensitive equities within the same trading session.
When big ASX news breaks, our subscribers know first
Why higher rates have not expanded margins: the NIM paradox explained
Here is the part that trips up most investors. In one of the highest cash rate environments in more than a decade, net interest margins across the Big Four are flat to mildly compressed against FY25.
Net interest margin, or NIM, is the gap between what a bank earns on its loans and what it pays on its deposits and other funding. Higher rates should widen that gap. The theory is clean. The results are not.
The three core ASX bank valuation metrics, NIM, ROE, and CET1, each expose a different dimension of structural profitability; reading them in sequence reveals whether a bank’s earnings gap against peers is cyclical or something the rate cycle cannot fix.
Three mechanisms explain why the margin lift never arrived:
- Deposit repricing catch-up: banks initially reprice deposits slower than loans, which supports margins early. But term deposits and savings rates eventually catch up, and that early benefit erodes.
- Front-book mortgage competition: to win refinance volume, banks price new mortgages aggressively, dragging down the average margin on the book.
- Wholesale funding costs: as central banks shrink balance sheets and depositors chase yield, the cost of wholesale funding climbs, squeezing the margin further.
The numbers show the squeeze playing out across all four banks.
| Bank | Latest NIM | Direction | Primary driver |
|---|---|---|---|
| CBA | 2.05% (FY26) | Down 3bp YoY | Low-margin liquid asset growth |
| Westpac | 1.89% (Q3 FY26) | Stable QoQ | Core 1.78% plus 11bp Treasury and Markets |
| ANZ | 1.54% (Q3 FY26) | Up 1bp QoQ | Replicating portfolio earnings |
| NAB | 1.81% (1H FY26) | Up 3bp HoH | Replicating portfolio offsetting competition |
A note on NAB: the original reporting flagged a margin of 1.79%, down 2 basis points, while more recent research puts the 1H FY26 group NIM at 1.81%, up 3 basis points half-on-half. The most recent verified figure is used here, but the discrepancy is worth flagging given how tight these movements are. Sector-wide, NIM fell 3 basis points to 1.82% in the latest half.
There is a partial offset. Replicating portfolios and capital hedges, essentially structured positions that smooth interest income across the rate cycle, have provided a tailwind for some banks, ANZ in particular. That softens the compression, but it does not reverse it.
International experience suggests this is not a timing problem that resolves later in the cycle. According to research on the US market, 83% of American banks with assets above US$1 billion saw year-on-year NIM compression between Q1 2023 and Q1 2024, even as the Fed funds rate climbed from 4.65% to 5.33%. The Bank of England observed that UK bank NIMs peaked mid-cycle and began falling by Q3 2023.
The read for you is direct. Rate-driven margin expansion is not happening at any of the four majors, and history says it will not arrive late. Profitability has to come from somewhere else.
What the earnings actually show: volume and cost discipline carrying the load
If margin is not the engine, what is? The FY26 and Q3 results answer that question, and they tell a story of substitution: volume growth and cost discipline are doing the work that rate rises were supposed to do.
| Bank | Latest profit | Period | CET1 ratio |
|---|---|---|---|
| CBA | $10.98B cash NPAT | FY26 full year | 12.0% |
| Westpac | $1.8B net profit | Q3 FY26 | 12.1% |
| NAB | $1.83B cash earnings | Q3 FY26 | 11.93% |
| ANZ | $1.90B cash profit | Q3 FY26 | Not disclosed |
CBA’s full-year result in context
CBA led the majors in FY26, and the detail explains why it commands the premium it does.
Cash net profit after tax rose 7% to $10.98 billion, generated on operating income of $30.2 billion. Cash return on equity reached 14.0%, and the common equity tier one (CET1) capital ratio finished the year at 12.0%. The full-year dividend came in at $5.05 per share, fully franked.
That CBA grew cash profit 7% without meaningful NIM expansion tells you volume and operational efficiency are carrying the result. That is exactly why the market prices it at a premium, and why the premium is hard to erode without a specific negative catalyst.
One number to watch: loan impairment expense climbed 9% to $788 million in FY26. It is an early credit-quality signal, and the section below returns to it.
The Q3 quarterly snapshot across Westpac, NAB, and ANZ
The three quarterly updates read as steady rather than exceptional, and the capital positions matter as much as the profit lines.
Westpac posted net profit of $1.8 billion excluding notable items, on a CET1 ratio of 12.1%. NAB delivered cash earnings of $1.83 billion with a CET1 ratio of 11.93%, while recording $299 million in credit impairment charges. ANZ reported cash profit of $1.90 billion.
Each bank’s capital ratio sits comfortably above regulatory minimums, which is what keeps dividends sustainable across all four. But steady earnings on flat margins raises the question that follows: are current share prices paying for what these banks actually deliver?
Valuation divergence across the four majors: where is the value and where is the risk?
This is where the four banks split apart. CBA trades at a multiple its peers cannot approach, and the gap is the sharpest practical signal in this analysis.
| Bank | Share price (early Sept 2026) | PE multiple | Forward dividend yield |
|---|---|---|---|
| CBA | $158.69-$160.97 | 24.2x-24.8x | 3.13%-3.15% |
| NAB | ~$38.87 to mid-$40s | ~19.6x | 4.33%-4.37% |
| ANZ | $36.94-$37.60 | 19.0x-19.2x | ~4.37%-4.38% |
| Westpac | ~$34.58 | Not disclosed | ~4.41% |
What is the market paying for at CBA? Earnings consistency, ROE leadership, and franking. The 14.0% cash ROE and the $5.05 fully franked dividend are genuine quality markers, and the premium reflects that.
ASX bank premium multiples have attracted scrutiny well beyond Australia: the sector’s weighted average price-to-fair-value of approximately 1.14 and a return on equity that has fallen to 11.0% against a 12.0% long-run average represent the least favourable combination of valuation and returns among developed-market banking peers.
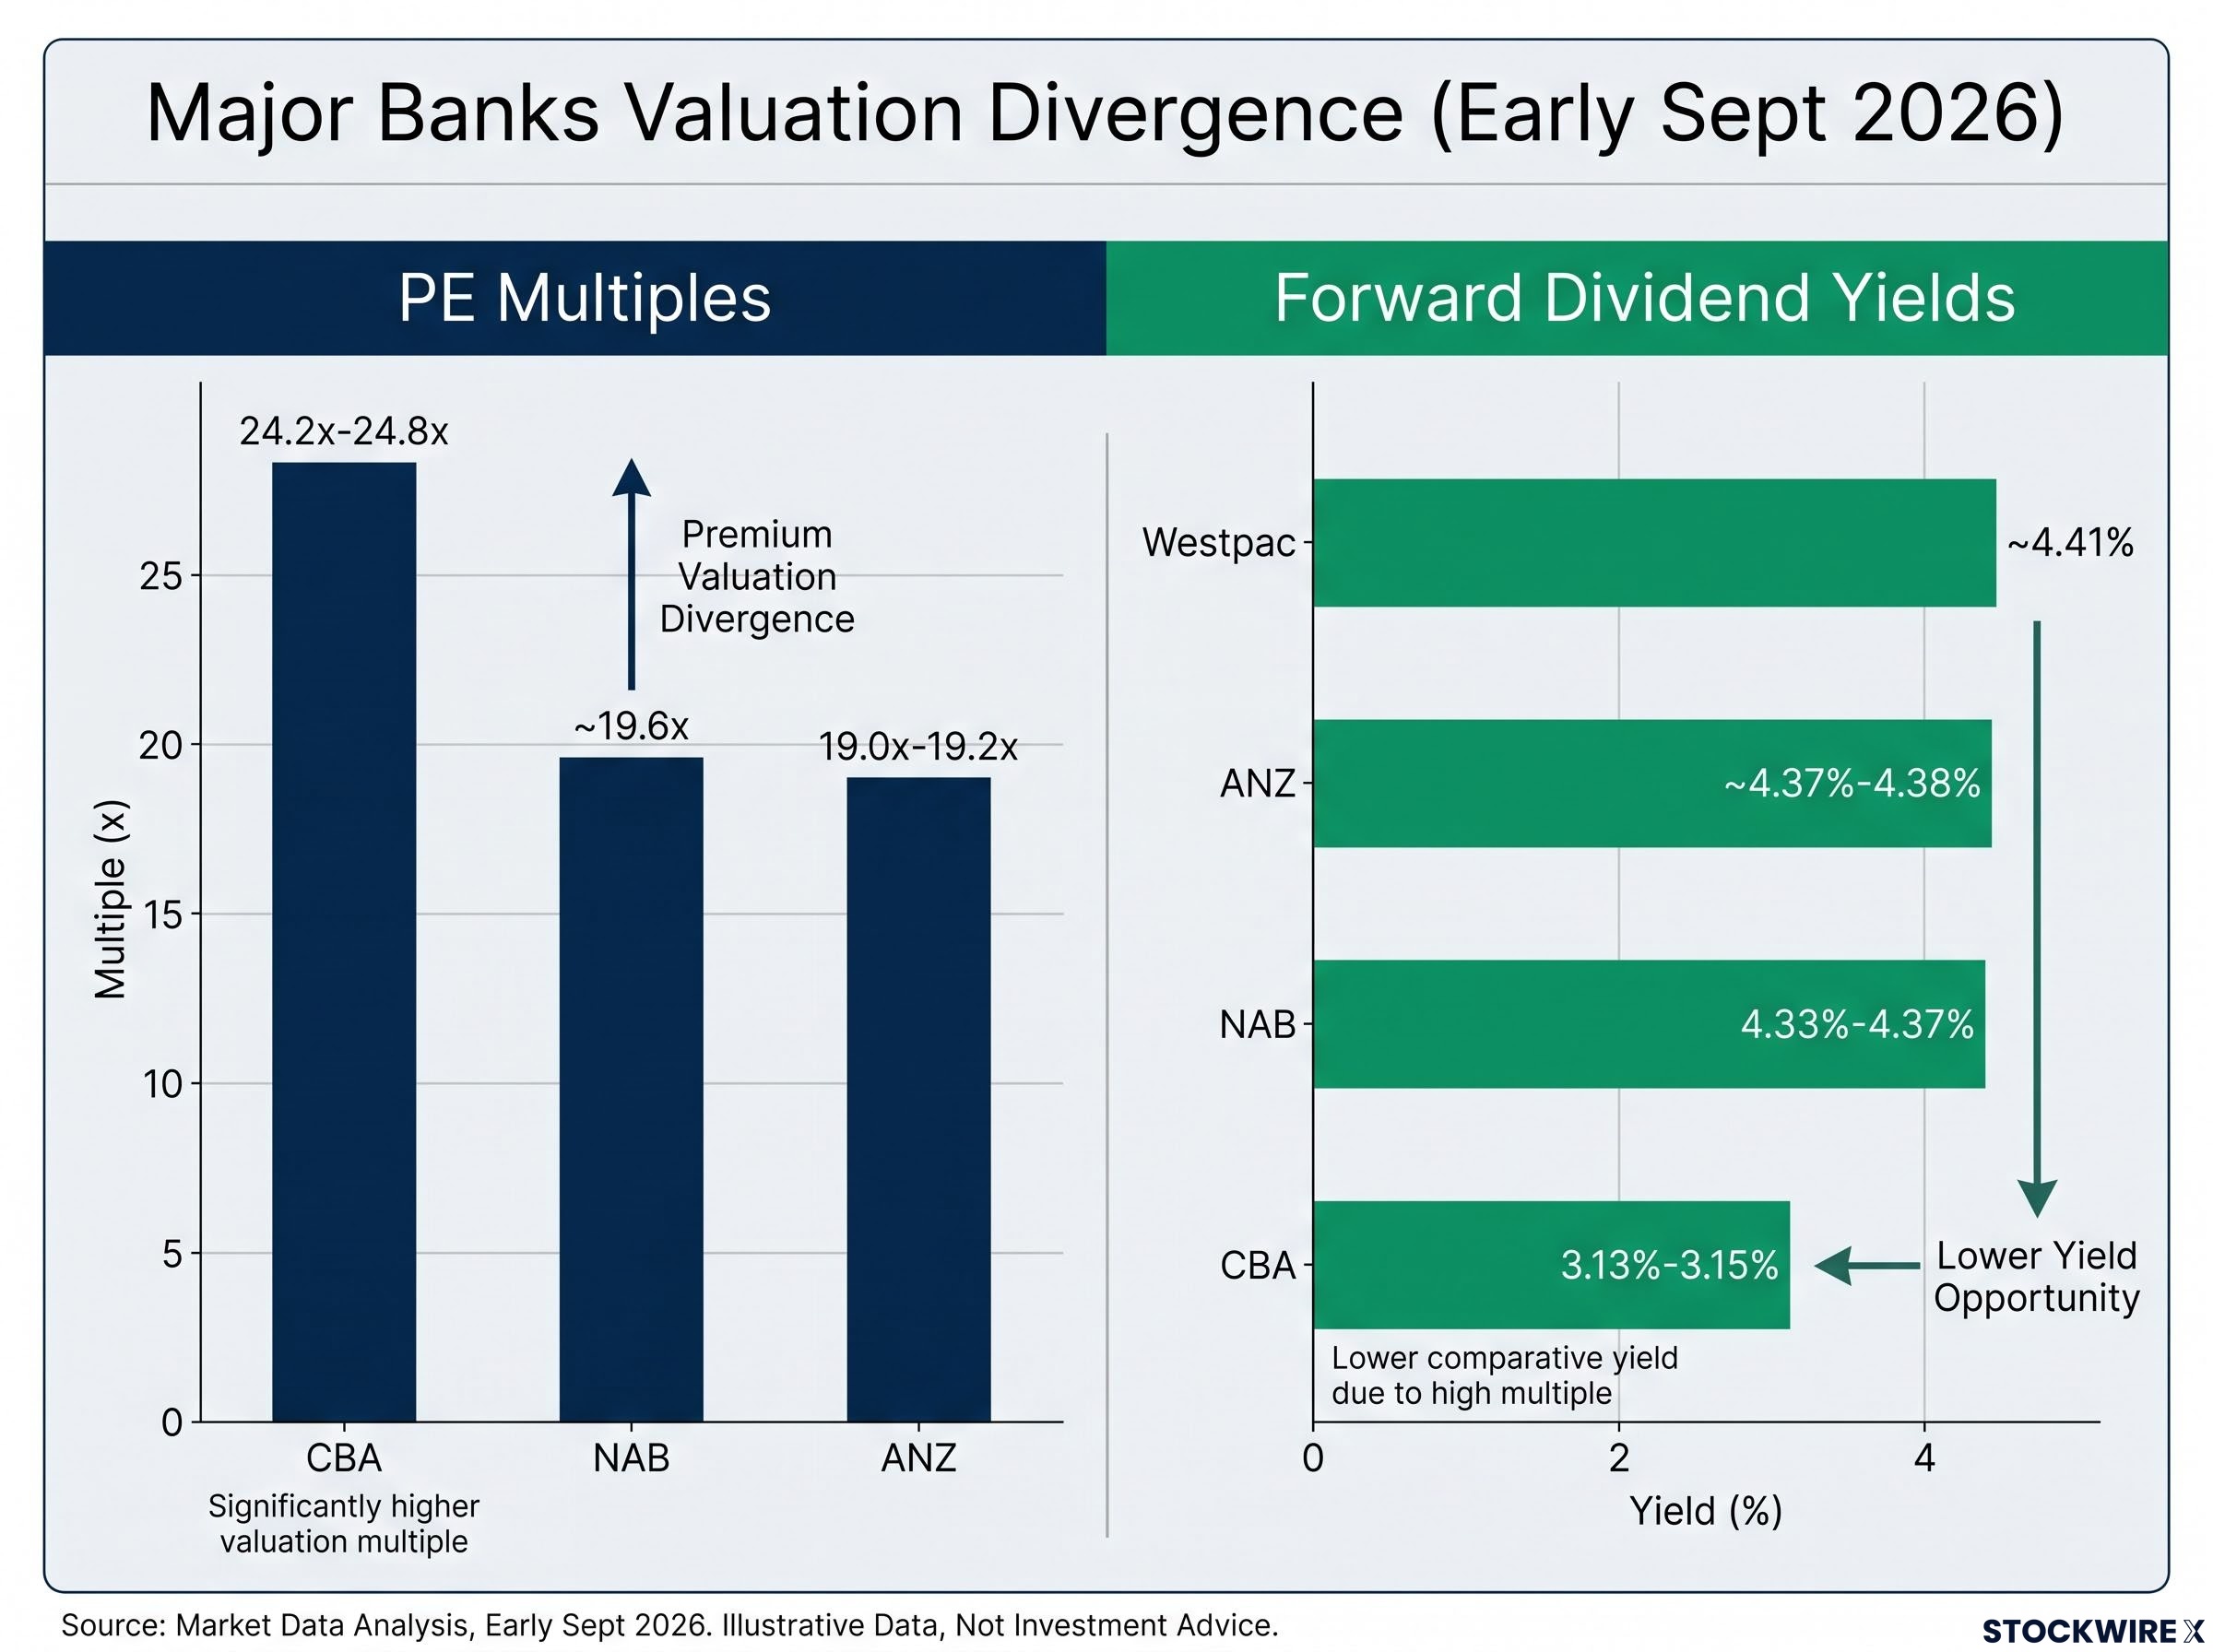
The risk sits in the multiple itself. At 24x-plus earnings, there is limited buffer if credit costs accelerate. A bank priced for perfection has further to fall when the picture turns than one already priced closer to fundamental value.
For income-focused investors, the table delivers a clear message. NAB, ANZ, and Westpac all offer forward yields around 4.3% to 4.4%, meaningfully above CBA’s roughly 3.1%. If the rate plateau compresses the growth thesis, that yield gap is what matters, and it favours the three peers.
The market is alert to the shift. The ASX financials sector fell 1.63% on the day the revised rate-hike forecasts were widely publicised, and institutional positioning reflects the caution.
Wilson Asset Management holds an underweight position in the Australian banking sector, an institutional signal worth weighing against the sector’s full valuations.
The choice between premium quality and better-priced alternatives comes down to time horizon and income needs. But valuation alone does not settle it, because the variable most likely to move the case over the next year is not on these tables yet.
Credit quality, household stress, and the risk that is not yet in the price
Where profitability comes from is one question. What could interrupt it is another. Credit quality is deteriorating gradually but measurably, and it is the risk least reflected in current pricing.
Household stress as a leading indicator
Sustained high rates are grinding on borrowers, and the strain shows up first in demand.
Household balance-sheet stress is compounding the arrears trend from multiple directions: falling dwelling prices, collapsed consumer sentiment at 80.6 against a neutral of 100, and a structural pullback in discretionary spending together indicate that borrower pressure is broadening beyond mortgage stress into the wider consumption base that supports bank loan volumes.
Borrowers with an $800,000 loan are paying more than $1,000 extra per month compared with April levels. This figure is an approximate indicator rather than a bank-reported number, but it captures the scale of the repayment burden that has stripped billions from household budgets each month.
The demand signal is already visible. ANZ reported a 12% drop in home-loan applications, as higher rates and tax changes hit borrowing appetite. Weaker applications today mean a thinner lending pipeline tomorrow, which pressures the volume growth currently holding earnings up.
Arrears, provisions, and what analysts are building in
Realised credit losses remain low, but the arrears trend is heading in one direction.
- 90-plus day household arrears across the major mortgage books rose from 0.87% in 1H FY25 to 1.08% in 1H FY26
- Prime mortgage arrears reached 0.85% for loans 30-plus days past due
- Non-conforming arrears hit 3.42%
The provisioning data confirms the drift. CBA’s loan impairment expense rose 9% to $788 million in FY26, and NAB booked $299 million in credit impairment charges in Q3. Analysts are building in more.
Morningstar raised its fiscal 2026 loan impairment expense forecast by A$350 million to A$1.2 billion, lifting the loss ratio to 0.16% from 0.11%. Fitch expects impaired-loan ratios to rise over the next 12 months.
Here is why this matters more than the low headline numbers suggest. Arrears are climbing before any rate cuts have relieved borrower pressure, which means credit costs are likely to push higher into FY27. The downside is asymmetric: investors in CBA at 24x earnings have far less room to absorb that deterioration than investors in NAB or ANZ at around 19x.
Past performance does not guarantee future results. Financial projections are subject to market conditions and various risk factors.
Making an informed call on Australian bank shares in a rate-plateau environment
Three findings define the current picture. The rate thesis has flipped from hikes to a plateau followed by cuts in 2027. NIM expansion has not materialised and international precedent says it will not arrive late in the cycle. And credit costs are rising from a low base, with Fitch and Morningstar both signalling higher impairments ahead.
That convergence points to a practical distinction. CBA offers premium quality, a leading ROE, and unmatched franking, but at 24.2x-24.8x earnings and a roughly 3.1% yield, it carries little valuation buffer. NAB, ANZ, and Westpac trade near 19x with forward yields of 4.3% to 4.4%, which makes their income case more defensible in a plateau, unless your thesis rests specifically on CBA’s earnings consistency and franking value.
Three signals to track from here:
- The RBA’s language on further tightening at the 29 September 2026 meeting
- Each bank’s half-year provisioning updates for the pace of credit deterioration
- Whether mortgage application volumes stabilise or fall further
This article is for informational purposes only and should not be considered financial advice. Investors should conduct their own research and consult with financial professionals before making investment decisions.