The U.S. dollar is weakening, long-end Treasury yields are climbing, and gold is approaching $4,376 per ounce. Yet U.S. stocks have not collapsed. That combination is not accidental; it is the fingerprint of a specific macro regime, and Barclays put a name to it on 7 August 2026.
In their weekly market commentary, Emmanuel Cau and the Barclays strategy team described the current environment as a selective repricing of U.S. asset risk, with the pressure concentrated in currencies and long-duration bonds while equities continue to grind higher. The distinction matters because it changes which parts of a portfolio carry the most risk right now, and it reshapes how you should think about what is supposed to protect you.
Here is what Barclays identified, why the trade is landing in currencies and Treasuries first, and which signals will tell you whether it stays contained or spreads to equities.
Barclays flags a partial revival, not a full-blown flight from U.S. assets
The Barclays weekly commentary dated 7 August 2026 does not declare a crisis. It diagnoses something more specific: a partial revival of the Sell America trade, one that is repricing risk in the dollar and long-duration Treasuries while leaving equities largely intact. That qualification is the analytical heart of the call.
Barclays identifies three primary drivers reigniting anti-U.S. asset sentiment:
- Questions about where the Federal Reserve’s policy stance is heading and how it will respond to incoming data
- The prospect of a disruptive yen carry trade unwind, given that Japanese Government Bond (JGB) yields have climbed well beyond where they stood when carry positions last unwound in 2024
- Growing scepticism over whether AI-related capital expenditure can sustain the growth expectations that currently underpin U.S. equity valuations
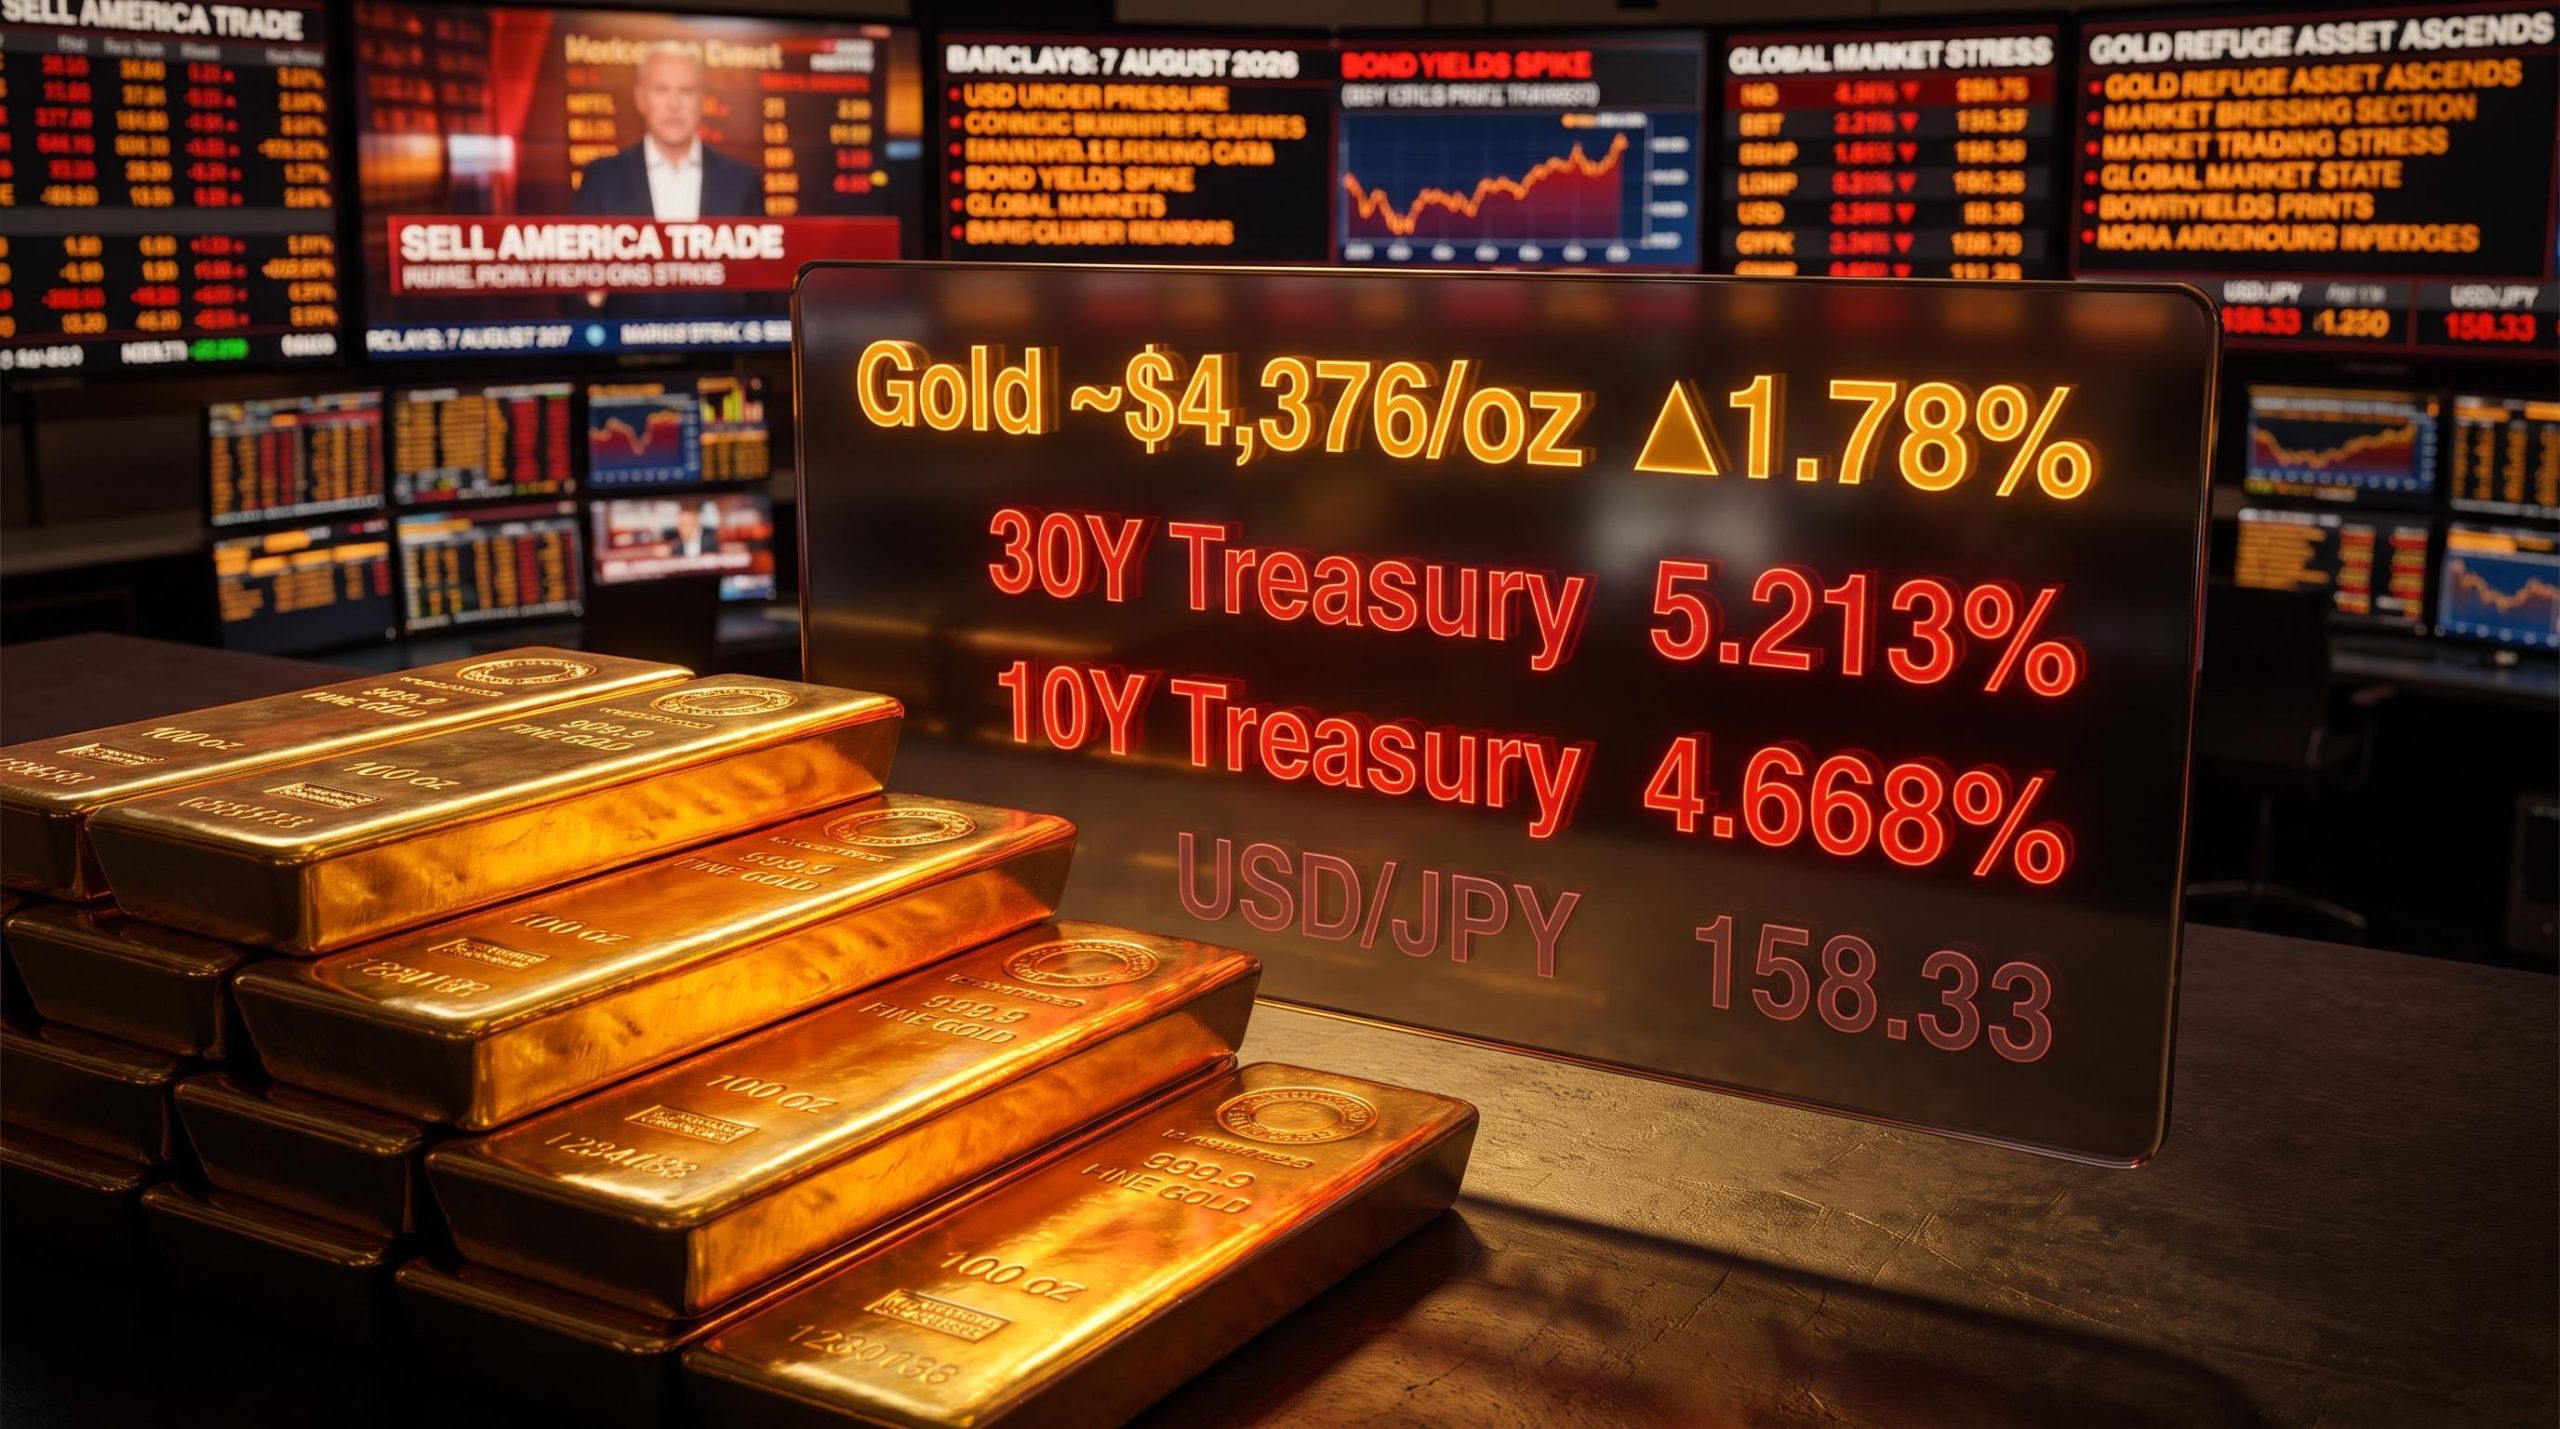
Gold futures rising roughly 1.78% on the day to approximately $4,376 per ounce, even as equities held steady, fits that picture: the market is attaching a higher risk premium to U.S. assets, but the adjustment is targeted rather than broad-based. Currency and duration are absorbing the pressure; the S&P 500 is not.
That is not reassurance. It is a specific structural diagnosis. It tells you the risk is currently sitting in your currency exposure and your long-duration bond holdings, not in your equity sleeve, and that distinction changes the hedging calculus entirely.
When big ASX news breaks, our subscribers know first
What “Sell America” actually means, and why it behaves like a correlation regime
“Sell America” is not a political slogan. It is shorthand for episodes when investors simultaneously demand a higher risk premium for the dollar, long-duration Treasuries, and U.S. equities rather than treating any one of those as a safe offset to the others.
J.P. Morgan Private Bank framed it directly:
“Global investors flee American assets and the stock market, bond market and dollar all sell off at once.”
EBC Financial Group defines the same dynamic as a correlation regime: dollar weakness, higher long-term yields, and U.S. equity underperformance alongside elevated volatility. Earlier episodes in 2025 and 2026 followed this template clearly. After tariff announcements and geopolitical shocks, stocks, the dollar, and Treasuries were all under pressure simultaneously while gold spiked as a refuge.
When your hedges start moving against you
The correlation-regime framing is where this gets personally relevant. In a normal environment, long Treasuries and the dollar tend to rally when equities sell off; that is the hedging logic behind a conventional balanced portfolio.
In a Sell America regime, that relationship breaks. The dollar weakens even in risk-off sessions. Long-end yields stay elevated or rise instead of rallying on weak growth data, reflecting a higher term premium, which is the extra yield investors require as compensation for uncertainty about future inflation and growth paths beyond what short-term rate expectations alone would justify. Barclays characterises the current macro backdrop as a complex, overlapping set of forces that are failing to provide support for the dollar or the broader rates complex.
If you are holding a portfolio that relies on long Treasuries and dollar strength to cushion equity drawdowns, you are currently holding assets that may move in the same direction as your equity exposure during a stress episode. That is the opposite of hedging.
How the dollar and long-end yields are absorbing the pressure right now
The regime is not theoretical. It is already visible in current prices.
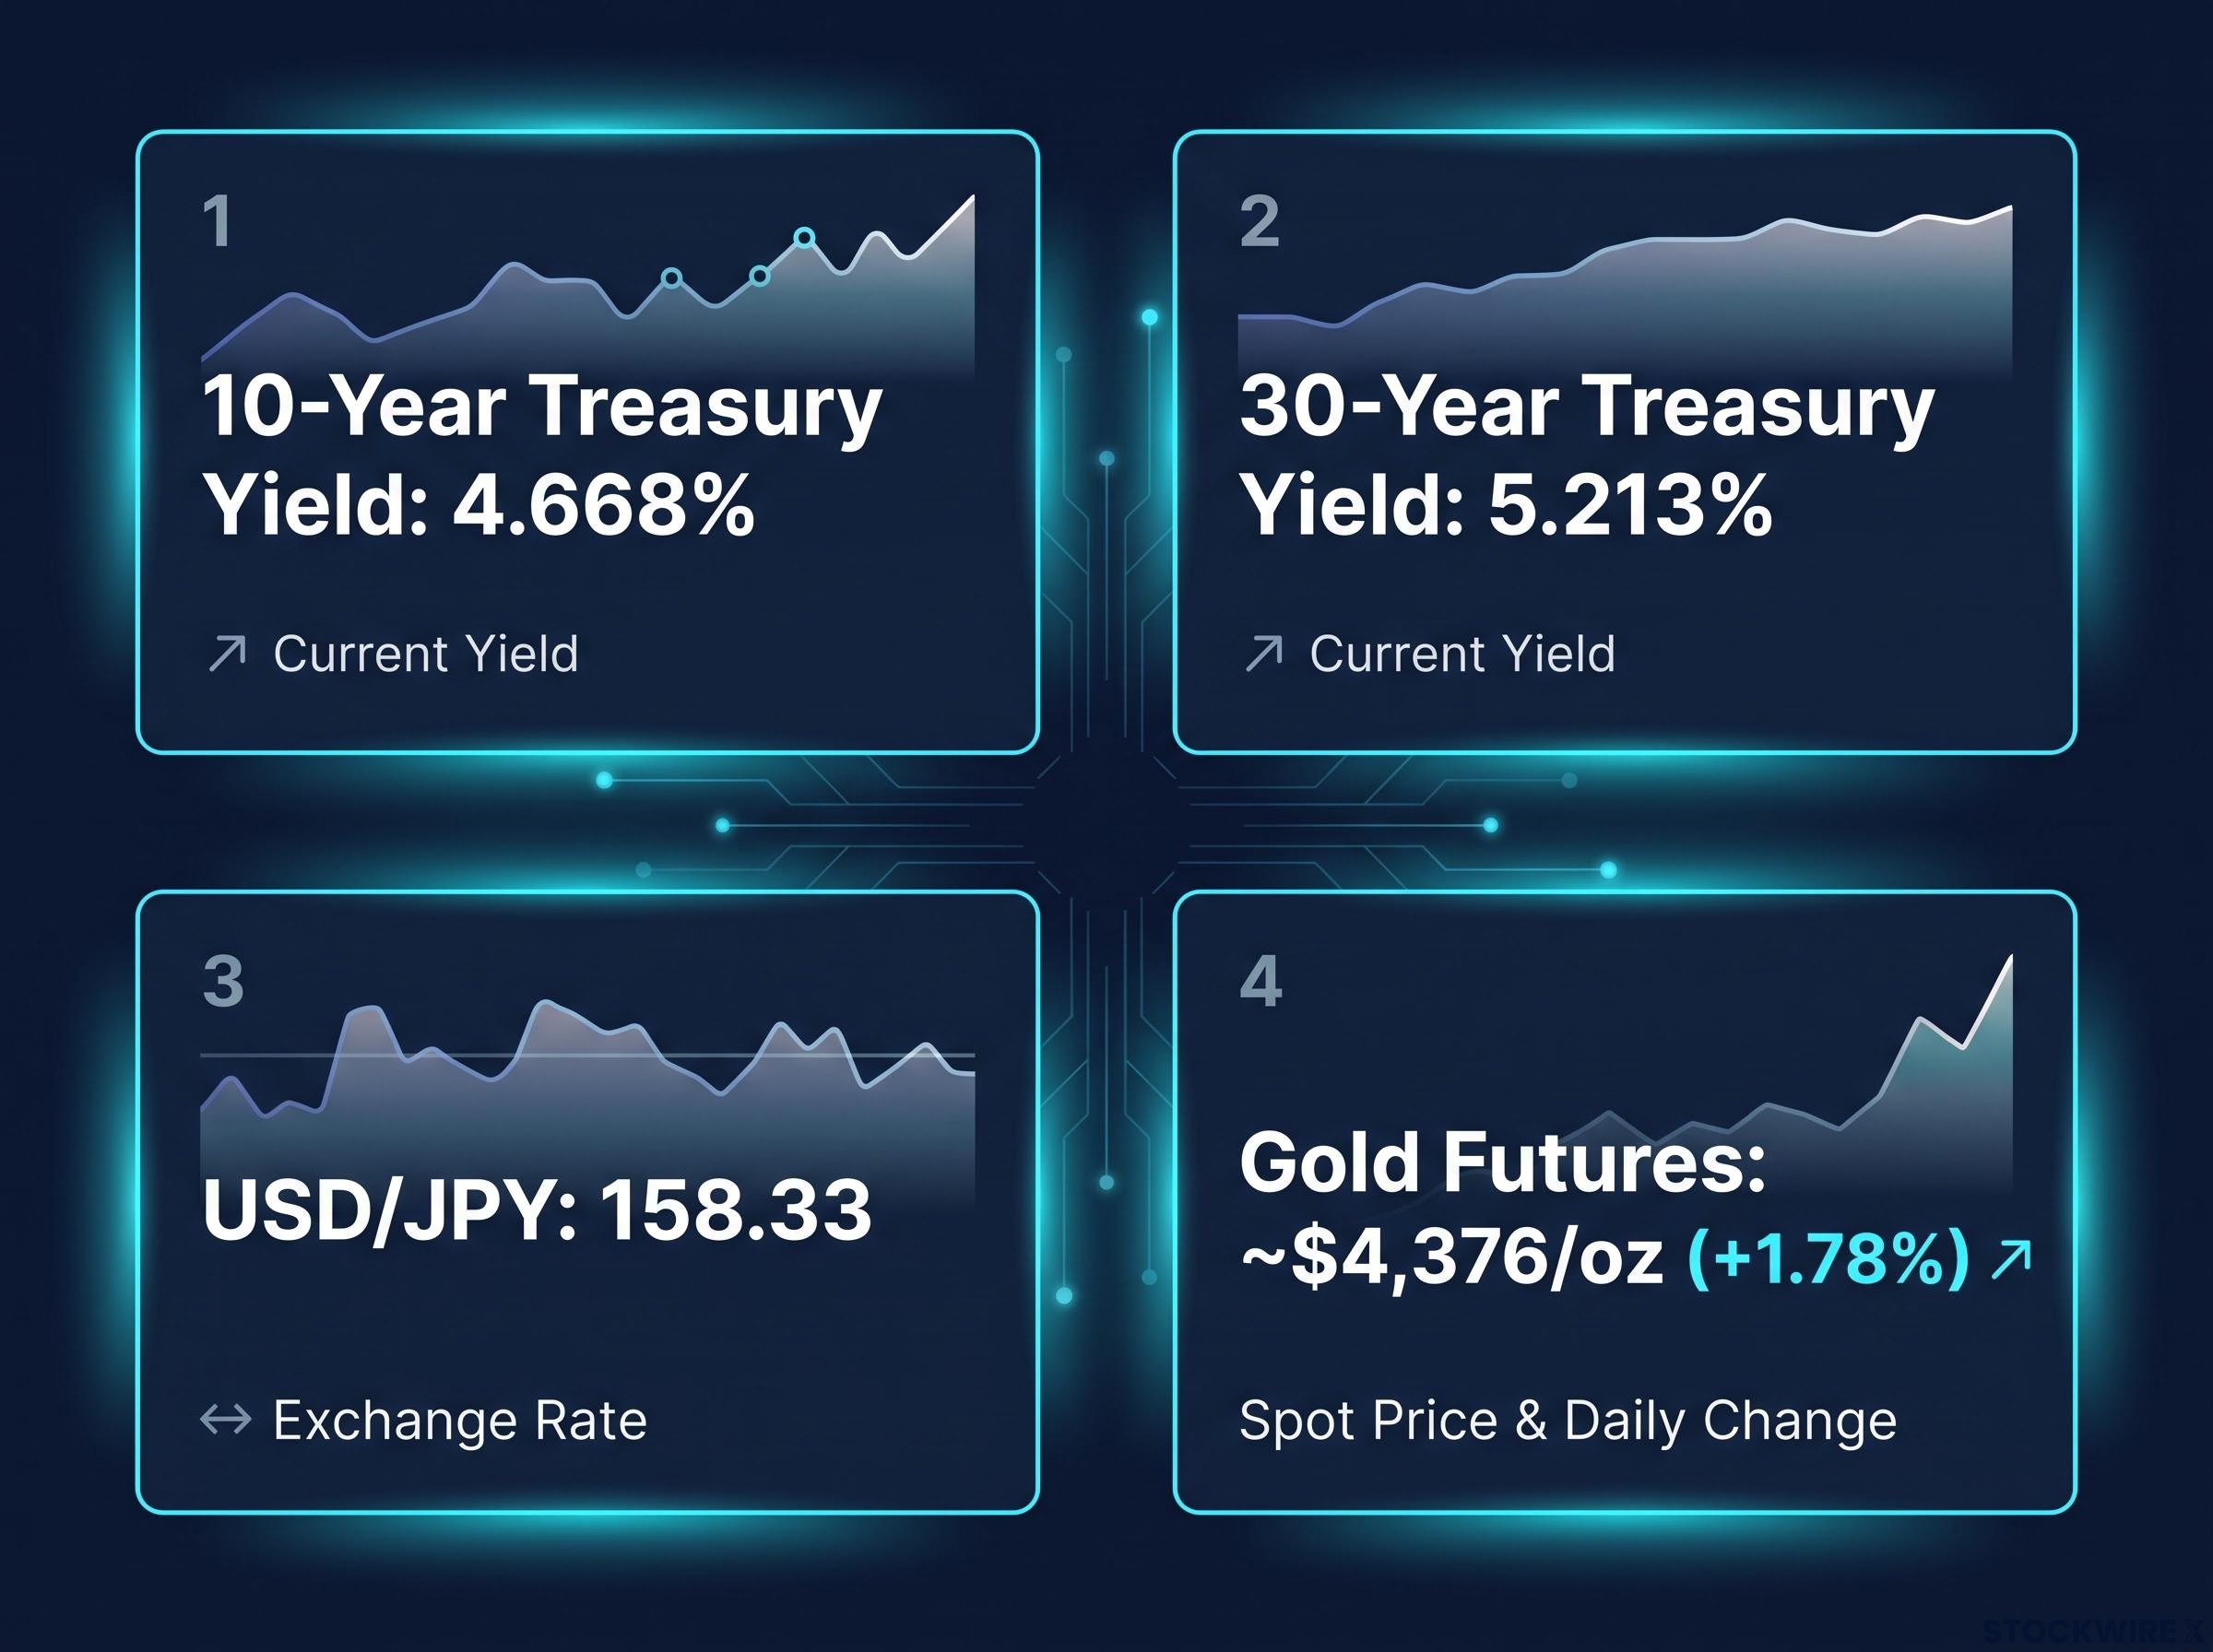
| Asset | Current Level | Direction | Significance |
|---|---|---|---|
| U.S. 10-year Treasury yield | 4.668% | Elevated | Term premium reflects policy uncertainty, not just growth |
| U.S. 30-year Treasury yield | 5.213% | Elevated | Discount-rate headwind for long-duration growth equities |
| USD/JPY | 158.33 | Minor decline | Dollar losing ground against yen despite yield differential |
| Gold futures | ~$4,376/oz | Up ~1.78% | Alternative reserve demand consistent with U.S. risk repricing |
The mechanism connecting these levels runs through Fed reaction-function uncertainty. When investors cannot predict whether the Fed will lean hawkish or dovish in response to mixed data, they price in a higher term premium and demand a larger risk premium on the dollar. According to Barclays, markets had priced in one further Fed rate increase before year-end, even though softening oil prices tied to easing U.S.-Iran tensions and broadly contained unit labour cost growth both point to reduced pressure on the central bank to tighten further.
Barclays describes the overall macro environment as “increasingly unsupportive” for both the dollar and the broader rates complex, noting that a meaningful tightening in financial conditions has occurred since the most recent FOMC meeting, even as Fed communications have shifted toward a more dovish tone.
A 30-year yield above 5.2% is not just a number for bond traders. It is a discount rate that makes every long-duration equity story more fragile. The same macro forces suppressing the dollar are simultaneously raising the bar for equity valuations, even if equity prices have not yet adjusted.
The institutional selloff in long-dated Treasuries has accelerated beyond tactical positioning, with PIMCO, BlackRock, and Schroders actively reducing long-end exposure even at yields above 5.2%, driven by a structural reassessment of U.S. fiscal risk rather than any near-term rate view.
Why the yen carry trade is the most dangerous amplifier in the room
The yen carry trade is the channel through which a shift in Japanese monetary policy becomes a direct stressor on U.S. long-end yields and the dollar. The mechanics are straightforward: for years, investors borrowed cheaply in yen (given near-zero Japanese rates) and bought higher-yielding assets, including U.S. Treasuries and U.S. equities. When JGB yields rise, that rate differential compresses and positions must be unwound.
The 2024 yen carry trade unwind resolved within weeks with no cascading structural breakdown, yet the 2026 setup is materially different: JGB yields have climbed well above the 2024 trigger level and yen short positioning remains near historical extremes, making any repeat episode harder to contain.
What a disorderly unwind would look like in practice
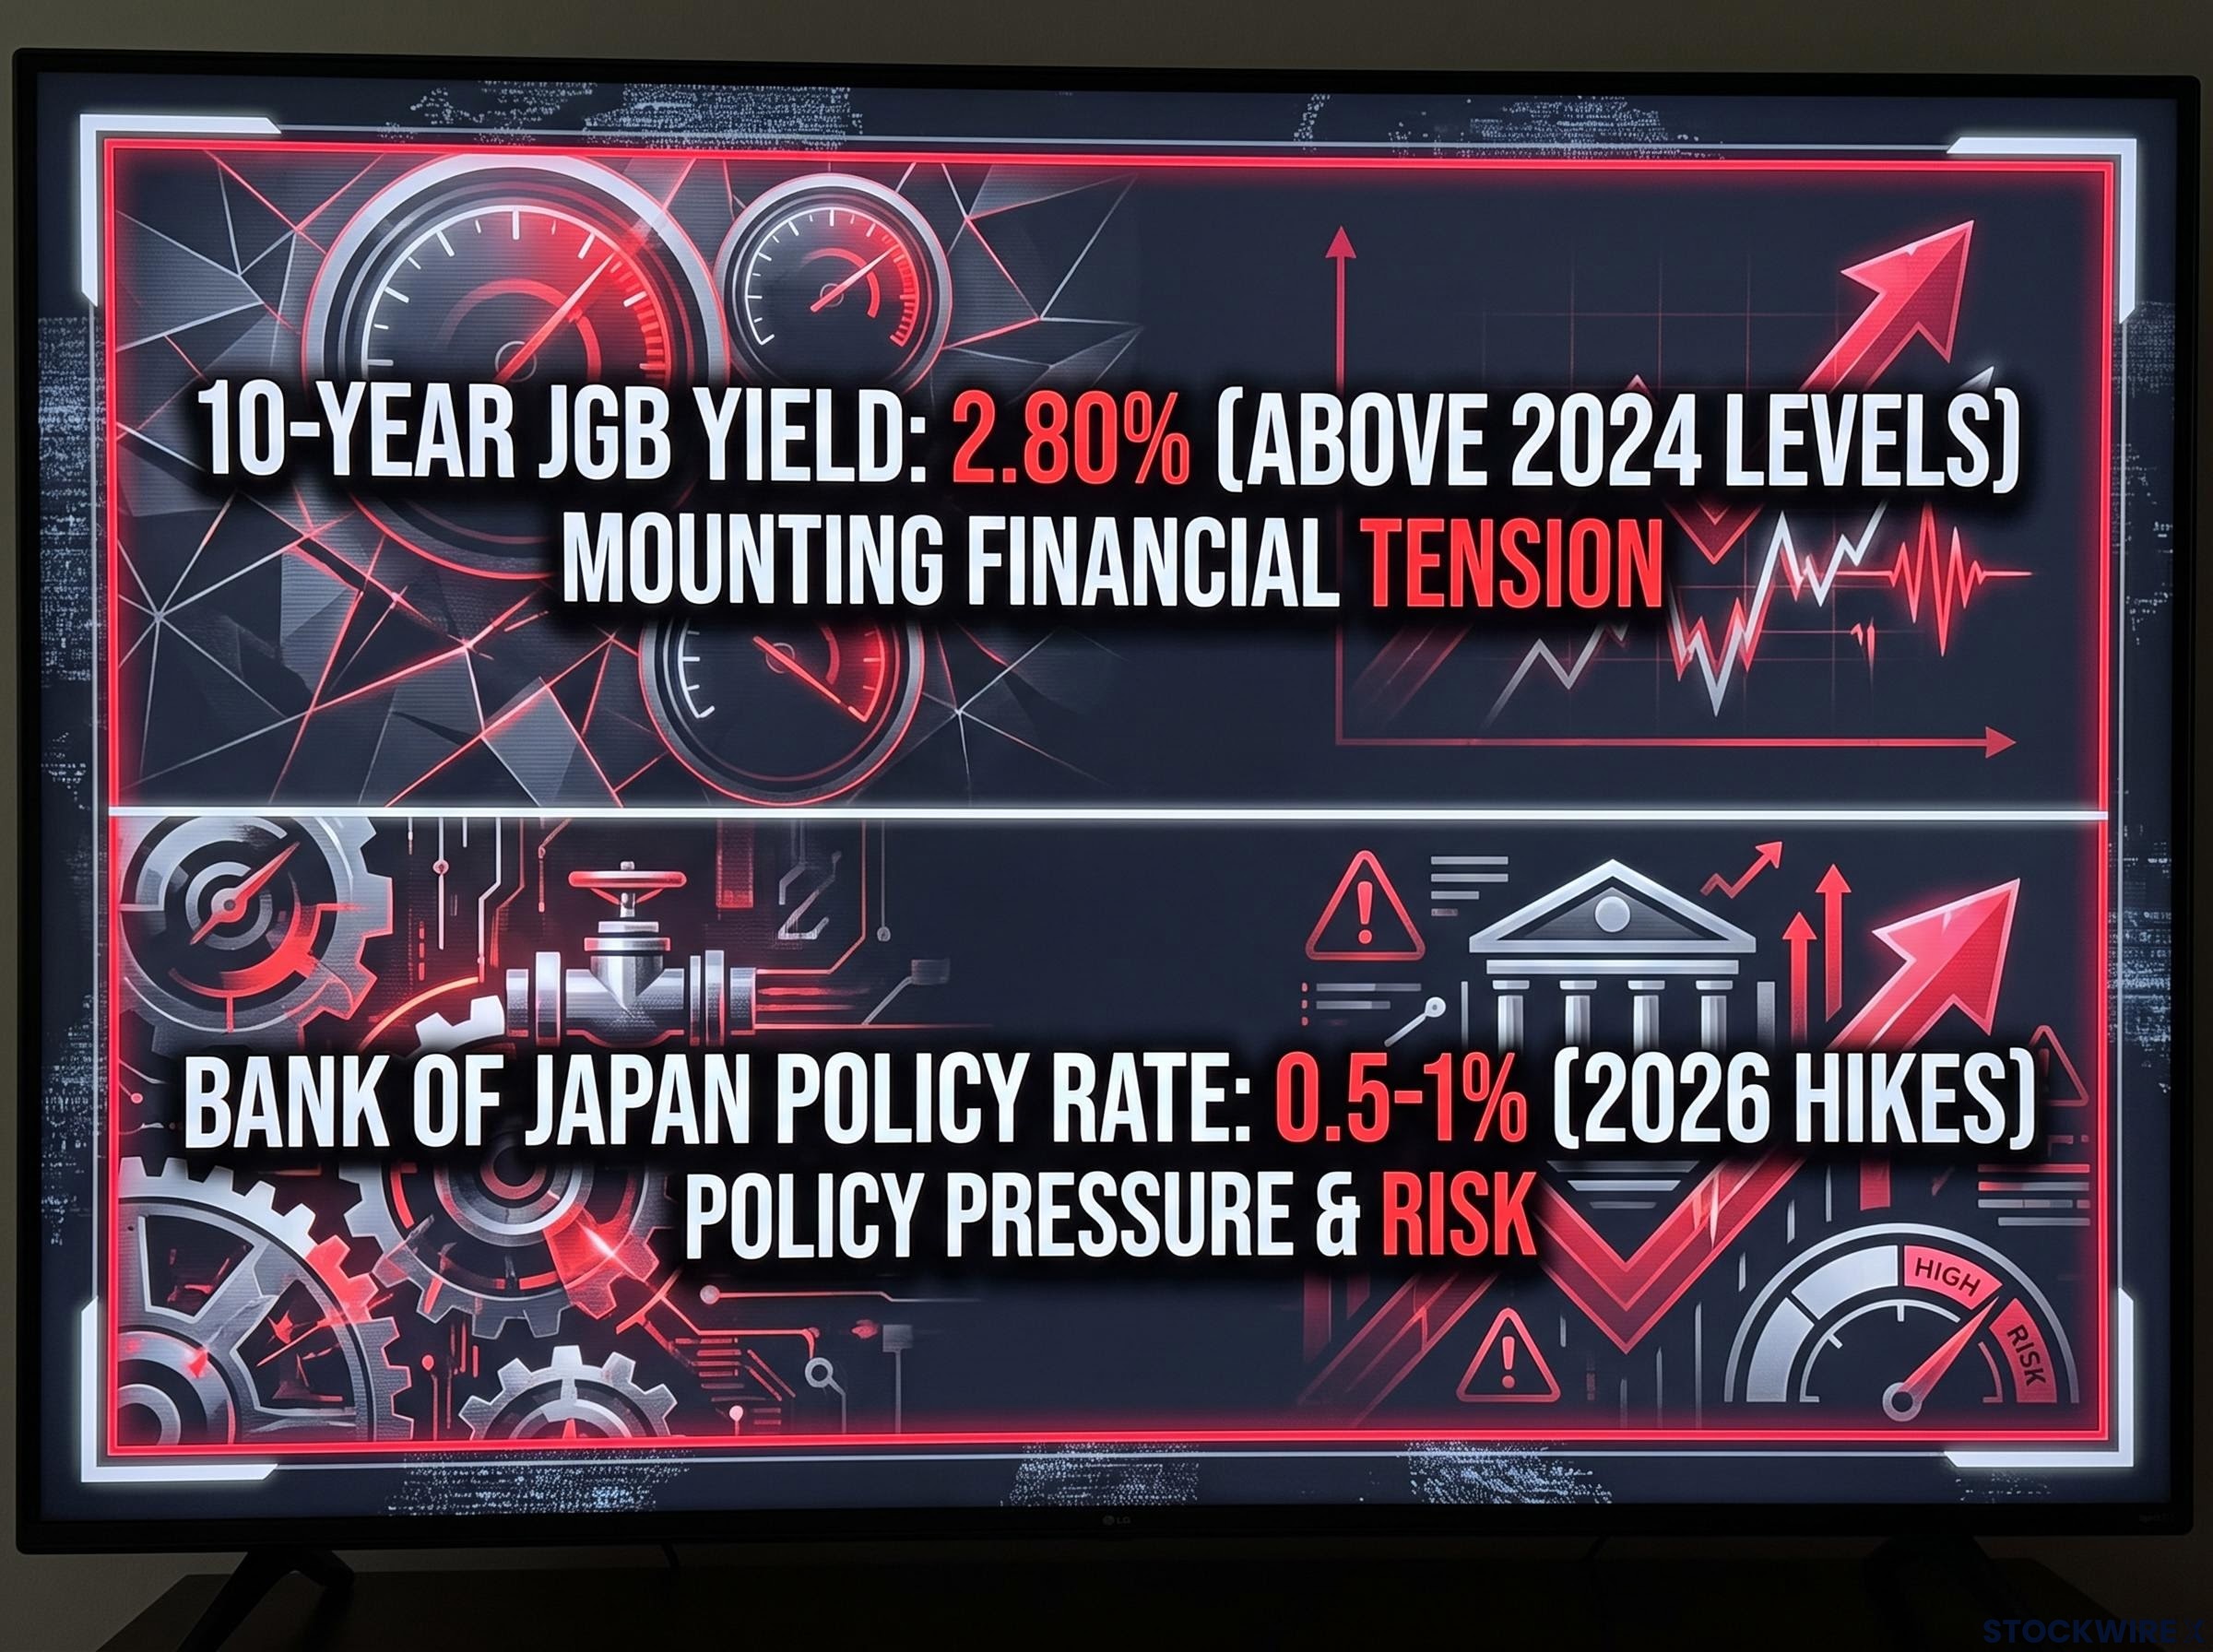
The current setup is structurally more precarious than 2024. At 2.80%, the 10-year JGB yield has moved well above where it was trading when the 2024 carry unwind rattled global markets, representing a meaningfully more stretched starting point for any repeat episode. The Bank of Japan has normalised its policy rate to as high as 0.5-1% through 2026 hikes.
Barclays flags three specific conditions that make this channel live:
- Yen short positioning remains near historical extremes, and the carry trades built on that positioning continue to represent a latent and substantial source of market volatility
- JGB yields have already surpassed the threshold that triggered the 2024 unwind, leaving the setup for a potential forced liquidation in a more vulnerable state than before
- Concerted intervention to support the yen is generating spillover pressure across both the U.S. dollar and the Treasury market
A disorderly unwind follows a predictable sequence: yen funding becomes more expensive, positions unwind rapidly, and U.S. Treasuries and dollar assets face simultaneous selling pressure in potentially thin liquidity. That is the mechanism that could convert a partial Sell America regime, one concentrated in FX and bonds, into a broader risk-off episode that reaches equities.
If you were caught off guard in 2024, these conditions should register as a live structural warning, not background noise.
The signals that will tell you whether this stays partial or goes further
Four indicators will determine whether this remains a contained repricing or broadens into a full exit from U.S. assets. Listed in order of diagnostic priority:
- Dollar behaviour in risk-off sessions. If dollar weakness persists even when global risk sentiment deteriorates, it signals investors no longer treat the dollar as the default hedge. That is the hallmark of a full Sell America regime.
- Long-end yield response to soft data. If 10- and 30-year yields stay elevated or rise on weak growth or benign inflation prints, that points to term premium and policy risk rather than cyclical strength. If the next CPI print comes in soft but 30-year yields do not rally, that divergence would be one of the clearest possible confirmations that policy risk, not economic data, is now driving the Treasury market.
- Dollar/S&P 500 correlation. JPMorgan highlights the 90-day correlation between the dollar and the S&P 500 as a monitoring signal. If that correlation rises while U.S. stocks begin to lag non-U.S. markets more visibly, it indicates the equity leg is joining the trade.
- BOJ communications and JGB yield moves. Any sign the BOJ will tolerate higher JGB yields or tighten policy further is a direct threat to yen-funded carry trades, with the potential to accelerate selling of U.S. duration and dollar exposure.
Two of the three carry trade warning signals that preceded the 2024 S&P 500 decline are already active in 2026, with the 10-year JGB yield at approximately 2.65% and yen short positioning near historical extremes, leaving only a confirmed USD/JPY breakdown below 160 as the remaining trigger.
Sustained gold appreciation occurring alongside dollar weakness and elevated long-end yields points to investors repricing the risk premium attached to U.S. assets as a structural shift rather than a routine cyclical move, an interpretation that aligns with Barclays’ analysis.
These indicators transform an abstract macro narrative into a practical watchlist you can monitor in real time.
What this regime means for how you position across FX, rates, and equities
Three positioning considerations follow directly from the regime Barclays has identified:
- Rethink the dollar and long Treasuries as hedges. In this correlation regime, both can fail to cushion equity drawdowns. Portfolio protection may need to come from non-U.S. duration, FX diversification, or commodity exposure including gold rather than the conventional long-UST, long-USD hedge mix.
- Treat long-end yields as a policy-risk barometer, not a growth gauge. At 5.213% on the 30-year, the discount-rate headwind for long-duration growth equities is material. Barclays argues that a substantial degree of hawkishness may already be embedded in current yield levels, meaning the risk runs in both directions and active duration management matters more than a simple directional view.
- Watch the yen and BOJ for the volatility trigger. The combination of large short-yen positions, JGB yields above 2024 unwind levels, and coordinated yen stabilisation means this can move from slow repricing to fast forced unwind quickly.
Growth equities face a compounding headwind
The same forces suppressing the dollar (elevated risk premiums on U.S. assets, Fed uncertainty) are simultaneously keeping long-end yields elevated. Both factors together create a compounding headwind for long-duration growth stocks. This is not a call to exit equities, but a signal that valuations are more fragile at current discount rates than they appear when yields are evaluated in isolation.
The core positioning insight is this: the assets many investors use to hedge against equity drawdowns are currently the assets most exposed to the same macro forces driving the stress. Portfolio protection needs to come from somewhere else.
What the partial regime leaves unresolved, and where the story goes next
The partial nature of this regime, equities holding while FX and bonds reprice, is itself an unresolved question. It may reflect considered rotation by institutional investors into non-U.S. markets. It may simply mean equities have not yet reacted to pressures already visible elsewhere.
Crowded U.S. equity positioning and crowded long-dollar positions are sitting on top of each other simultaneously, meaning a reversal in either trade mechanically accelerates selling pressure in the other, a reinforcing feedback loop that Barclays’ Emmanuel Cau flagged as a structural vulnerability in July 2026.
Near-term data will determine the direction. CPI and labour reports are the tests that will show whether the Fed is forced into a path that deepens the regime or whether softening data provides room for the dollar and long yields to stabilise. Barclays’ third driver, AI capex sustainability, is the longer-horizon variable: if investor confidence in U.S. growth narratives grounded in AI spending erodes, that is the scenario where equities stop being the stable leg.
The conditions as of today, the 10-year at 4.668%, the 30-year at 5.213%, gold at approximately $4,376, are the baseline against which every upcoming data release will be measured. The incoming data schedule over the next two to four weeks will do more to determine direction than any single analyst note. What Barclays has given you is the framework for reading what comes next.
This article is for informational purposes only and should not be considered financial advice. Investors should conduct their own research and consult with financial professionals before making investment decisions. Past performance does not guarantee future results. Financial projections are subject to market conditions and various risk factors.