Australian ETF inflows hit $7 billion in August 2026, a monthly record. What makes that figure remarkable is not the number itself but the sequence behind it: August was the second consecutive month to break a record, following July’s $6.8 billion, and no back-to-back run above $6.5 billion has ever occurred in the industry’s history.
The timing is not coincidental. Australian investors are pulling back from the domestic exposures that defined the last decade, softness in local equities and looming capital gains tax reform among the reasons, and steering that capital into globally diversified, low-cost fund structures instead.
This analysis maps exactly where August’s money went, which of the forces behind it are now structurally entrenched versus cyclically temporary, and what the flow composition reveals about how Australian investors are actually positioned. The read you take from the data matters more than the headline number, because it tells you whether your own allocation is moving with the market or against it.
August’s record inflows in full: what the numbers actually show
Net inflows of $7 billion in August 2026 surpassed July’s prior record of $6.8 billion, according to Betashares. That makes August the first time the industry has posted consecutive months each above $6.5 billion, a threshold no single month had cleared until this year.
Provider datasets vary slightly on the totals, which is worth treating as a range rather than a contradiction. Betashares reported $7 billion in inflows and $382 billion in total assets under management (AUM); Global X reported $6.9 billion in inflows and $382.5 billion in AUM; VanEck reported $6.9 billion in inflows against a lower AUM estimate of $375.6 billion.
A first in Australian ETF history August 2026 marked the first time consecutive months each exceeded $6.5 billion in net inflows. Before this year, no single month had ever crossed that line.
| Provider | Net Inflows (Aug 2026) | Total AUM |
|---|---|---|
| Betashares | $7 billion | $382 billion |
| Global X | $6.9 billion | $382.5 billion |
| VanEck | $6.9 billion | $375.6 billion |
Year-to-date, cumulative inflows through August reached roughly $43.4 billion to $44.5 billion, running approximately 37% ahead of the same period in 2025. That acceleration is the number to hold onto. A single record month can be an anomaly; a year running more than a third ahead of the prior pace is a sustained shift in how Australians deploy capital, and it changes how the rest of this story should be read.
The structural acceleration in Australian ETF inflows is not a 2026 phenomenon in isolation; H1 FY26 alone produced net inflows matching all of calendar 2024, a pace that repositions this as a multi-year compounding trend rather than a single surge.
Growth rates and the product milestone in context
The market grew 27.8% over the past year and has sustained a five-year compound annual growth rate of 25% per annum. Alongside that came a structural marker: August’s 11 new launches pushed the product count to 505 or 506, depending on the provider, the first time the industry has crossed 500 listed funds.
Product proliferation cuts two ways. It signals genuine demand, and it confirms that the ETF has become the default wrapper for new investment strategies rather than a niche alternative. That normalisation is what turns a growth story into an established feature of the market. Australia now ranks as the third-largest ETF market in Asia-Pacific, behind only China and Japan.
When big ASX news breaks, our subscribers know first
Where the money actually went: flow composition and top ETFs
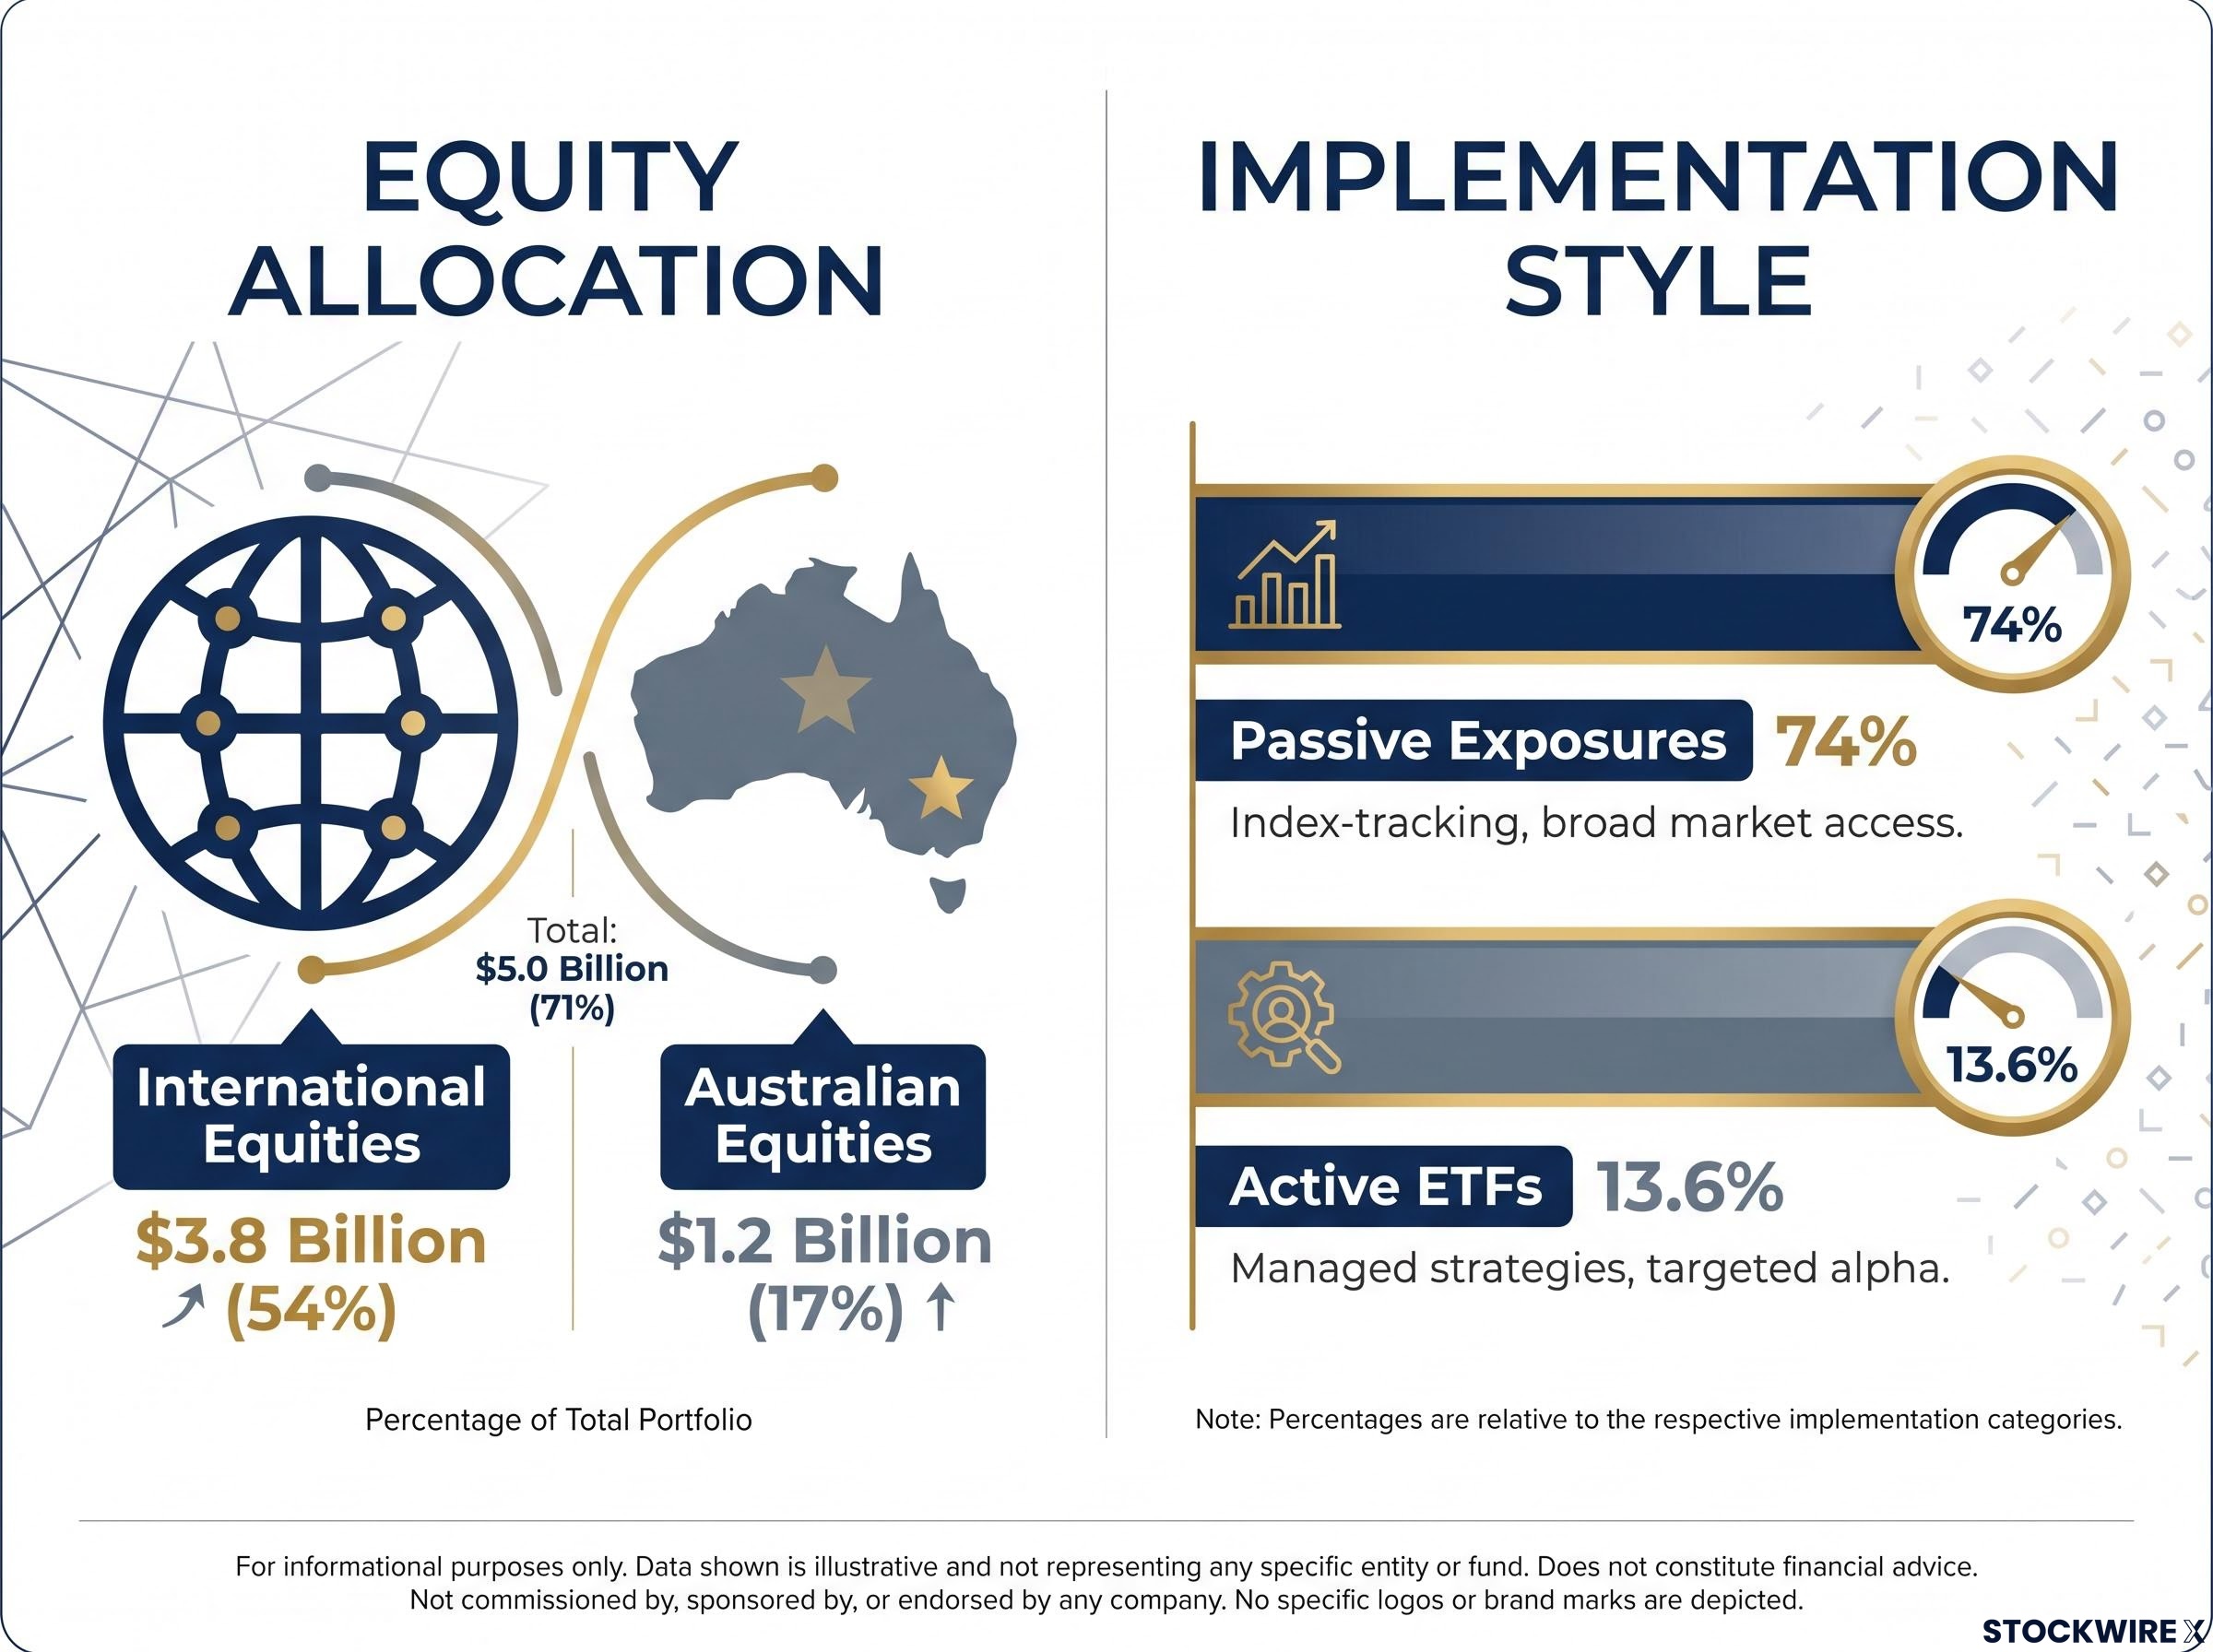
International equities ETFs captured $3.8 billion in August, a category record that surpassed the previous high of $3.56 billion set only a month earlier in July. That single category absorbed more than half of the entire industry’s monthly inflow.
The contrast with domestic exposure is where the story sharpens. Australian equities ETFs, the older and more established category, took just $1.2 billion, roughly 17% of total flows. Emerging market ETFs also recorded their highest-ever monthly inflows in August, though a specific figure was not confirmed.
Here is how the flows broke down:
- International equities: $3.8 billion, more than half of total inflows and a category record
- Australian equities: $1.2 billion, approximately 17% of total flows
- Passive, market-cap-weighted exposures: approximately 74% of total flows
- Active ETFs: 13.6% of total flows
That split, 54% international against 17% domestic, is not a rounding quirk. It reads as a statement of conviction. Australian investors are placing their diversification bets offshore, into the technology and growth sectors that the local index simply cannot offer.
The home bias reversal now visible in August’s flow composition has been building across every generational cohort since at least Q1 2026, when international ETFs overtook domestic ETFs as the most purchased category on major retail platforms for the first time.
The three ETFs that captured the most capital in August
The three funds that pulled in the most money were all broad, index-tracking products, spread evenly across domestic and global exposure.
| ETF Name | ASX Code | Net Inflows (Aug 2026) | Total AUM |
|---|---|---|---|
| Betashares Australia 200 ETF | A200 | $509 million | $11.05 billion |
| Vanguard MSCI Index International Shares ETF | VGS | $491 million | Not disclosed |
| Betashares Global Shares ETF | BGBL | $354 million | Not disclosed |
A200 led with $509 million, backed by trailing 12-month flows of $2.513 billion, and remains the low-cost core holding for broad Australian exposure. VGS followed at $491 million, offering developed-market international shares. BGBL took $354 million as a lower-cost global shares alternative.
Notice what this tells you. The top domestic fund and the top two global funds captured broadly similar dollar amounts. Investors are not walking away from Australian shares. They are layering global diversification on top of an existing domestic base, a distinction that matters far more for portfolio construction than the headline category split suggests.
Why investors are moving money this way: the structural and cyclical case
The immediate trigger was cyclical. Softness in domestic equity markets prompted portfolio rebalancing toward international exposure, a move consistent with the outperformance of US and global markets in technology and growth sectors that the Australian index underrepresents.
Sitting behind that cyclical rebalancing is a policy shift with longer reach. The Treasury Laws Amendment Act 2026, assented on 26 June 2026 and effective from 1 July 2027, overhauls how investment property is taxed:
- The traditional 50% capital gains tax (CGT) discount is replaced with cost-base indexation plus a minimum 30% tax on capital gains for individuals, trusts, and partnerships
- Negative gearing on residential property is restricted to new builds, with properties acquired after 7:30 pm AEST on 12 May 2026 losing traditional negative gearing treatment from July 2027
- The reforms take effect from 1 July 2027
The reform does not regulate ETF investing at all. What it does is reduce the tax advantage of holding investment property, and in doing so it shifts the relative appeal of listed assets as a wealth-building vehicle. Investors appear to be responding to that shift in real time, well ahead of the effective date.
The negative gearing and CGT reforms introduced in the 2026-27 Federal Budget represent the broadest reconfiguration of Australian investment taxation in a generation, and their combined effect on after-tax property returns is what gives the shift toward listed assets much of its structural logic.
The SMSF and adviser channel as a structural flow engine
The deeper driver is who is buying. Around 2 million Australians now hold ETFs, and roughly 43% of self-managed super funds (SMSFs) use them.
Adoption reaching the self-directed tier Approximately 43% of SMSFs now use ETFs, a signal that institutional-grade allocation tools have become standard among self-directed investors.
That matters because SMSF contributions and adviser model portfolios generate systematic monthly demand that is largely insensitive to short-term market moves. Financial advisers have shifted toward ETF-based model portfolios as much for cost and compliance reasons as for preference, creating a base level of buying that compounds every month regardless of conditions. Passive, market-cap-weighted products absorbed roughly 74% of flows, while active ETFs took 13.6%, and Vanguard’s Australian Shares Index ETF (VAS) recently became the first ASX-listed fund to top $20 billion in assets.
The cyclical and structural forces are now reinforcing each other. That is precisely why consecutive record months look plausible rather than exceptional.
What the risks look like at $382 billion
Once you understand the scale, the natural next question is where the exposure is hiding. Four risks stand out:
- Concentration: broad Australian equity ETFs are heavily weighted to a handful of names
- Valuation: some thematic and ESG products trade above fair value
- Liquidity and structure: thin market-maker coverage can widen spreads under stress
- Tax complexity: new CGT rules complicate investor reporting
Concentration is the sharpest of these. The top ten stocks account for roughly 48% to 50% of the S&P/ASX 200, and the big four banks alone represent about 25% of index weight.
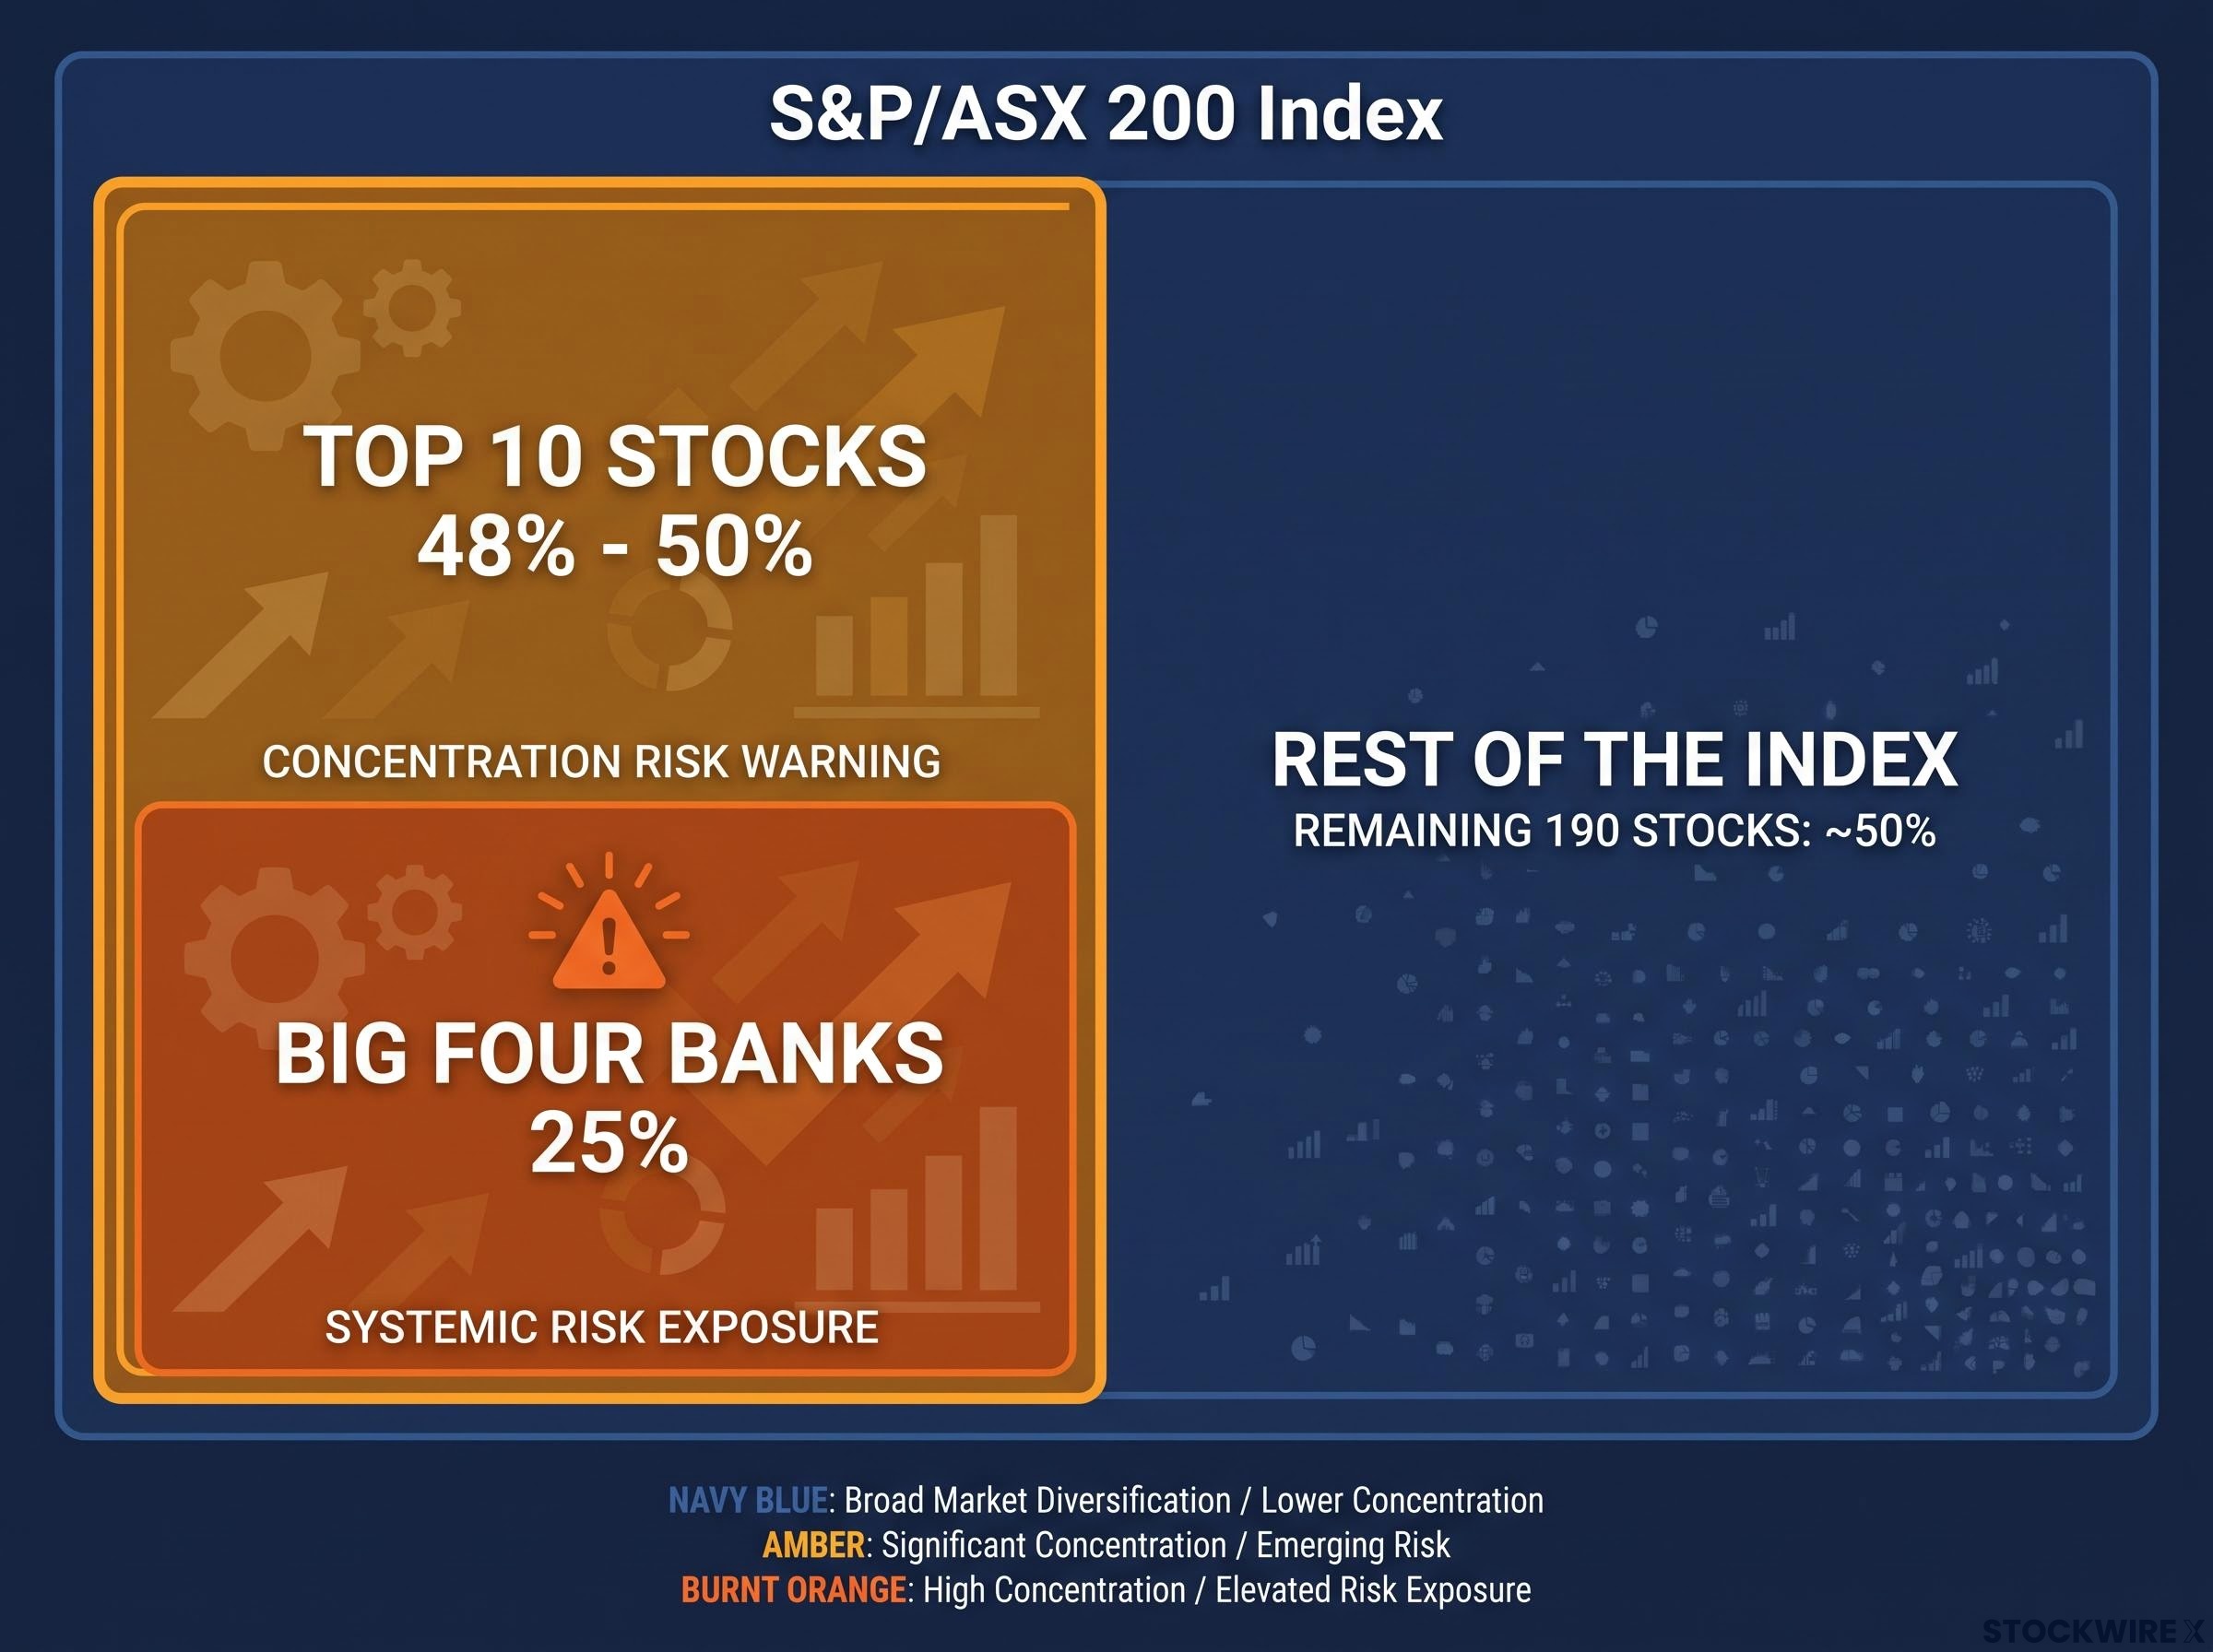
The risk hiding inside apparent diversification Every broad Australian equity ETF allocates close to half its capital to just ten companies. The diversification is more limited than the wrapper implies.
On valuation, Morningstar found the ethical ETF FAIR trading at roughly 1.26 times its estimated fair value, a reminder that the ETF structure offers no protection against overvaluation in the underlying holdings. On liquidity, ASIC Report 583 flags that a low number of formal market makers and exposure to less liquid assets, such as small caps and emerging markets, can widen bid-offer spreads during periods of market stress. The new CGT rules add a layer of complexity too, requiring investors to separate fund-level capital gains from their own personal CGT obligations.
The regulatory baseline remains steady. The Reserve Bank of Australia and ASIC maintain that Australian ETF trading is generally liquid, spreads are moderate, prices track close to net asset value, and no systemic risks have materialised. Still, a market that has grown 27.8% in a year to $382 billion is large enough that concentration and liquidity risks are no longer theoretical. If you hold a broad Australian equity ETF, you should know exactly how concentrated your supposedly diversified position really is.
What August’s record signals about where Australian investing is heading
August is best read as a data point on a trajectory, not a ceiling. With year-to-date flows running 37% ahead of 2025 and the structural drivers, SMSF adoption, adviser model portfolios and CGT reform, all still building, the conditions for further record months remain in place.
There is honest uncertainty in the numbers. Provider AUM estimates diverge by as much as $6.9 billion, which means the exact size of the market is less precise than the headlines imply. The directional story, however, is unambiguous.
The question is no longer whether ETFs dominate Australian investing. That is settled. The live decision is which category exposures and which specific products make sense given the current flow dynamics and the concentration risks identified above.
For your own allocation, the useful variables to watch are:
- Monthly flow data from Betashares, Global X and VanEck for signs of momentum or reversal
- Progress on CGT reform implementation ahead of the 1 July 2027 start date
- International equity performance relative to the ASX
- The active ETF share of total flows as a structural indicator
The market is telling you clearly where conviction is being placed: global diversification via low-cost funds. The worthwhile question is whether your international exposure reflects a deliberate position or simply a default one.
For investors who want to translate the flow data into concrete allocation decisions, our comprehensive walkthrough of ETF portfolio construction for Australian investors covers asset allocation splits, index weighting choices, and the fee arithmetic that compounds across a long investment horizon.
This article is for informational purposes only and should not be considered financial advice. Investors should conduct their own research and consult with financial professionals before making investment decisions. Past performance does not guarantee future results, and financial projections are subject to market conditions and various risk factors.