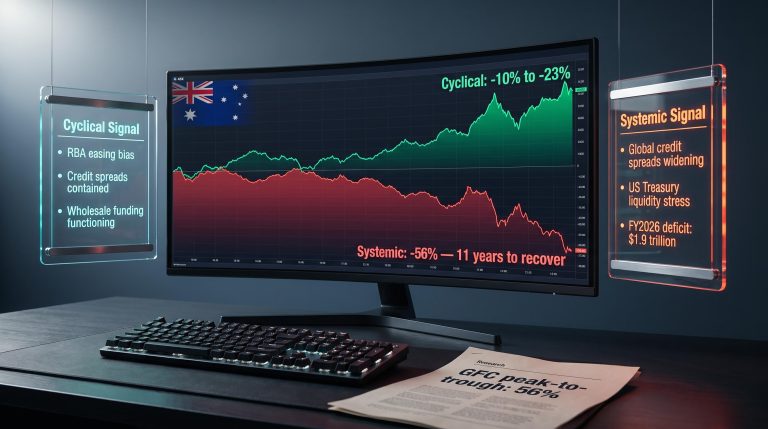
Australia’s major banks collectively account for roughly 30% of the ASX by market capitalisation, and a PE ratio or dividend discount model will hand an investor a number in under ten minutes. The problem is not the maths. The problem is everything the maths ignores. With NAB trading near $37.59 as of May 2026 and sector PE ratios hovering around 18x, retail investors are actively comparing model outputs against live prices. Yet the research community that generates these models consistently flags the same caveat: quantitative outputs are a starting point, not a decision. The qualitative factors that determine whether Australian bank shares outperform, disappoint, or quietly destroy capital over a decade are structural, cultural, and regulatory in nature. What follows is a practical decision framework for evaluating the forces that valuation models cannot price: net interest margin (NIM) trajectory, regulatory constraints on fee income, management culture, and the honest question of whether owning individual bank shares is the right structure at all.
Why the numbers give you a price, not an answer
A clean valuation output inspires a confidence it has not earned. Take NAB’s FY24 figures: an earnings per share of $2.26, a sector average PE of 18x, and the model returns a PE-derived estimate of $40.72 against a trading price of $37.59. The stock looks cheap. Case closed.
Except it is not. A dividend discount model using NAB’s $1.69 dividend produces a base-case valuation of $35.74. Gross up the dividend for franking credits, and the same model outputs $51.66. Adjust the discount rate from 6% to 9% while holding growth at 2%, and the valuation swings from $42.75 to $24.43.
A single stock producing a valuation range of $24.43 to $51.66 depending on assumption selection is not delivering a price target. It is delivering a decision space that only qualitative judgment can narrow.
The NAB analyst consensus range of $29.00 to $48.50 across 14 professionals using the same underlying data reinforces this point: shared quantitative inputs do not produce shared conclusions, because the divergence reflects different qualitative judgements about management credibility, loan-book durability, and NIM trajectory embedded inside each model’s assumptions.
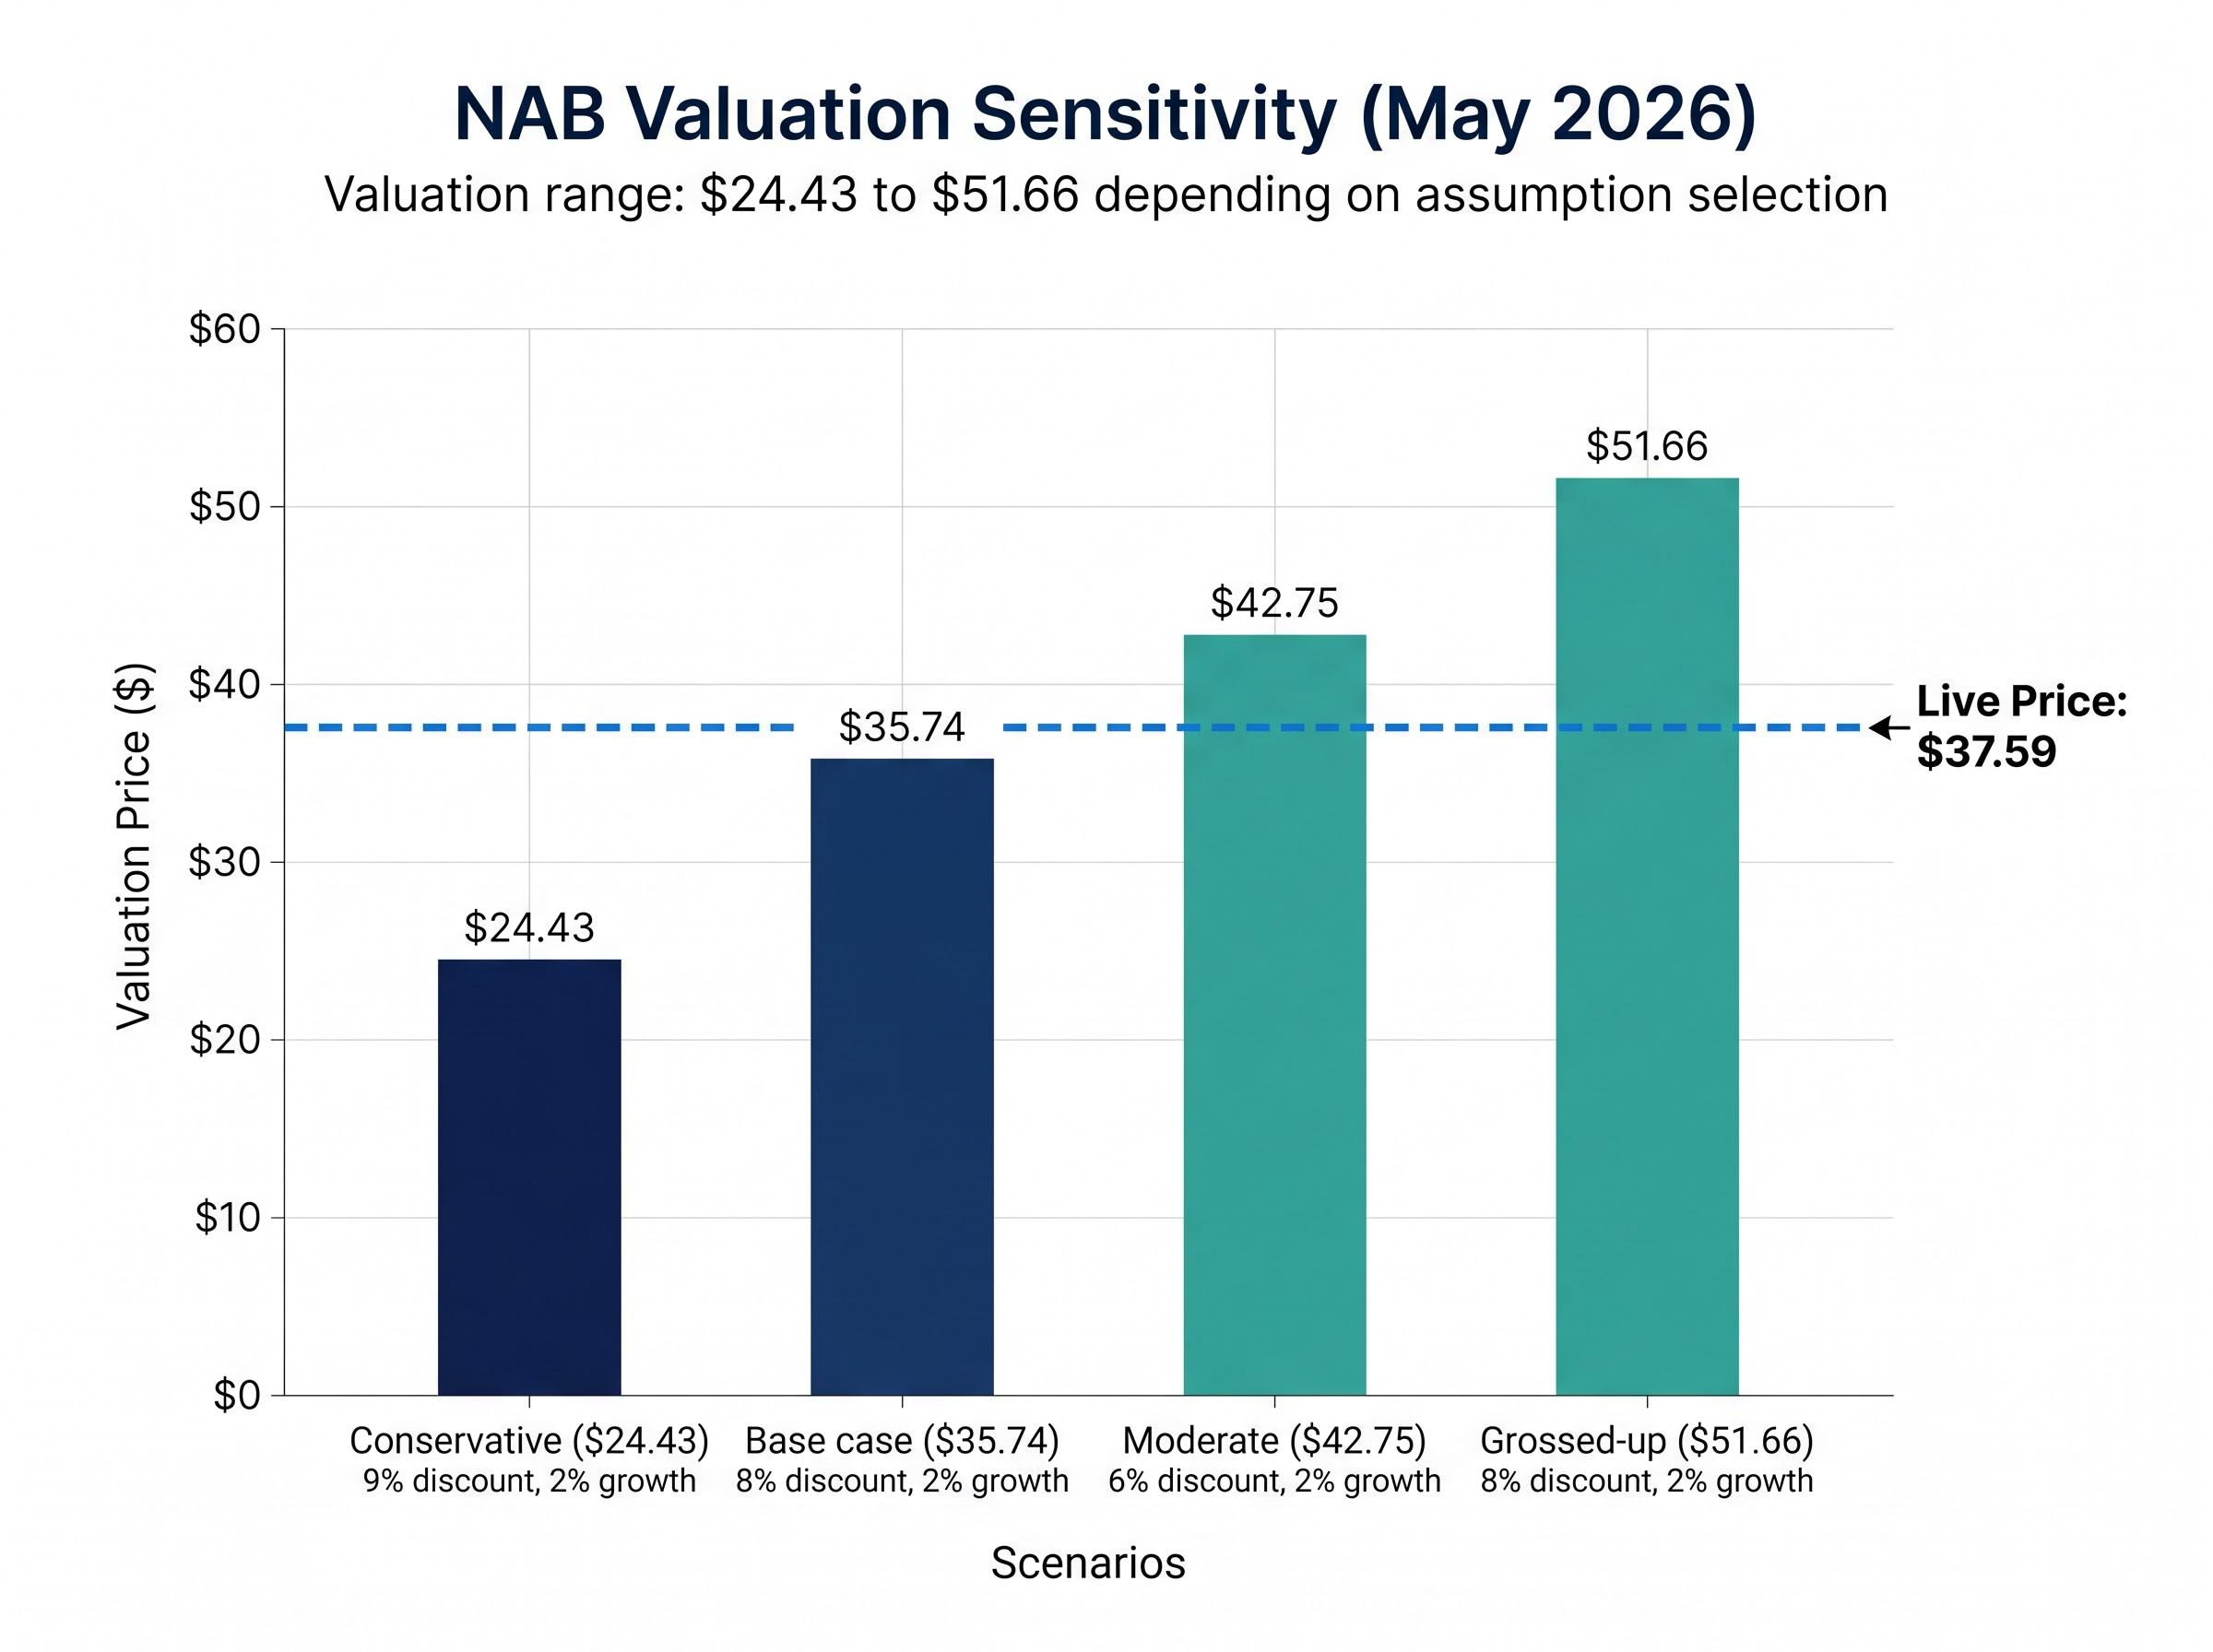
The table below illustrates how sensitive the output is to just two inputs.
| Scenario | Discount Rate | Growth Rate | Valuation |
|---|---|---|---|
| Conservative | 9% | 2% | $24.43 |
| Base case | 8% | 2% | $35.74 |
| Moderate | 6% | 2% | $42.75 |
| Grossed-up | 8% | 2% | $51.66 |
Investors who anchor to a single output risk either overpaying with confidence or dismissing a genuine opportunity because they chose the wrong discount rate. Understanding the range is the first step toward using models correctly.
When big ASX news breaks, our subscribers know first
Net interest margins: the silent driver most retail investors underestimate
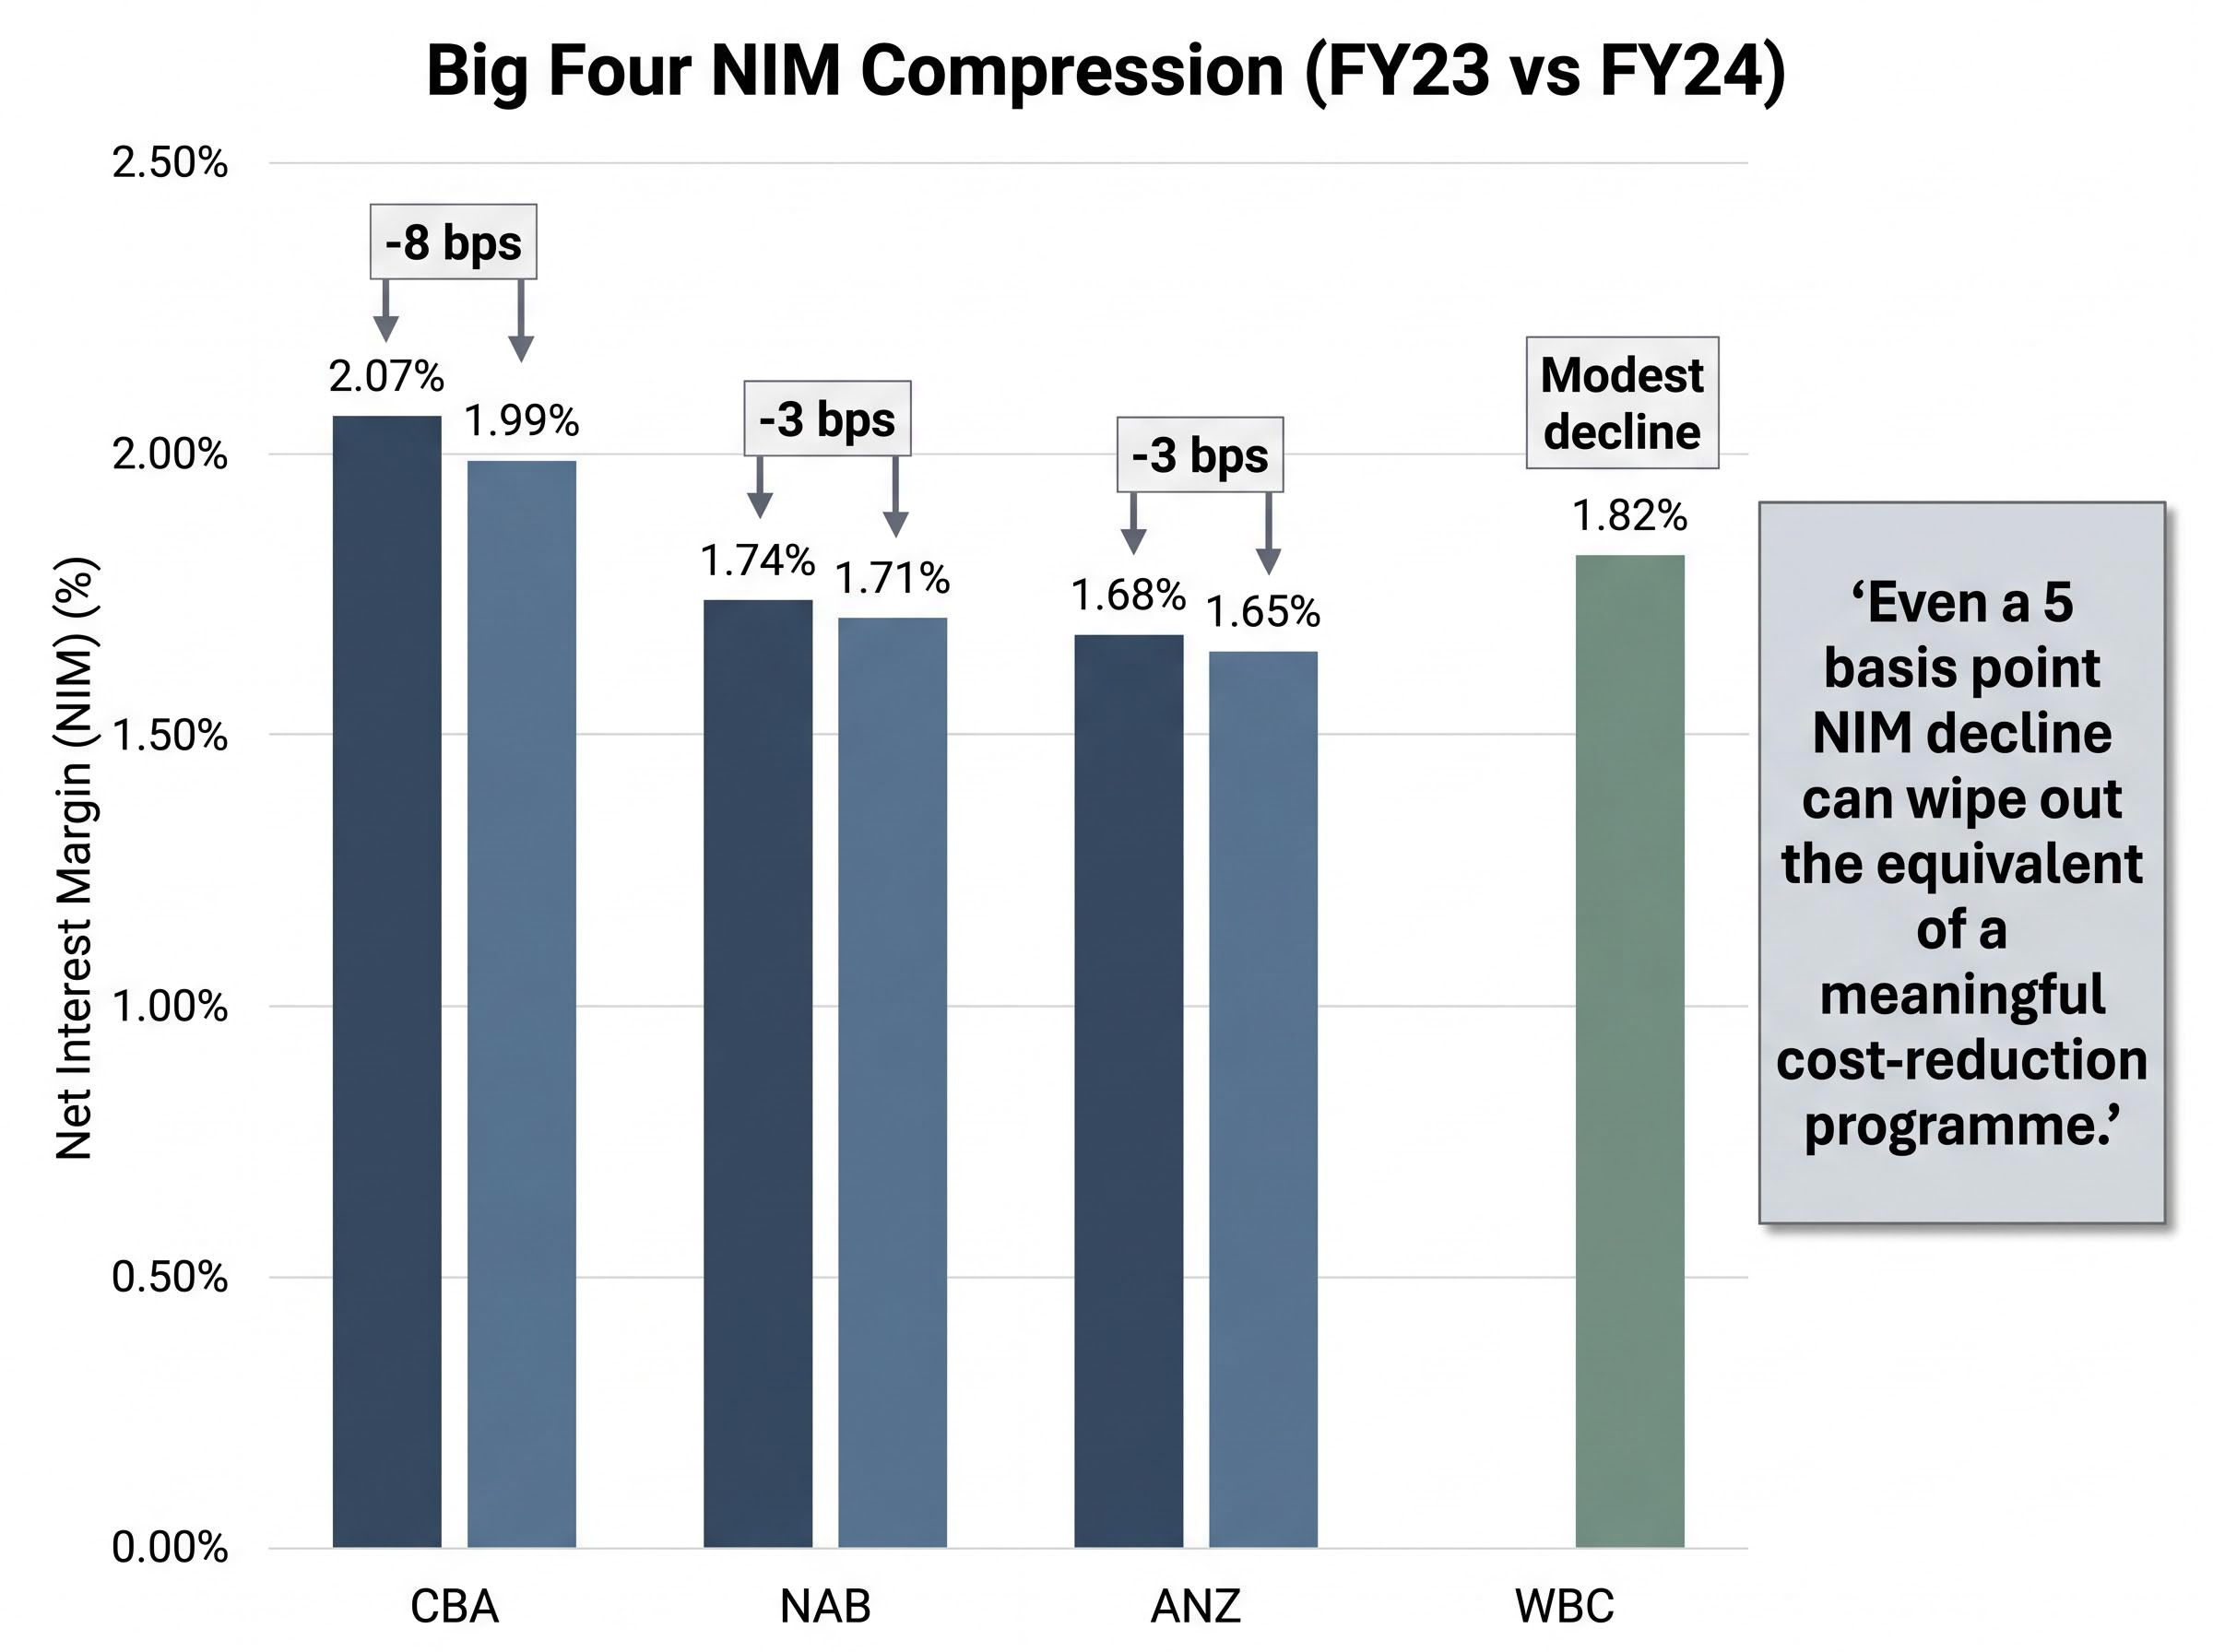
Net interest margin measures the difference between what a bank earns on its loans and what it pays on its deposits, expressed as a percentage of interest-earning assets. It is the primary lever on a bank’s underlying profitability, and in FY24, all four major banks saw it decline.
| Bank | FY23 NIM | FY24 NIM | Change (bps) |
|---|---|---|---|
| CBA | 2.07% | 1.99% | -8 |
| NAB | 1.74% | 1.71% | -3 |
| WBC | n/a (modest decline reported) | 1.82% | Modest decline |
| ANZ | 1.68% | 1.65% | -3 |
The common drivers were consistent: competitive mortgage discounting and higher deposit costs squeezed all four. CBA’s 1Q FY25 trading update described NIM as “broadly stable,” with higher earnings on capital partly offsetting competitive pressure. NAB noted pressure “moderating in 2H24.” Westpac reported NIM “slightly lower than 2H24” but said the rate of compression was easing. ANZ highlighted ongoing compression in its Australian retail division, driven by a shift to lower-margin fixed-rate and owner-occupier loans.
What NIM compression means in dollar terms
A 3-8 basis point swing sounds small. It is not. When applied to a loan book measured in hundreds of billions of dollars, a single basis point change translates to hundreds of millions of dollars in annual net interest income. The exact figures vary by bank, but the order of magnitude is consistent: even a 5 basis point NIM decline can wipe out the equivalent of a meaningful cost-reduction programme.
NIM trajectory, not the current NIM level, is the more relevant forward-looking signal for investors evaluating a holding horizon of ten or more years. An investor who ignores NIM in each results announcement is, in effect, ignoring whether the bank’s core income engine is expanding or shrinking.
NAB’s H1 2026 NIM and ROE figures add current-period context to the FY24 compression data above: NAB reported an H1 2026 NIM of approximately 1.71%, broadly consistent with the FY24 level, while its ROE of 15.2% placed it among the strongest of the big four, illustrating that margin stability and equity returns can diverge in ways that a NIM-only reading would obscure.
The APRA quarterly ADI performance statistics for December 2024 show net interest income, NPAT, and capital adequacy ratios across the sector, providing the regulatory data foundation against which individual bank NIM trends can be benchmarked and evaluated.
The regulatory ceiling on fee income growth
If NIM is under pressure, the natural question is whether banks can diversify earnings through fee income. The answer, post-Royal Commission, is structurally constrained.
Australian banks have largely exited vertically integrated wealth advice, permanently removing a significant source of non-interest income. As the Australian Financial Review reported in June 2024:
The major banks have “largely exited from vertically integrated wealth advice,” limiting future non-interest fee growth.
Three regulatory constraints reinforce this ceiling:
- Conflicted remuneration rules: ASIC’s Enforcement Update REP 774 (March 2024) confirmed continued enforcement on conflicted remuneration and fee-for-no-service in legacy advice and platform fee practices.
- Design and distribution obligations: ASIC’s July 2024 supervision updates restrict aggressive insurance cross-selling through bank channels.
- Credit conduct enforcement: ASIC’s 2024-2025 credit priorities emphasise responsible lending and small-business credit conduct, indirectly constraining fee-based revenue from higher-risk credit products.
No major regulatory reform identified between 2024 and early 2026 re-expands the banks’ ability to earn high-margin advice or fee income. The implication for investors is direct: future earnings growth for the major banks will rely disproportionately on volume-driven NIM income and cost reduction. Investors who expect the banks to diversify their earnings base back toward advice and insurance fees are working from a pre-Royal Commission mental model that no longer applies.
Management culture and governance: the factor that decade-long holders cannot afford to ignore
Banks operate with high leverage, government-backstopped deposits, and the capacity to cause systemic harm. This combination means cultural failures produce losses that can dwarf a decade of earnings. The Royal Commission demonstrated this clearly: remediation bills, AUSTRAC fines, and APRA-imposed capital overlays are not hypothetical risks. They are recent history.
Independent ESG ratings providers reflect the improvements since. MSCI’s 2024 ESG ratings update assigned strong or average governance scores to the majors, noting improved board oversight and risk culture. Morningstar Sustainalytics’ 2024 ESG risk reports rated the big four as low to medium ESG risk, with governance flagged as the most material pillar.
For investors assessing management quality from publicly available information, three questions provide a useful starting point:
- Does management acknowledge specific risks and remediation costs in earnings calls, or does it default to optimistic generalities?
- Is board renewal occurring at a pace consistent with governance reform, or is the same leadership structure that presided over earlier failures still in place?
- What does the bank’s remediation and compliance spend signal about whether cultural change is real or cosmetic?
Where the four majors sit today
CBA (CEO Matt Comyn): characterised as conservative and risk-focused by the Australian Financial Review in August 2024; governance reforms are seen as underpinning the bank’s premium valuation.
NAB: cultural issues “largely stabilised” following the Royal Commission era, though the bank remains under pressure to deliver productivity gains without eroding front-line service culture, according to The Australian (November 2024).
Westpac: still working through risk-culture remediation after earlier AUSTRAC and compliance issues; board and executive renewal and significant compliance spend have been acknowledged, per ABC News Business (November 2024).
ANZ: operational execution challenges around the Suncorp Bank acquisition and technology uplift; commentary describes a more incremental, efficiency-driven culture without acute governance failures, according to Reuters Australia (November 2024).
ESG ratings provide a useful baseline, but they lag real-time conduct developments. Investors holding for a decade or more cannot afford to treat governance as a box-ticking exercise.
VAS versus individual bank shares: the question most models skip entirely
Before spending hours on bank-by-bank valuation models, investors should ask whether the structure of their holding actually delivers a benefit that Vanguard Australian Shares Index ETF (VAS) cannot.
The case for VAS is straightforward. At a management fee of 0.07% p.a., it provides exposure to the S&P/ASX 300 index, capturing bank dividend income alongside miners, healthcare, and industrials. It eliminates single-name risk: a governance failure or capital raise at one bank does not dominate the portfolio.
The trade-off is concentration. As of early 2024, CBA accounted for approximately 7.7% of VAS, Westpac for 4.9%, NAB for 4.5%, and ANZ for 4.0%. Combined, the big four represented roughly 21% of the fund.
Morningstar’s 2024 VAS analysis explicitly warns that the ETF “has a sizeable exposure to the big four banks and resource giants, which can create concentration risk compared with more diversified global portfolios.”
Some investors adopt a hybrid approach: holding VAS for broad diversification and adding individual bank shares to overweight the sector for yield. This is a coherent strategy when the investor has a specific, evidence-based reason to believe one bank will outperform the sector. Without that conviction, the additional complexity adds cost and concentration without a clear benefit.
For investors who want to apply this VAS-versus-individual-bank-shares logic to a specific regional bank case, our dedicated guide to choosing between BEN and VAS walks through Bendigo and Adelaide Bank’s valuation discount, NIM recovery trajectory, and regulatory headwinds against the 0.10% MER alternative, with a four-step decision framework that maps directly onto the monitoring commitment the choice requires.
| Factor | VAS | Individual Bank Shares |
|---|---|---|
| Diversification | Broad (ASX 300) | Single-name exposure |
| Yield access | Sector-blended dividends | Bank-specific dividends |
| Complexity | Low | Higher (ongoing monitoring) |
| Cost | 0.07% MER | Brokerage per trade |
| Concentration risk | ~21% big four exposure | 100% single bank |
The next major ASX story will hit our subscribers first
Building a decision framework that goes beyond the spreadsheet
The four qualitative lenses covered above, NIM trajectory, regulatory ceiling, management culture, and holding structure, are not replacements for valuation models. They are the inputs that tell an investor which assumptions inside the model deserve the most scrutiny.
Before buying any Australian bank share, an investor should be able to answer the following:
- What is the bank’s NIM trend over the last two reporting periods, and is the direction of compression accelerating, stabilising, or reversing?
- What proportion of earnings growth is expected to come from fee income, and is that expectation realistic given post-Royal Commission regulatory constraints?
- Has the bank’s board renewed sufficiently since its last material conduct issue, and does management acknowledge specific risks in earnings calls?
- What is the bank’s current remediation or compliance spend, and what does it signal about unresolved cultural or regulatory issues?
- Does owning this individual bank share deliver a benefit that VAS at 0.07% MER cannot?
- Is the investor’s holding horizon long enough (ten-plus years) to absorb a governance event or NIM compression cycle without forced selling?
Unemployment trajectory and mortgage arrears represent the macro dimension that sits above bank-specific NIM and governance factors: the RBA has identified a sharp rise in unemployment as the primary trigger for materially higher mortgage arrears across the major banks, meaning a decade-long holding view on any Australian bank share implicitly embeds a judgement about the labour market that most valuation models do not make explicit.
The valuation sensitivity range of $24.43 to $51.66 for a single stock is not a flaw in the model. It is the model asking for qualitative inputs to reduce the range. The informal government backstop means banks are unlikely to fail entirely, but that protection does not guarantee returns to shareholders.
For investors with a decade-plus horizon, these qualitative factors will likely matter more to outcomes than whether NAB’s PE ratio is 16.6x or 18x on the day they buy.
The real edge in bank stock investing is knowing what to look for after the model runs
Valuation models are necessary but not sufficient for evaluating Australian bank shares. The quantitative output defines a range; the qualitative factors covered here are where long-run differentiation is made. The practical next step is to pick one qualitative factor from the framework above, whether NIM trend, regulatory constraint, governance signal, or structural suitability, and apply it to a current or prospective bank holding before revisiting the quantitative estimate.
For investors who find this level of ongoing qualitative monitoring unappealing, VAS at 0.07% MER is a rational and respectable alternative. It is not a default for those who cannot be bothered; it is a legitimate structural choice that eliminates single-name risk while still capturing sector income.
This article is for informational purposes only and should not be considered financial advice. Investors should conduct their own research and consult with financial professionals before making investment decisions. Past performance does not guarantee future results. Financial projections are subject to market conditions and various risk factors.