
Softer US inflation should have knocked the US dollar back and lifted the Australian dollar with it. Instead, AUD/USD fell 0.57% on the day. The reason it inverted is the piece of analytical machinery that explains why AUD/USD fell: a central bank’s forward guidance outweighed a single economic data surprise.
This is not a one-off quirk of a quiet trading session. It is a live demonstration of a principle that recurs across major currency pairs. Governor Michele Bullock’s press conference commentary reset expectations for the RBA’s rate path in a way that a softer US inflation print could not counteract.
Read this and you will know how to tell which input, central bank signal or economic data release, is likely to win when the two conflict on the same day. You will also have the specific RBA and Fed context to apply that framework to AUD/USD right now.
The data said dollar down, but AUD/USD went with the RBA
The US inflation numbers landed soft, and on the surface they read as a green light for the Australian dollar. Headline PCE and core PCE both undershot forecasts, while growth held up. This is the kind of combination, prices cooling but the economy still expanding, that usually weakens the greenback and lifts risk-sensitive currencies like the Aussie.
Here is what the print actually contained:
- Headline PCE at 3.4% year-on-year, below the 3.7% forecast
- Core PCE at 3.0% year-on-year, under the 3.3% consensus
- Q2 GDP revised up to 2.2% quarter-on-quarter
The market repriced the Fed almost immediately. Money markets had assigned over 60% probability to a 25 basis point Fed hike before the release. After it, the balance flipped.
Soft PCE prints have not reliably shifted the Fed’s stated path in 2026: August core PCE came in below forecast at roughly 3.0% annually yet the Fed’s multi-year disinflation timeline remained unchanged, a pattern that reinforces why currency markets discount single data releases in favour of the broader guidance signal.
CME FedWatch shift: From over 60% probability of a 25 bp Fed rate hike to approximately 61% probability of no change following the softer PCE data. The data signal pointed toward a weaker dollar. The currency did the opposite.
Then AUD/USD fell anyway. The pair reached a session high of 0.6995, then retreated to trade near 0.6946, a decline of roughly 0.57% on the day. On a session when the numbers should have pushed it higher, it went lower.
That inversion is the whole story in miniature. A 0.57% fall in a major pair on dollar-negative data is not noise. It is evidence that RBA policy expectations were carrying more pricing weight that day than the US inflation figure, and knowing which central bank is the dominant variable is the analytical edge this piece is building toward.
If your instinct was to buy AUD on soft US data and it failed, this is why. The hierarchy of drivers at this point in the cycle had the RBA at the top.
When big ASX news breaks, our subscribers know first
How the RBA’s rate path became the dominant force on AUD/USD
To see why the RBA outweighed the Fed, start with what makes a currency attractive to hold. Investors are paid to hold higher-yielding currencies, a return known as carry, and the size of that reward depends on where interest rates are expected to go. When the odds of future rate hikes fall, the expected yield advantage of holding that currency shrinks, and holders sell.
That is exactly what happened to the Aussie. The trigger was Australia’s own inflation data, not anything out of Washington.
“Softer trimmed mean CPI dampens expectations for further RBA tightening and leaves AUD lagging peers in the near term,” according to Elias Haddad at Brown Brothers Harriman.
Haddad’s framing is the key link. He tied the Australian dollar’s underperformance directly to the repricing of RBA rate expectations, not to global data or risk sentiment. Trimmed mean CPI, the RBA’s preferred measure of underlying inflation that strips out the most volatile price moves, held at 3.6% year-on-year for the third consecutive month. Steady, not re-accelerating, and that steadiness took the pressure off the RBA to hike again.
The trimmed mean held at 3.6% annually through June 2026, beating both market consensus and the RBA’s own May forecast, and trimmed mean inflation has consistently been the measure the Board leans on most heavily when deciding whether further tightening is warranted.
The RBA’s own stance reinforced the message. After hiking to 4.35% and then holding at the August 2026 meeting, the Board described policy as “somewhat restrictive” and projected trimmed mean inflation would not return to the midpoint of target until late 2027. That is a profile where rates stay high for a long time but do not necessarily go higher.
For a currency, high-for-long is very different from higher-still. The former offers a fixed yield; the latter offers a rising one. Markets had been positioned for the rising version, and Bullock’s message dialled that back.
The context is a broader deterioration in the Aussie, not just a single weak session:
| Currency Pair | AUD Monthly Change |
|---|---|
| AUD/USD | -3.18% |
| AUD/JPY | -4.71% |
| AUD/EUR | -0.64% |
| AUD/GBP | -0.99% |
| AUD/CAD | -0.47% |
| AUD/NZD | +1.79% |
| AUD/CHF | +0.18% |
The read for you is direct: when a central bank signals it has probably done enough tightening, the currency loses its yield-premium appeal. That is what the August hold and Bullock’s language communicated on the day AUD/USD fell.
Why forward guidance outweighs single data prints
The asymmetry comes down to what each input reprices. RBA communication emphasises optionality and data dependence, so a single press conference or statement can reset the entire expected rate path, every future meeting at once. A single PCE reading only reprices the odds of the Fed’s very next decision. One moves the whole curve; the other moves one point on it. ANZ has observed the Board appears to prefer changing rates at Statement on Monetary Policy meetings, which is why markets watch RBA meeting-specific signals so intently.
The November debate: ANZ’s contrarian hike case versus the extended-hold consensus
Not everyone agrees the RBA is finished. The market has split into two camps with genuinely different conclusions, and the gap between them is where the near-term direction of AUD/USD will be decided.
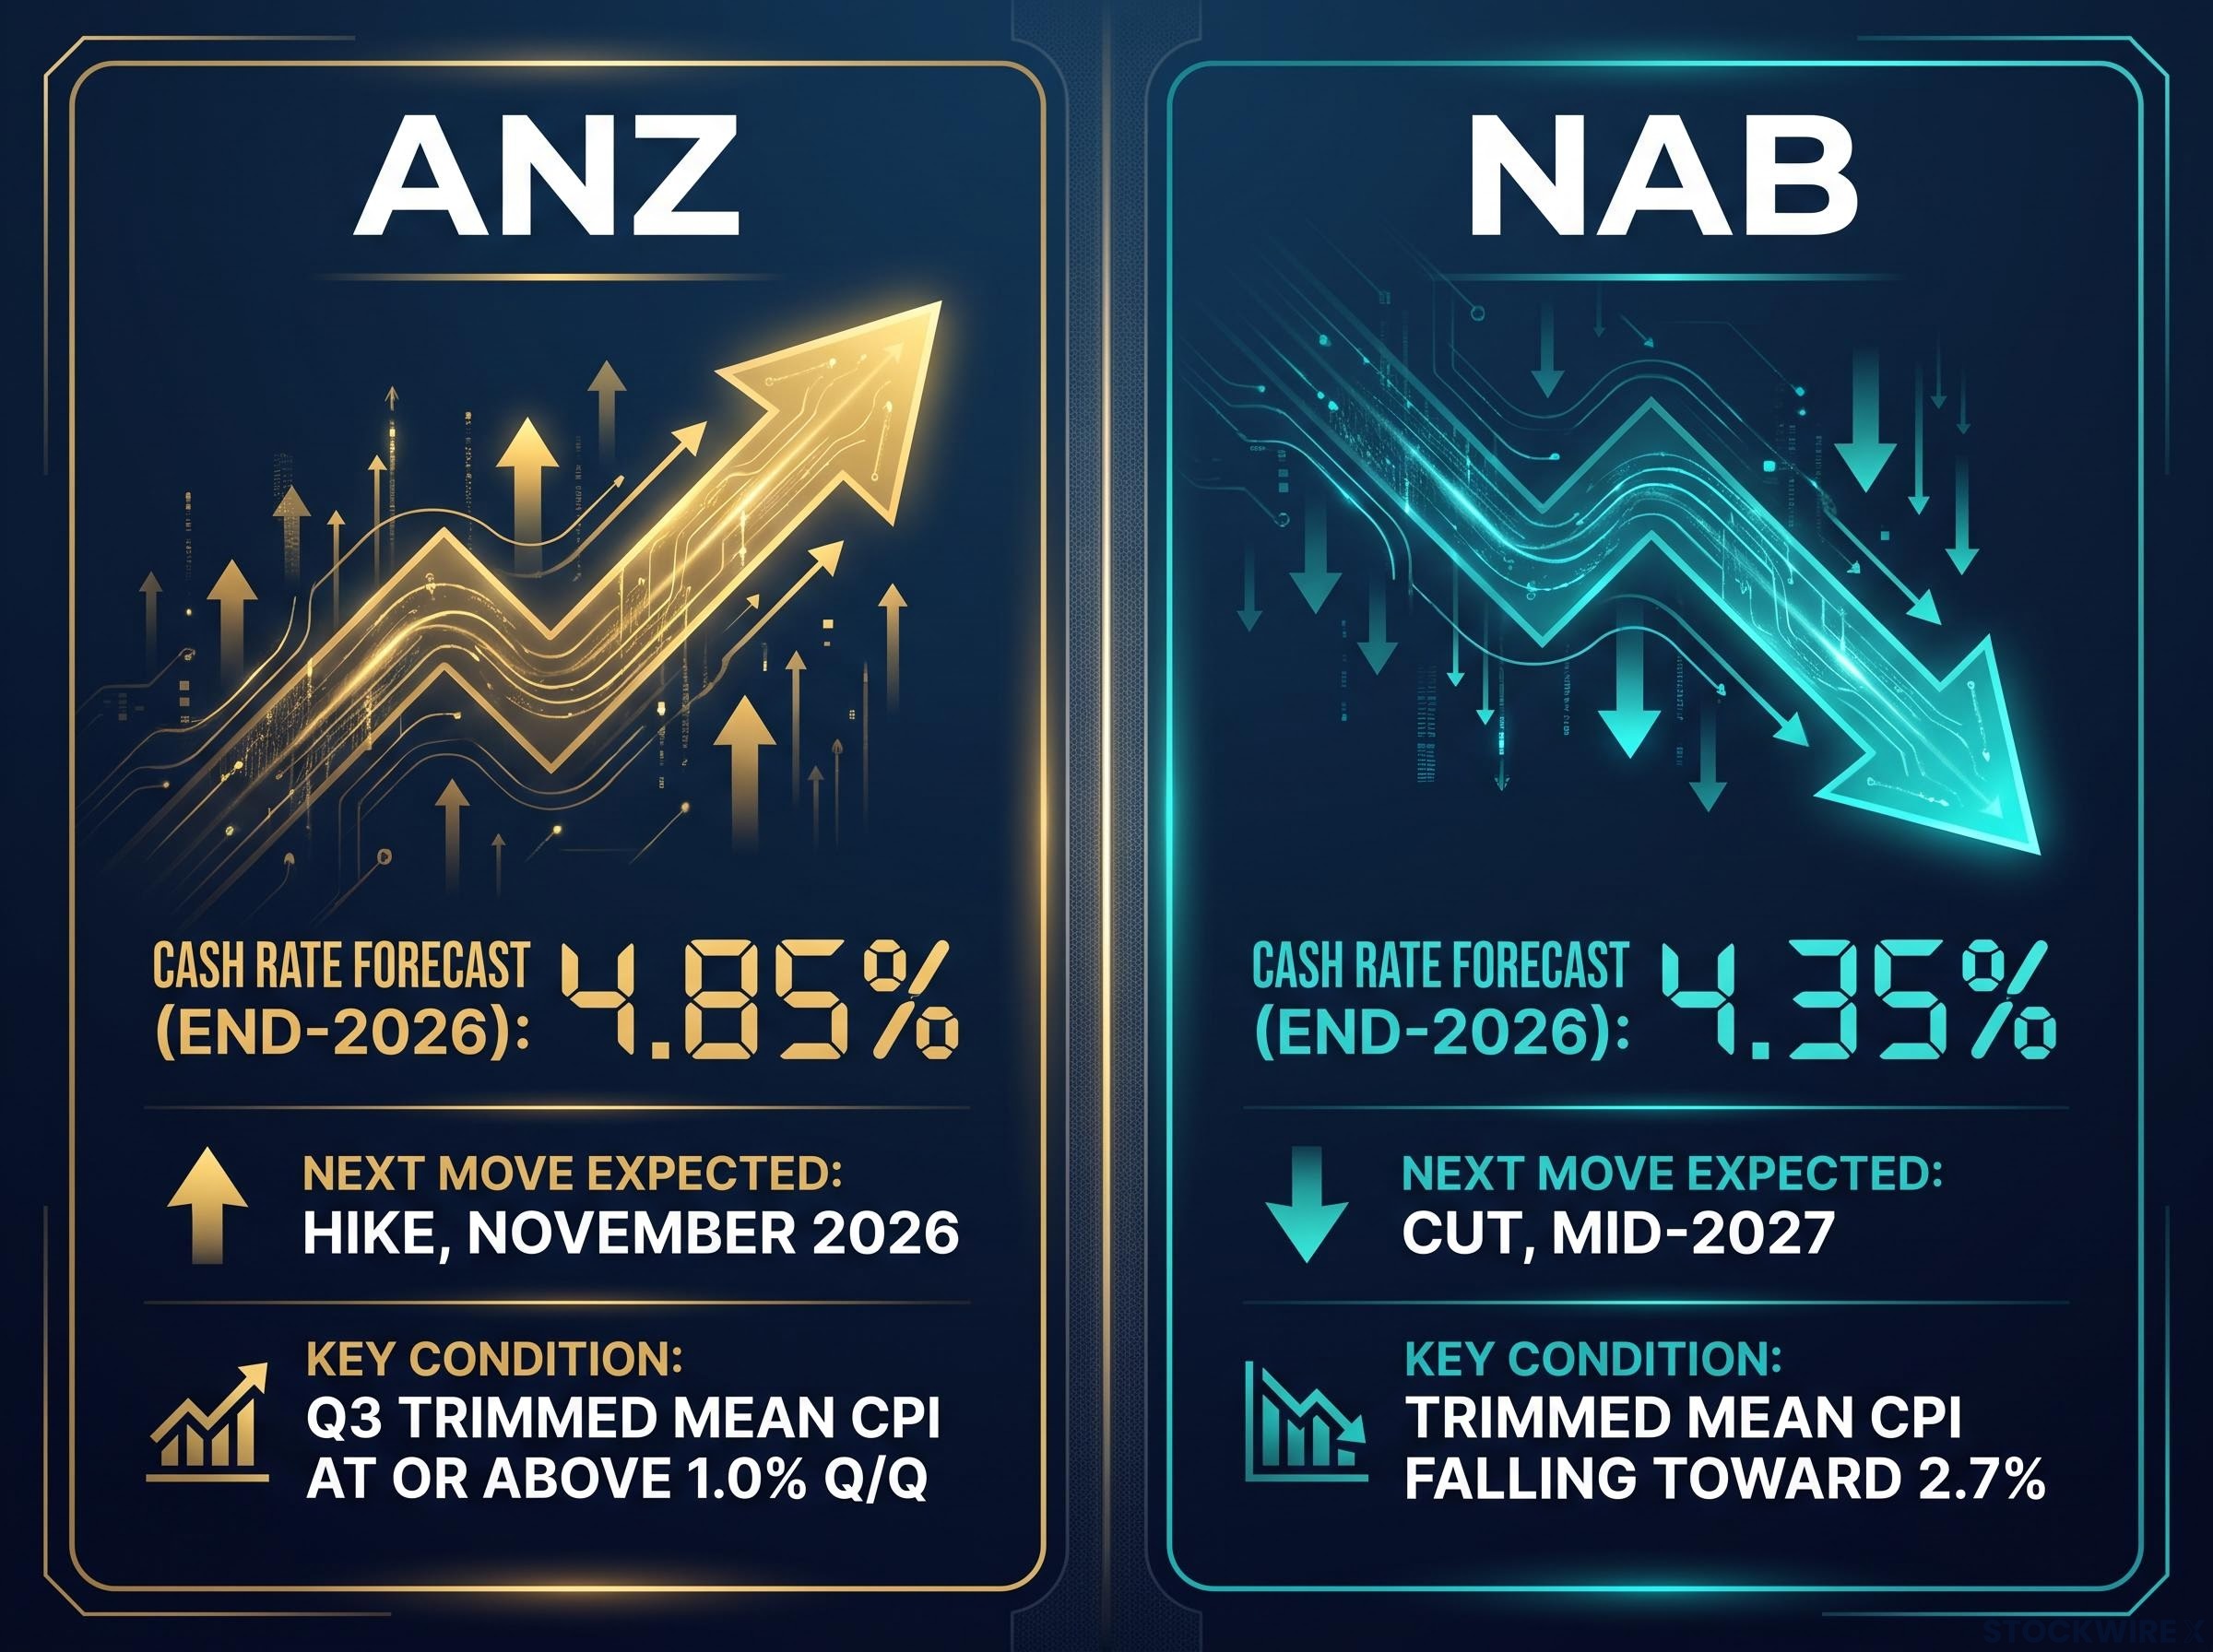
ANZ holds the contrarian hike case. Its analysts project Q3 trimmed mean CPI at 1.0% quarter-on-quarter, which they argue would land as a meaningful upside surprise against the RBA’s own August forecasts and make holding at 4.35% difficult to justify. On that basis, ANZ targets a cash rate of 4.85% after a November hike.
On the other side sits the extended-hold consensus, led by NAB. NAB expects the RBA on hold right through 2026, with the first move being a cut from mid-2027 as trimmed mean CPI gradually eases toward 2.7%. The Aussie.com.au expert survey from September 2026 found most commentators leaning the same way, comfortable that inflation at 3.6% is stabilising rather than climbing.
| Institution | Cash Rate Forecast (End-2026) | Next Move Expected | Key Condition |
|---|---|---|---|
| ANZ | 4.85% | Hike, November 2026 | Q3 trimmed mean CPI at or above 1.0% q/q |
| NAB | 4.35% | Cut, mid-2027 | Trimmed mean CPI falling toward 2.7% |
The honest answer on which case is stronger is that the data will decide it, not the argument. The pivot variable is the Q3 trimmed mean CPI outcome, and ANZ’s 1.0% quarter-on-quarter figure functions as the dividing line between hold and hike.
Conflicting inflation signals have been a recurring feature of the Australian data cycle in 2026, with headline CPI and trimmed mean moving in opposite directions and forcing the Board into a genuine two-way risk posture that neither a hike nor a hold cleanly resolves.
Three factors could tip the balance:
- Middle East fuel cost pass-through, which the RBA flagged in its August SMP as an upside inflation risk.
- The domestic demand trajectory, which NAB argues is soft enough to justify holding before any normalisation.
- The Q3 trimmed mean CPI outcome itself, the single input the Board will lean on most heavily for November.
For anyone tracking AUD/USD, this makes the pair a holding pattern anchored to Australian inflation data. A 1.0% quarter-on-quarter print would likely send AUD/USD sharply higher as markets rush to price a November hike. An in-line or softer reading confirms the extended-hold narrative and keeps the pair under pressure. The next CPI release is close to a binary signal for direction.
What the chart structure says about near-term AUD/USD direction
The chart is sending a two-part signal: the downside is stretched, but the trend is still down. The clearest piece is the momentum reading. The 14-period daily Relative Strength Index (RSI), a measure of how fast and far a price has moved that ranges from 0 to 100, sat near 27, inside oversold territory below 30.
RSI reading: At approximately 27, AUD/USD is oversold, signalling stretched downside momentum. Oversold is not the same as reversing. It flags that the fall has run hard, not that it has ended.
The trend structure explains why oversold has not translated into a rebound. A series of upward-sloping trend lines that once supported the pair have broken and flipped into overhead resistance, so former floors now act as ceilings. Adding to the pressure, a long-term descending trend line originating near 0.8015 continues to cap the pair from above.
That leaves two levels that matter. A daily close below the nearby trend line support at 0.6909 would reinforce the bearish structure and open the door to further downside. To the upside, 0.7051 is the first meaningful resistance the pair needs to reclaim before the technical picture starts to improve.
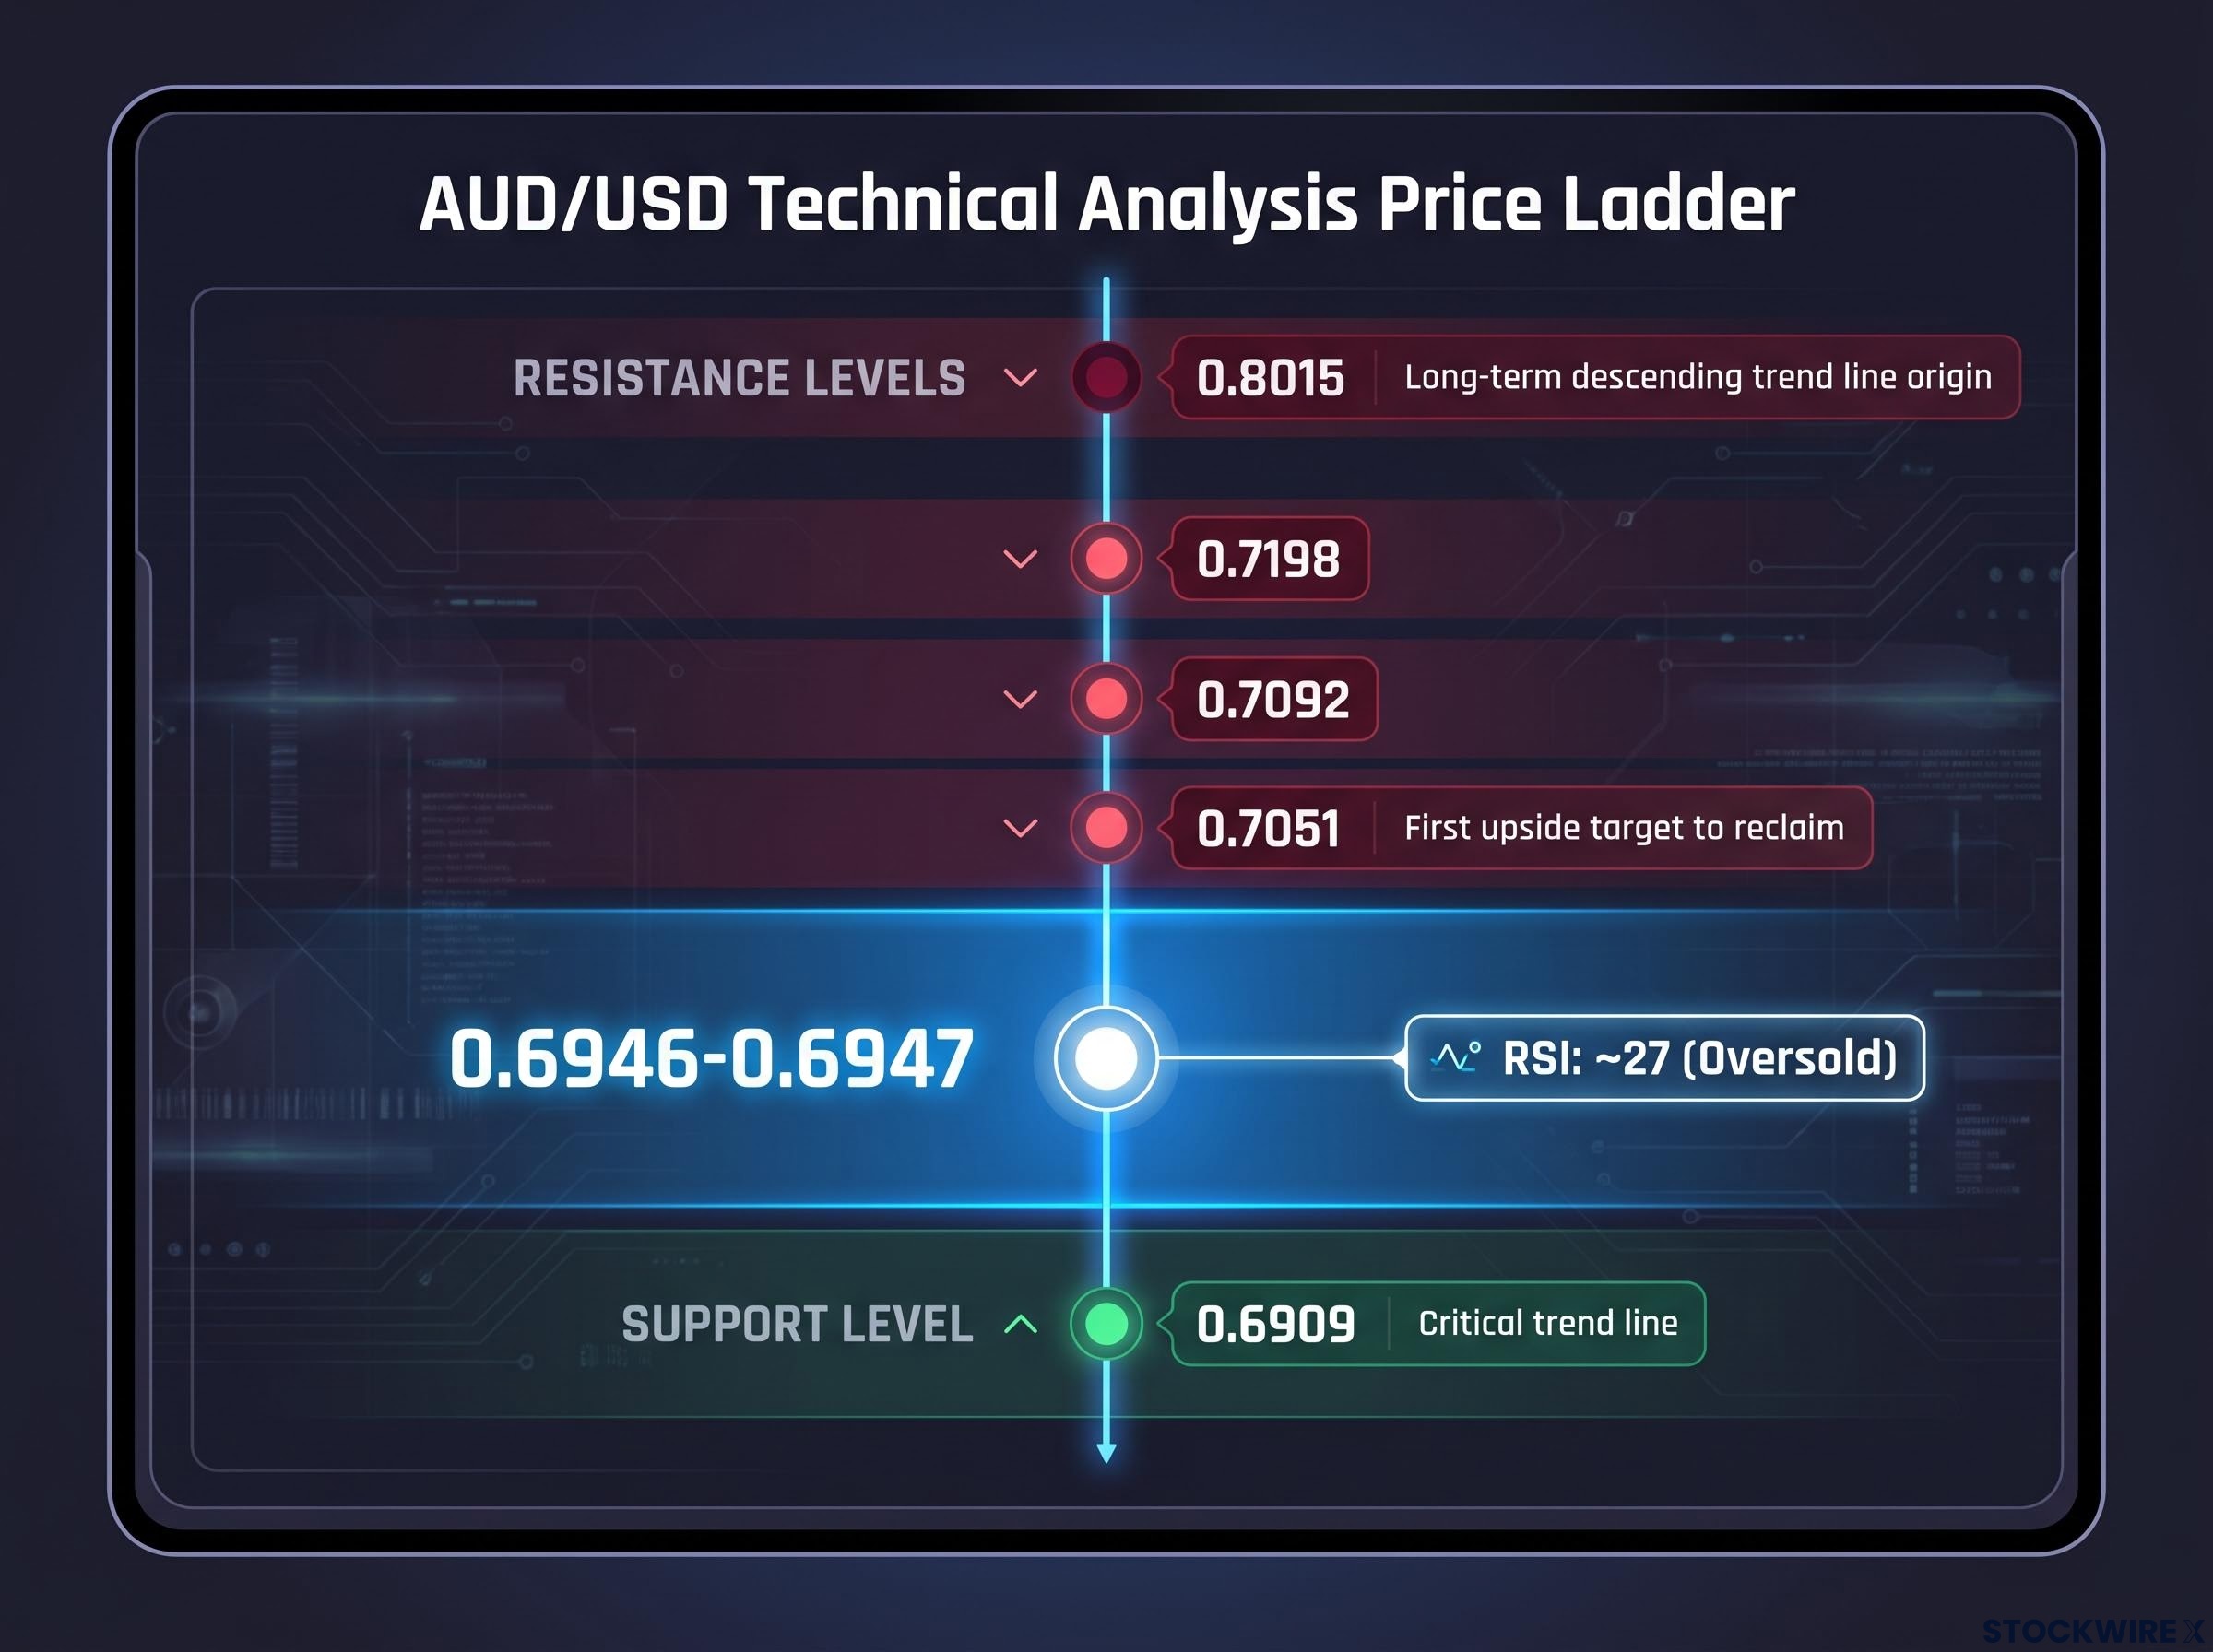
| Level | Type | Significance |
|---|---|---|
| 0.6909 | Support | Critical trend line; close below confirms further weakness |
| 0.6946-0.6947 | Current level | Trading range at time of analysis |
| 0.7051 | Resistance | First upside target to reclaim |
| 0.7092 | Resistance | SMA cluster |
| 0.7198 | Resistance | Next upside level |
| 0.8015 | Resistance | Long-term descending trend line origin |
What this tells you is that even if the macro outlook improved a little, the path of least resistance stays lower until the pair reclaims 0.7051 and holds it. Any relief rally toward that level, given the oversold RSI, reads more as a potential selling opportunity than as evidence the broader trend has turned. Combine that with the policy picture and the two lenses point the same way. (Technical levels move quickly and should be checked against live data before acting.)
Three variables that will decide where AUD/USD goes from here
The argument has run from the session event through the policy mechanism, the institutional debate, and the chart. They converge on a short watch-list, and the items are not equal in weight.
- Q3 trimmed mean CPI and the ANZ 1.0% q/q threshold. A print at or above 1.0% quarter-on-quarter would trigger rapid repricing of a November hike and a likely sharp AUD/USD recovery; a softer reading confirms the extended-hold consensus and keeps the pair under pressure.
- Fed communication and Nonfarm Payrolls. Scheduled Fed speeches and the US jobs report will recalibrate US rate expectations, and any hawkish surprise that lifts Fed hike odds would widen the rate differential against the Aussie and add to the headwind.
- Middle East conflict and fuel cost trajectory. The RBA has explicitly named fuel cost pass-through as an upside inflation risk, so an escalation could push Australian inflation higher and revive the tightening debate (AUD-positive), while de-escalation removes that upside.
The prioritisation matters as much as the list. Watch the Q3 trimmed mean CPI above everything else, because it carries the largest potential repricing impact on AUD/USD in the near term, dwarfing any single Fed speech or weekly data release. Nearer-term Australian releases such as the Trade Balance and Financial Stability Review, alongside US jobless claims, will fill in the picture but not resolve it.
Track those three, in that order, and you are positioned to interpret incoming data rather than react to each release in isolation.
For investors wanting to rebuild their analytical toolkit for a world where Fed communication no longer buffers data surprises, our dedicated guide to rebuilding rate-expectations strategy covers the Warsh communication regime, the new weight carried by each CPI and PCE release, and the portfolio implications of the shift.
This article is for informational purposes only and should not be considered financial advice. Investors should conduct their own research and consult with financial professionals before making investment decisions.
Past performance does not guarantee future results. Financial projections are subject to market conditions and various risk factors, and forward-looking statements from analysts are speculative and subject to change based on incoming data and market developments.