


Cochlear shed 40% of its market value in a single trading session on 22 April 2026. For one of Australia’s most internationally recognised healthcare companies, a profit guidance cut of roughly 30% was enough to trigger the sharpest single-day fall in the stock’s history. It was not alone. Over the three weeks that followed, six more of the ASX’s most widely held large-cap names posted results or trading updates that produced violent share price reactions, spanning banking, consumer staples, consumer discretionary, healthcare, and industrial logistics. This is not a story about one bad result. It is a story about a pattern, one that crossed sector boundaries that would not normally move together, played out against a consumer sector that shifted behaviour from late March onward, and collided with a Reserve Bank of Australia (RBA) rate hike that arrived at the worst possible moment. What follows unpacks the specific numbers behind each disappointment, identifies the threads connecting them, and frames what the late-March consumer inflection and the RBA’s May tightening together mean for the second half of FY26.
A three-week window that rewrote company histories
The scale of the damage becomes clearest when the results are laid out in order. Between 22 April and 18 May 2026, seven ASX large-caps delivered updates that produced single-day share price falls rarely seen in companies of their size.
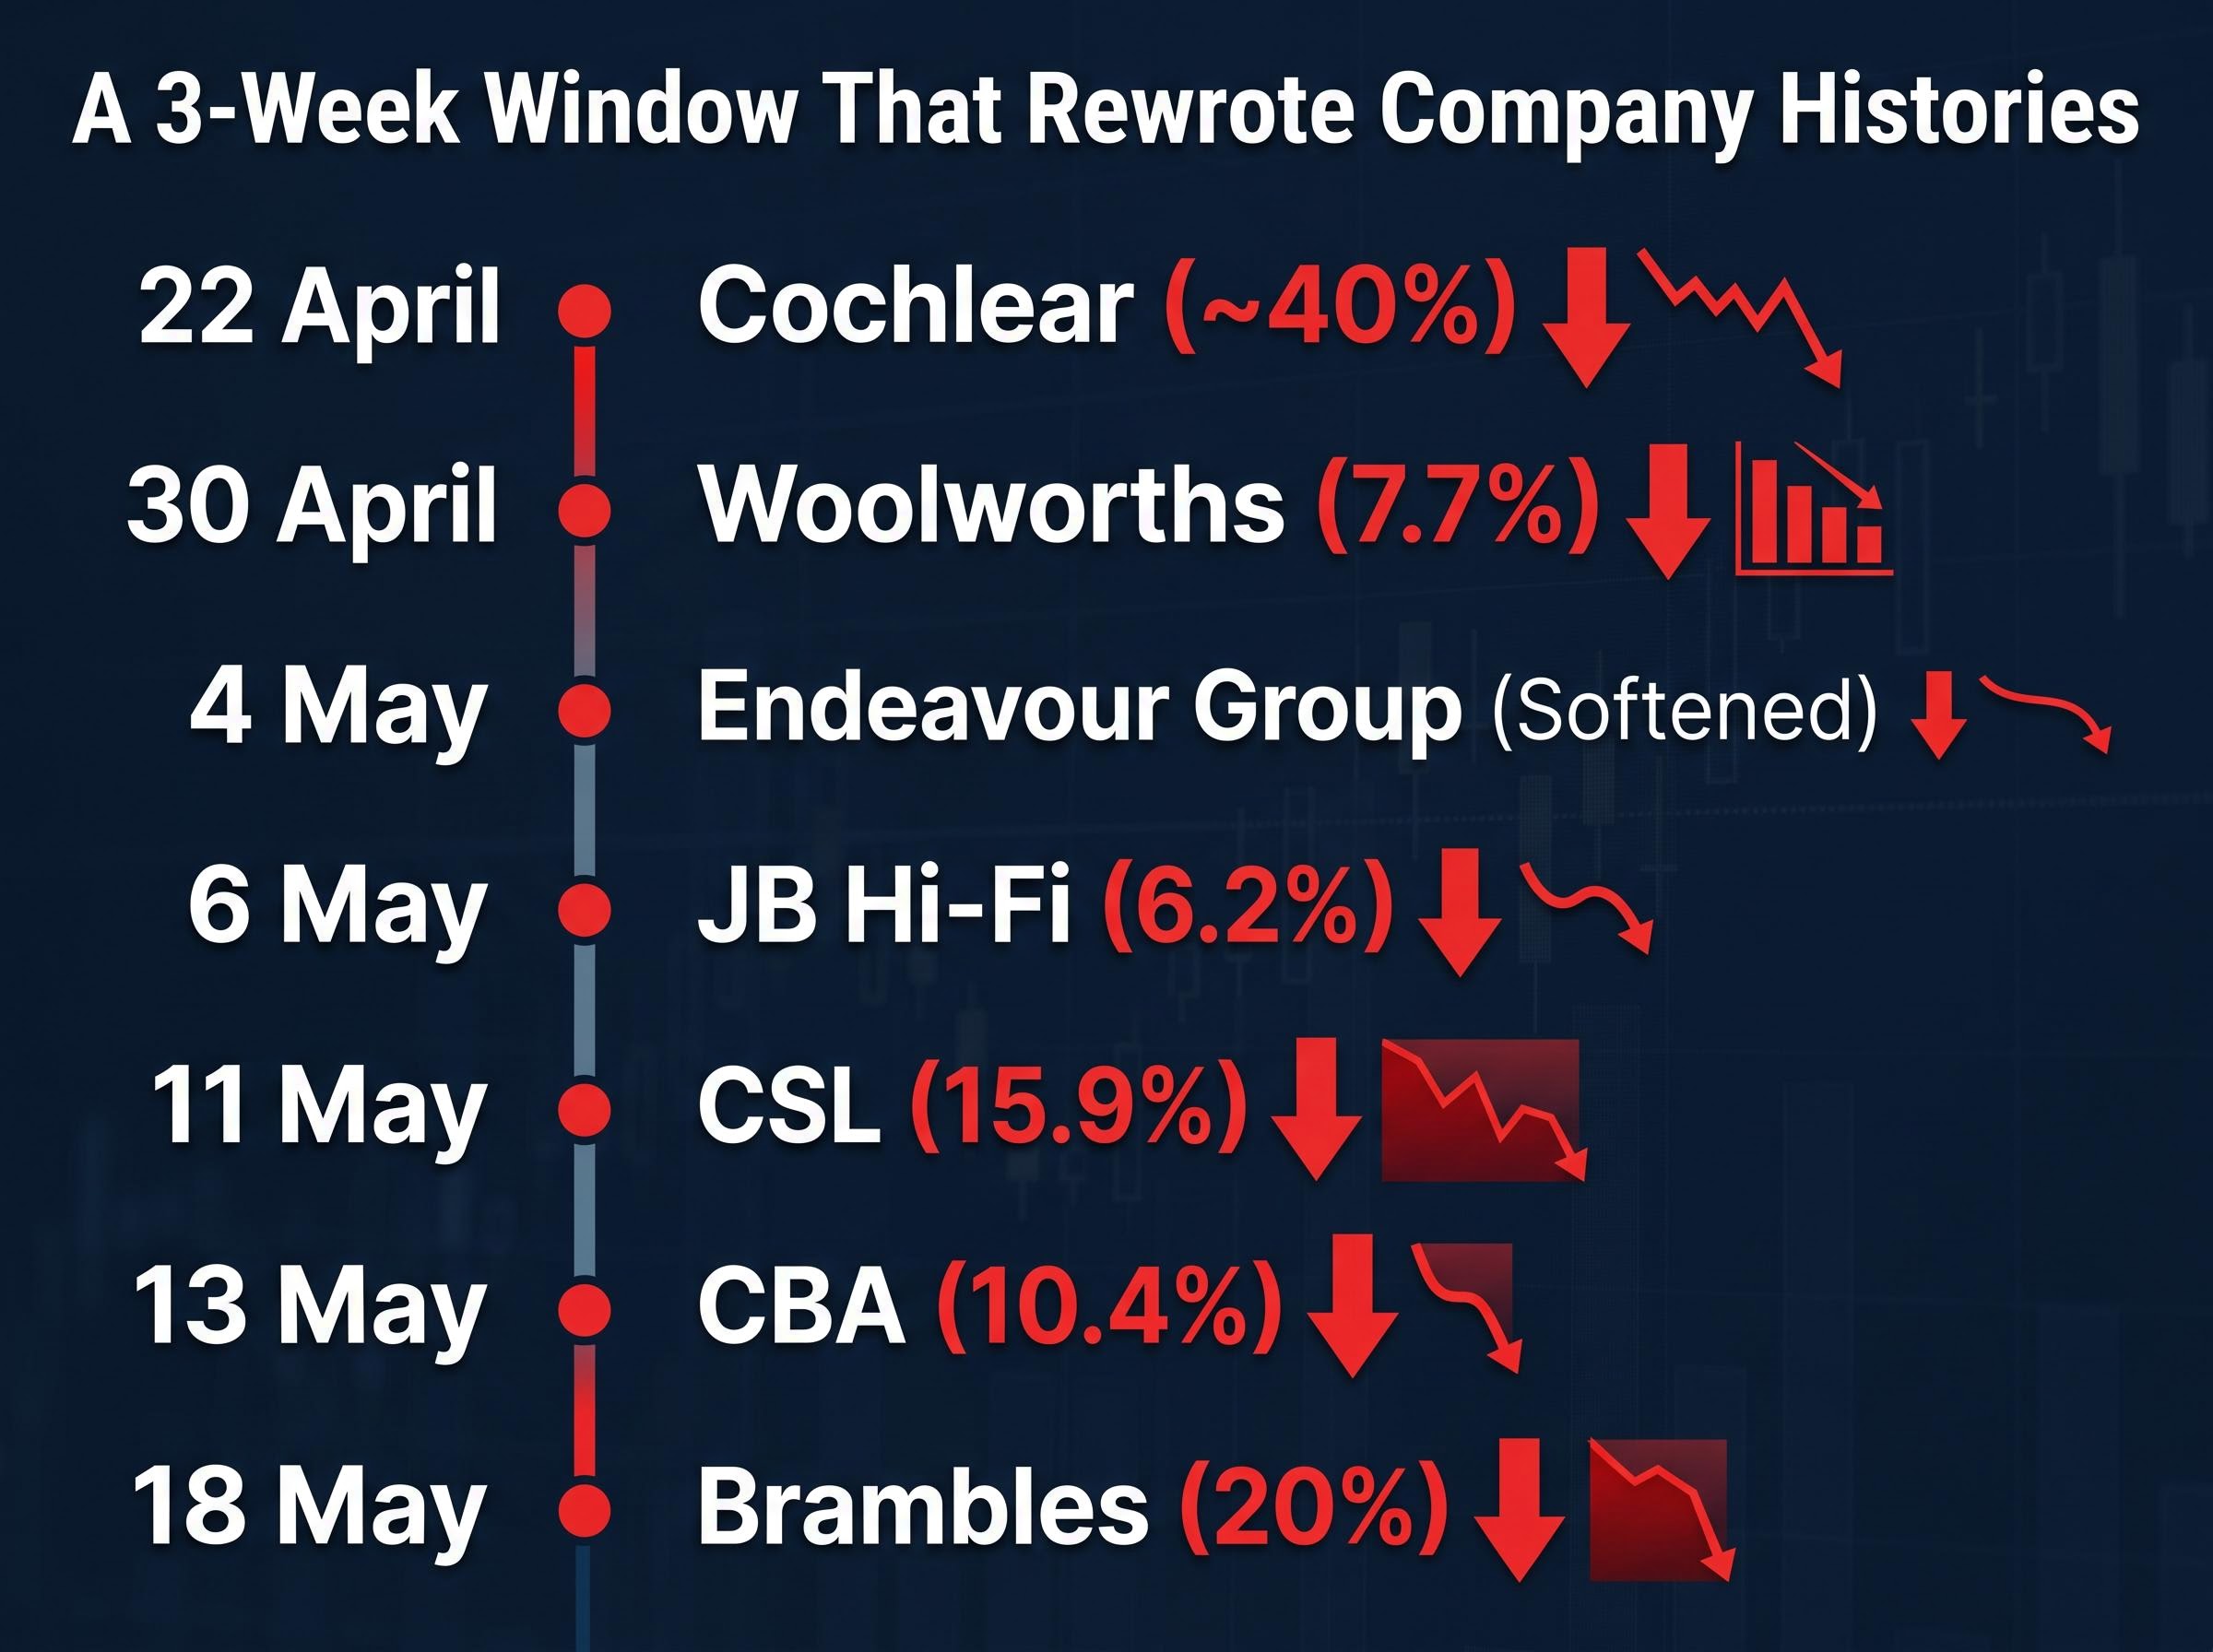
| Company | Date | Single-Day Fall | Key Miss or Cut |
|---|---|---|---|
| Cochlear | 22 April | ~40% | NPAT guidance cut ~30% to $290-330M (from prior low-end of $435-460M) |
| Woolworths | 30 April | 7.7% | FY26 Australian Food EBIT growth guidance pulled back from upper end of mid-to-high single-digit range |
| Endeavour Group | 4 May | Softened | Hotels growth slowed to 1.5% in March-April; $400M inventory build flagged |
| JB Hi-Fi | 6 May | 6.2% | Q3 FY26 comp store growth of 2.6% (JB Hi-Fi Australia) and 2.5% (The Good Guys) |
| CSL | 11 May | 15.9% | Revenue guidance ~$15.2B (4% below consensus); NPATA guidance ~$3.1B (7% below consensus) |
| CBA | 13 May | 10.4% | Q3 cash NPAT ~$2.7B, flat QoQ; $200M added to collective provisions |
| Brambles | 18 May | 20% | Sales growth guidance cut to 2-3% from 3-4%; profit growth cut to 3-5% from 8-11% |
Cochlear opened the window. Woolworths confirmed it was not sector-specific. By the time CSL fell 15.9% and CBA posted its worst day in company history, the pattern had spread from healthcare into banking and consumer staples simultaneously.
CBA’s 10.4% fall on 13 May 2026 represented the largest single-day share price fall in the company’s history.
Brambles closed the sequence on 18 May, losing a fifth of its value on a profit guidance cut that more than halved its growth outlook. By that point, the question was no longer whether individual companies had disappointed. It was whether the market was repricing something broader.
When big ASX news breaks, our subscribers know first
What broke the spell: the late-March consumer inflection
The company updates contained a recurring detail. Across multiple names, the language pointed to the same moment: a visible shift in consumer behaviour from late March onward.
- Woolworths pulled back its FY26 EBIT growth guidance, with the softening concentrated in the period following late March.
- JB Hi-Fi cited heightened competitive pressure alongside supplier cost increases, consistent with a consumer actively trading on price.
- Endeavour Group reported hotels growth slowing to just 1.5% across March and April, a marked deceleration from the prior pace.
- Cochlear flagged developed-market volume softness, consistent with a broader demand-side shift beyond domestic retail.
Each of these references, taken alone, could be dismissed as company-specific. Together, they form a pattern that points to a household sector changing its spending behaviour within a narrow time window.
Why late March, and why now?
The timing aligns with the quarterly variable-rate mortgage reset cycle. For many Australian households on variable rates, March represents a cash flow inflection point as adjusted repayment schedules take effect. With the RBA cash rate at 4.10% entering the period (before the May hike pushed it to 4.35%), mortgage servicing costs were already elevated.
Australia’s inflation drivers in the March 2026 quarter were more concentrated than the headline 4.6% figure suggested: a 32.8% fuel price spike tied to US-Iran supply disruptions, a 25.4% electricity price surge, and accelerating new dwelling construction costs each added independently to household cash flow pressure, compounding the mortgage servicing stress already visible in the late-March consumer spending shift.
The spending shift visible in company data, including trade-down behaviour toward private label and discount channels, is consistent with genuine cash flow stress rather than a softer measure such as declining confidence. Money market pricing as at 14 May 2026 implied at least one additional RBA hike for the remainder of 2026, with approximately 40% probability of a second further increase. The consumer discretionary sector reflected this pressure directly: 85% of ASX 200 Consumer Discretionary constituents had fallen more than 30% from their 52-week highs, and 35% had dropped more than 50%, as of 19 May 2026.
The RBA Financial Stability Review published in March 2026 documented the distribution of variable-rate mortgage exposure across Australian households and the sensitivity of debt servicing costs to incremental rate increases, data that contextualises the spending shift visible in company results from late March onward.
The breadth problem: when defensives and cyclicals fall together
The most striking feature of this reporting window is not that consumer-facing companies disappointed. It is that they did so at the same time as names that investors typically hold precisely because they are not consumer cyclicals.
CBA, CSL, and Cochlear are defensive or quality-growth holdings. Their simultaneous disappointment alongside Woolworths, JB Hi-Fi, and Endeavour Group breaks the normal pattern in which defensive earnings provide a counterweight when cyclical earnings soften. When both sides of a portfolio weaken at once, the headwinds are either macro-systemic or broad enough across individual sectors to appear systemic.
As of 19 May 2026, 84.5% of ASX 200 constituents were trading at least 10% below their 52-week highs.
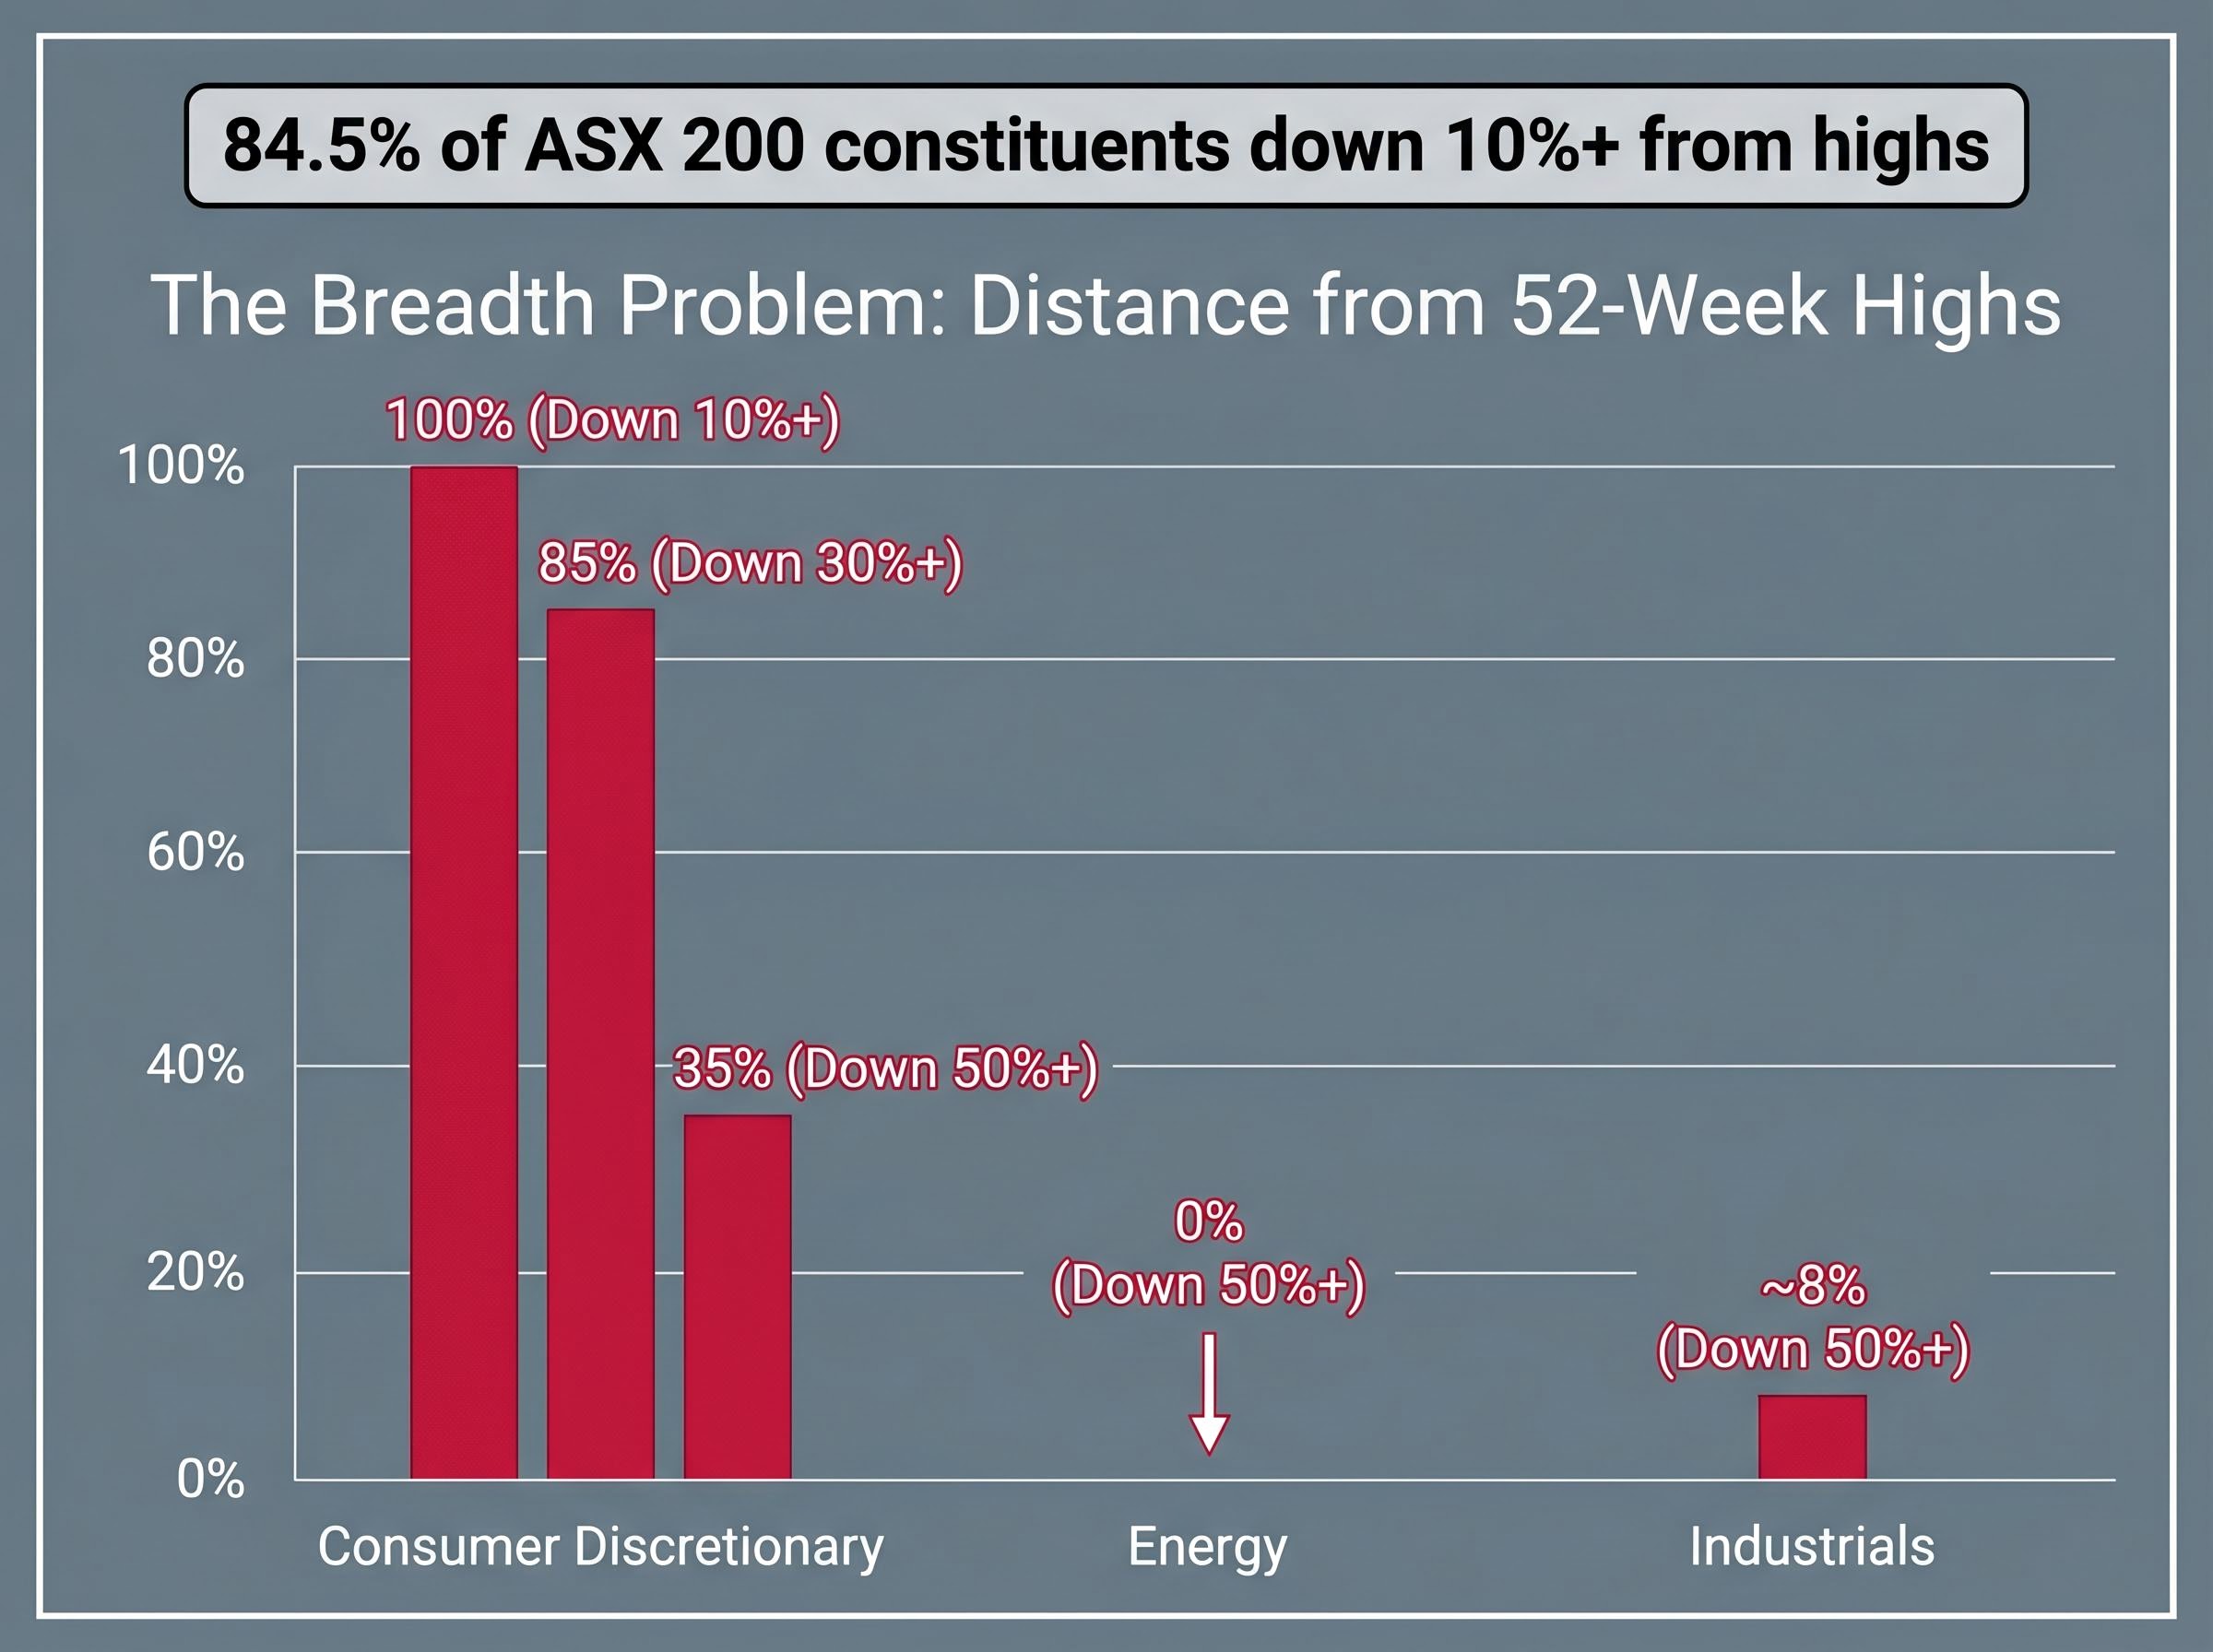
The headline index figure obscured the extent of the damage. The ASX 200 was down approximately 2% year-to-date and had returned only 2.8% over the prior 12 months as of 20 May 2026. Beneath that surface, roughly 39.5% of constituents were down more than 30% from their 52-week peaks. Approximately 11.5%, close to one in eight, had fallen more than 50%.
ASX market breadth had already begun deteriorating before the heaviest falls in this sequence: in the week ending 1 May 2026, 22 index constituents hit 52-week lows even as the headline ASX 200 fell just 0.65%, a divergence between surface index performance and underlying stock-level damage that foreshadowed the more severe repricing that followed.
| Sector | Down 10%+ from High | Down 30%+ from High | Down 50%+ from High |
|---|---|---|---|
| Consumer Discretionary | 100% | 85% | 35% |
| Technology | 100% | Majority | Significant |
| Health Care | 100% | Majority | Significant |
| Energy | Partial | Low | 0% |
| Industrials | Partial | Low | ~8% |
Consumer Discretionary, Technology, and Health Care were the three sectors in which every single constituent traded more than 10% below its 52-week high. Energy stood at the other end: no Energy stock had fallen more than 50% from its peak, and only 8% of Industrials members had reached that threshold.
How stretched multiples turned earnings misses into historic single-day falls
The magnitude of the falls, a 40% session for Cochlear, a 15.9% session for CSL, requires more than the earnings misses alone to explain. The mechanism that amplified moderate guidance cuts into historic single-day collapses is valuation compression, and it works in a specific, predictable way.
- A company trades at a high forward price-to-earnings (P/E) multiple, meaning its share price already reflects expectations of strong future earnings growth.
- A downgrade to the earnings estimate reduces the denominator in that ratio. The share price must fall to recalibrate to the new, lower earnings base.
- At higher multiples, the same percentage earnings cut produces a proportionally larger dollar fall in the share price than it would for a company trading at a lower multiple.
- When many investors hold the stock precisely because of its premium-quality status, forced selling accelerates the repricing, as institutional mandates and stop-loss thresholds trigger simultaneously.
CSL, Cochlear, and CBA: premium multiples meeting downgraded reality
CSL entered the reporting window as one of Australia’s highest-valued healthcare names. Its revenue guidance of approximately $15.2 billion landed 4% below consensus, while its NPATA guidance of approximately $3.1 billion came in 7% below. The company also flagged $5 billion in non-cash pre-tax impairments across FY26 and FY27, with US immunoglobulin channel destocking accounting for approximately $300 million, China albumin pricing for approximately $200 million, and other headwinds for approximately $150 million. The 15.9% single-day fall reflected both the earnings miss itself and the simultaneous de-rating of the forward multiple.
Cochlear’s NPAT guidance cut of approximately 30% (to $290-330 million, with restructuring costs of $18-25 million) hit a stock priced for continued premium growth. The result was a 40% fall.
CBA’s flat quarterly earnings and $200 million provision build would, at a lower price-to-book ratio, have produced a meaningful but manageable reaction. At the historically elevated multiples CBA had reached, the 10.4% fall became the largest in the bank’s history. Brambles followed the same pattern: an approximately $60 million earnings impact from US repair capacity limitations, paired with a profit growth guidance cut from 8-11% to 3-5%, produced a 20% fall.
This article is for informational purposes only and should not be considered financial advice. Investors should conduct their own research and consult with financial professionals before making investment decisions.
What the RBA’s May hike adds to an already-stressed earnings picture
The RBA raised the cash rate by 25 basis points to 4.35%, effective 6 May 2026.
The Board met on 4-5 May 2026 and delivered a hike that, in isolation, was modest. In context, the timing was significant. The increase arrived as company after company was already reporting that consumers had shifted behaviour from late March, meaning the policy tightening landed into a household sector that had begun to retrench before the rate rise took effect.
The RBA’s May rate decision drew eight of nine Board votes in favour of the hike, with the single dissent signalling that the threshold between hiking and holding had narrowed considerably; the Board’s forward guidance language preserved full optionality, committing neither to a pause nor to a fourth hike, leaving Q2 CPI and labour market data as the pivotal inputs before July.
ASX 30-Day Interbank Cash Rate Futures, as at 14 May 2026, priced an 87% probability of no change at the June meeting and a 13% probability of a further 25 basis point hike to 4.60%. That residual tightening risk, combined with money market pricing implying at least one additional hike later in 2026, keeps a layer of pressure on earnings-sensitive multiples even if June passes without action.
The transmission channels most relevant to the companies in this analysis are:
- Mortgage cash flows: Higher repayments compressing household discretionary spending, visible in Woolworths, JB Hi-Fi, and Endeavour Group results.
- Corporate debt refinancing costs: Rising rates increasing the cost of rolling over existing debt facilities, relevant to capital-intensive businesses like Brambles.
- AUD-driven import cost pass-through: Currency and rate dynamics affecting input costs for companies exposed to global supply chains.
The US 30-year Treasury yield simultaneously sat at its highest level since 2007, reinforcing a global rates backdrop that offered no external relief.
What comes next for Australian investors navigating the second half of FY26
Two variables will most meaningfully alter the current trajectory. The first is whether consumer spending patterns stabilise after the late-March shift, something that will only become visible in upcoming Q4 FY26 trading updates. The second is a confirmed pause in the RBA tightening cycle beyond June.
The breadth data suggests the repricing is already well advanced in some sectors. Consumer Discretionary, with 85% of constituents down more than 30% from highs and 35% down more than 50%, has absorbed severe valuation damage. Energy, where no constituent has fallen more than 50% from its peak, remains structurally insulated by the commodity price and supply-disruption environment.
The systematic scan of ASX stocks in confirmed downtrends as of 20 May 2026 identified 33 securities with 15 flagged for the most intense supply-side pressure, including names carrying dual-signal declines exceeding 50% over one year, a list that extends the damage visible in this analysis well beyond the seven large-cap results discussed here.
Australia’s relative absence from the artificial intelligence-driven growth theme that has supported US, South Korean, and Taiwanese equity markets represents a structural rather than cyclical headwind for the ASX, limiting the index’s ability to recover on sentiment alone.
The signals that would change this picture
Investors monitoring the weeks ahead should watch for:
- Q4 FY26 trading updates from consumer-exposed names: stabilisation or further deterioration in comparable sales growth will indicate whether the late-March inflection was temporary or the start of a sustained downturn.
- The June 2026 RBA decision: confirmation of the 87% no-change expectation would remove one layer of uncertainty; a further hike would compound it.
- Inflation data releases: evidence of peaking inflation would support the case for a policy pause and reduce the probability of further tightening.
- Consumer sentiment readings: a recovery from current levels would suggest households are adapting to higher rates rather than retrenching further.
The ASX 200’s 2.8% 12-month return as of 20 May 2026 provides the baseline. Whether current prices have adequately repriced the earnings reality depends on whether the next round of updates confirms that late March was a turning point, or merely the first chapter.
Past performance does not guarantee future results. Financial projections are subject to market conditions and various risk factors.
How a bruising earnings season laid bare the damage beneath the headline numbers
The April-May 2026 reporting window delivered three findings that, taken together, carry weight beyond any individual result. Defensives and cyclicals disappointed simultaneously, breaking the normal offsetting pattern that diversified portfolios rely on. A consumer inflection from late March appeared independently across multiple company updates, pointing to a demand shift driven by cash flow stress rather than sentiment alone. And stretched valuations amplified moderate earnings misses into some of the largest single-day falls in ASX large-cap history.
The headline ASX 200 figure, down approximately 2% year-to-date, is a poor guide to the condition of the market beneath it. With 84.5% of constituents trading more than 10% below their 52-week highs, the gap between the index and the average stock has rarely been wider. As Q4 FY26 trading updates arrive in the weeks ahead, the frameworks above offer a lens for interpreting them: not as isolated results, but as data points in a pattern that this earnings season made visible.
This article is for informational purposes only and should not be considered financial advice. Investors should conduct their own research and consult with financial professionals before making investment decisions.






