ASX SEMI Returned 148%: Is the Semiconductor Thesis Still Intact?
8 hrs ago


The RBA raised the cash rate to 4.35% on 5 May 2026, and within days BetaShares updated the yield on its AAA High Interest Cash ETF to 4.43% net of fees. That single figure now exceeds the forward dividend yields of Commonwealth Bank, Telstra, and Wesfarmers simultaneously, a combination that has not occurred in recent memory. The confluence is no accident: the ASX sitting near all-time highs has compressed equity dividend yields at precisely the moment a rate-hiking cycle has pushed cash returns in the opposite direction. For income-focused investors weighing an ASX cash ETF against blue-chip dividends, the gap has narrowed to the point where the comparison demands serious attention. What follows is a layered analysis of what AAA actually pays, how it stacks up against its cash ETF peers and major income stocks, how Australian tax treatment reshapes the real numbers, and what the long-term trade-off looks like for investors deciding where to allocate income exposure right now.
AAA holds Australian dollar interest-bearing bank deposit accounts and distributes income monthly. Its performance is benchmarked against the 1-month Bank Bill Swap Rate (BBSW1M), not the RBA cash rate directly, which means its yield moves with short-term interbank rates rather than tracking the headline policy rate one-for-one.
The distinction between how the yield is reported and what an investor actually receives matters. The three most recent monthly distributions illustrate the income cadence:
Simple annualisation of the May distribution (17.23 cents multiplied by 12, divided by a $50.10 NAV) produces a figure of approximately 4.13%. That is not the number BetaShares reports. The fund’s stated effective yield, 4.43% net of its 0.18% management fee, reflects the current deposit rate the fund is earning on its underlying holdings rather than the mechanical annualisation of a single month’s payment.
4.43% net of fees, updated 8 May 2026
That update followed the RBA’s 5 May rate increase and marked an uplift from 4.30% the prior month. The NAV has remained stable in the $50.10-$50.13 range, confirming the capital-preservation profile. For income investors, the 4.43% effective rate is the more relevant figure when assessing current income potential.
The yield uplift on AAA from 4.30% to 4.43% followed directly from the third consecutive RBA hike on 5 May 2026, a decision where eight of nine Board members voted to tighten despite a single dissent that signalled the gap between hiking and holding is narrower than the headline margin implies.
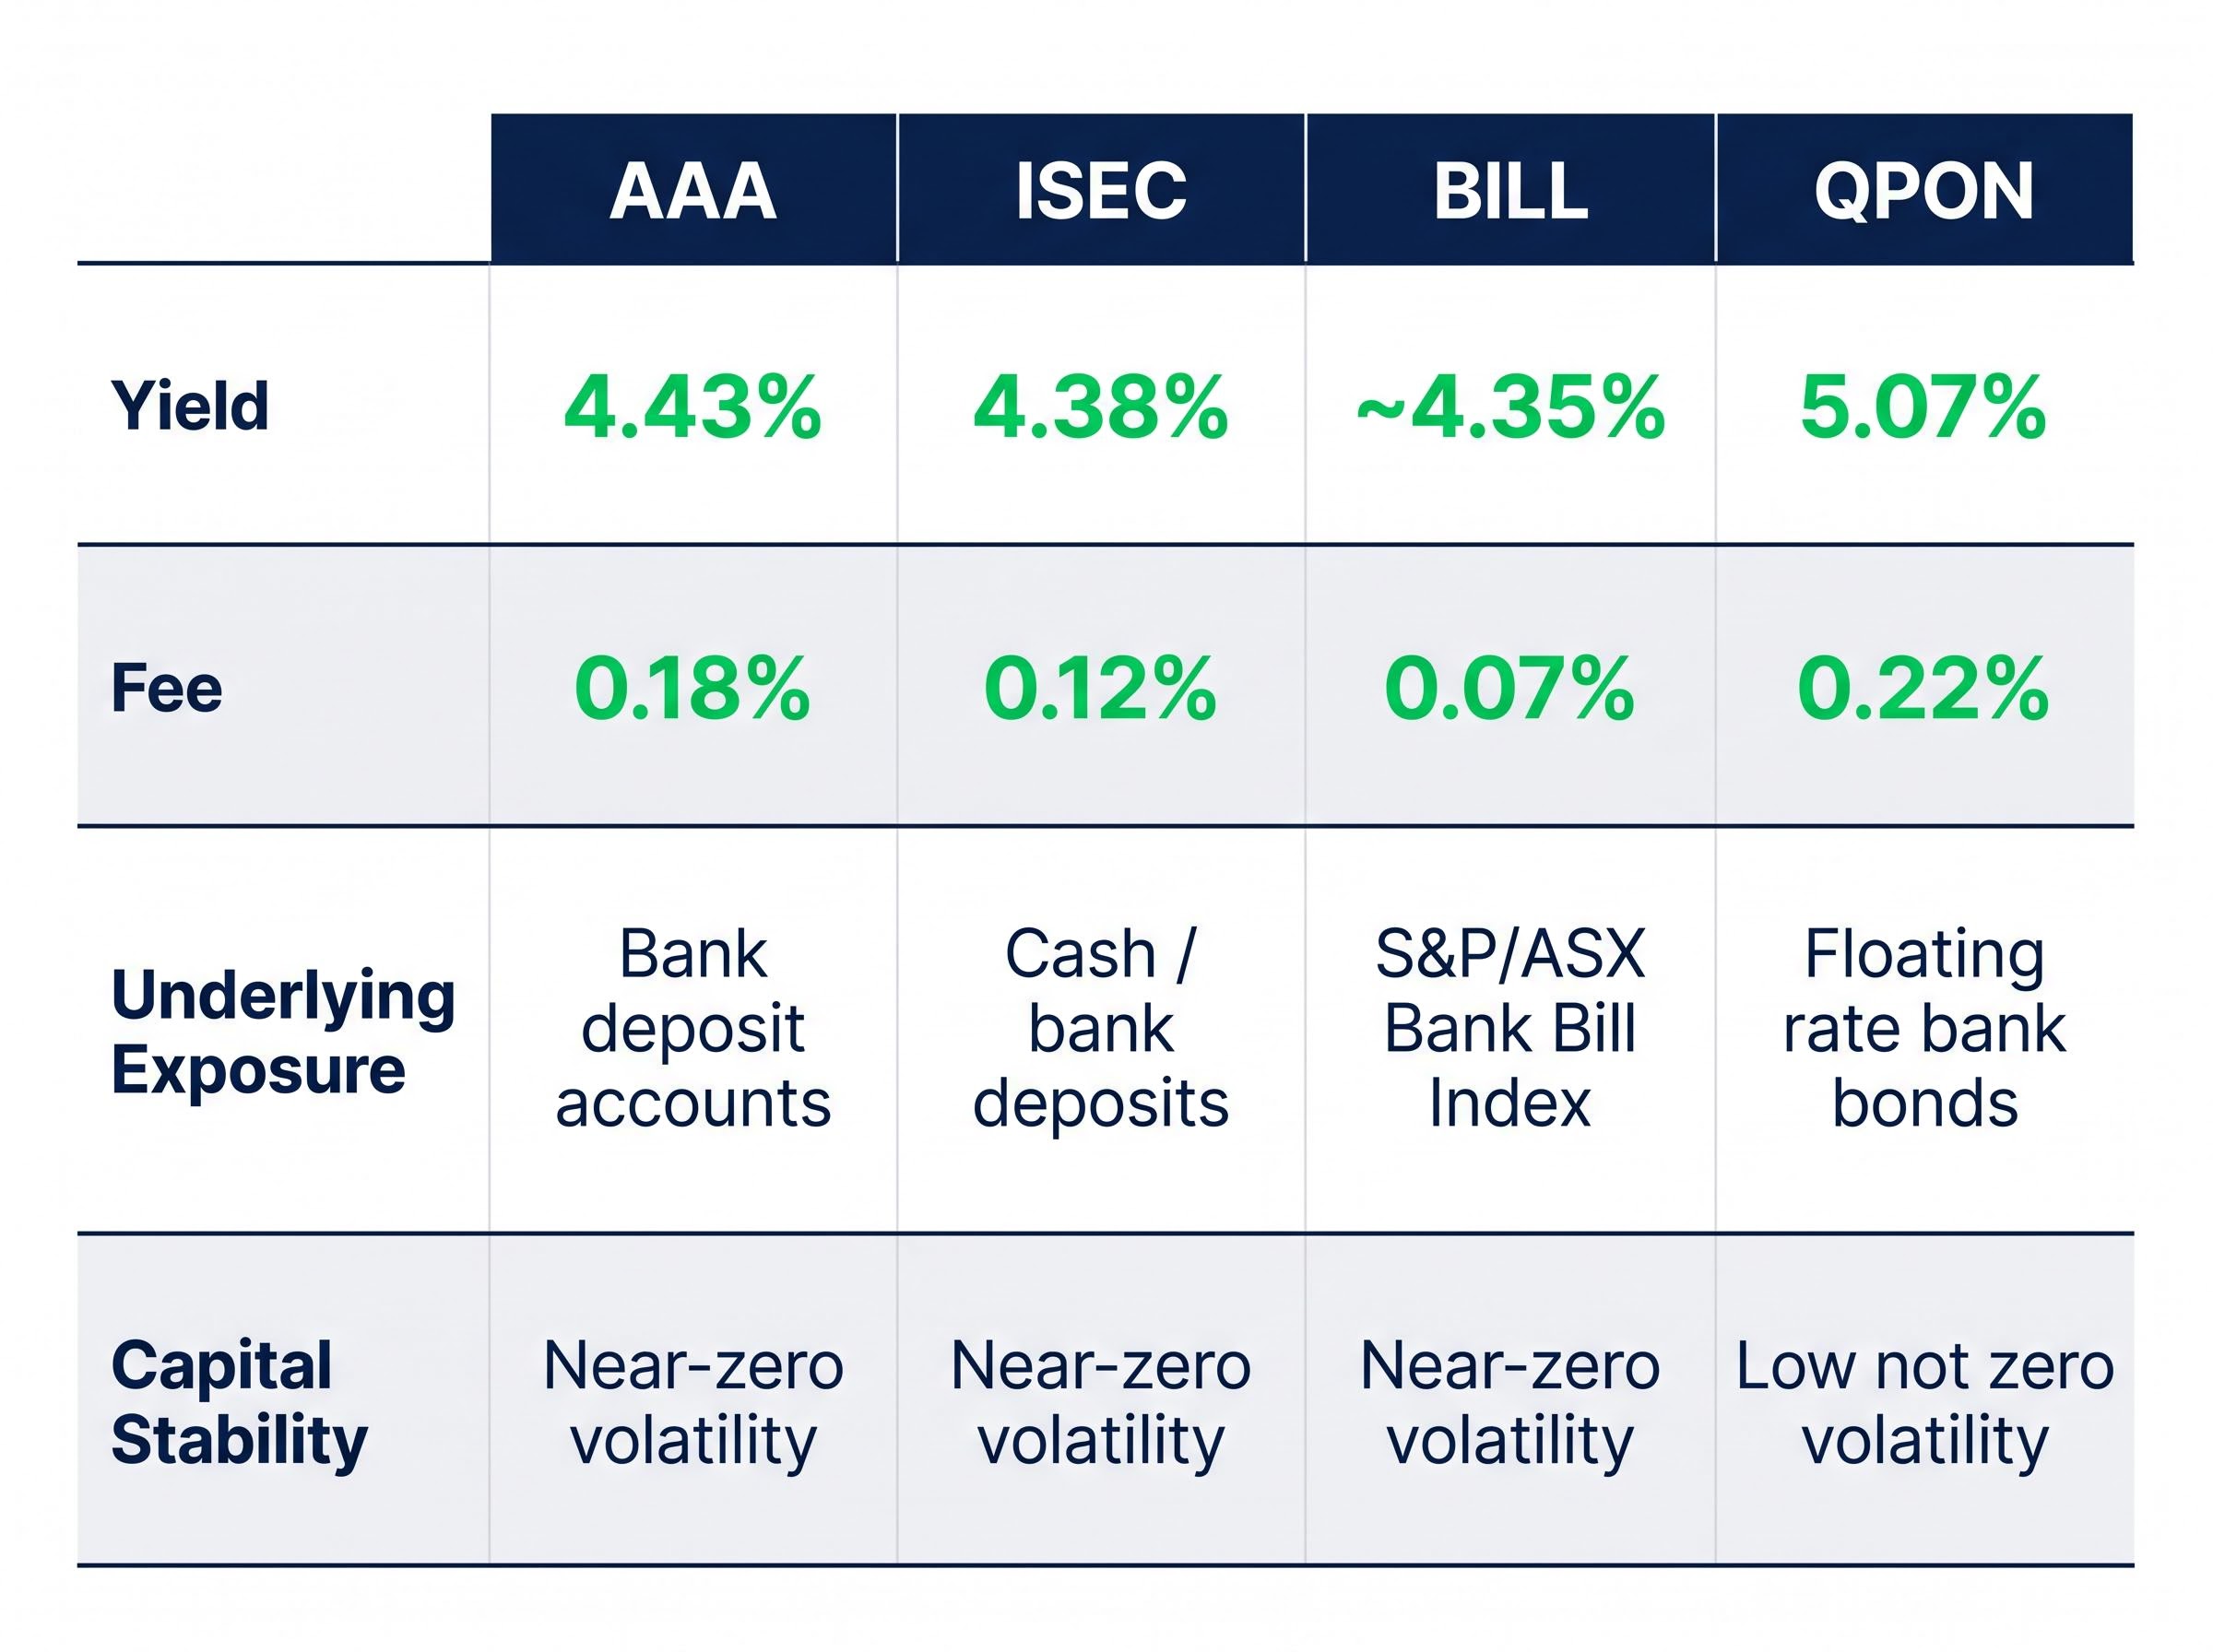
The cash ETF peer group on the ASX is small, but the differences within it are worth understanding before settling on a product.
| ETF | Yield | Fee | Underlying Exposure | Capital Stability |
|---|---|---|---|---|
| AAA | 4.43% | 0.18% | Bank deposit accounts | Near-zero volatility |
| ISEC | 4.38% (7-day) | 0.12% | Cash / bank deposits | Near-zero volatility |
| BILL | ~4.35% | 0.07% | S&P/ASX Bank Bill Index | Near-zero volatility |
| QPON | 5.07% (all-in) | 0.22% | Floating rate bank bonds | Low, not zero |
ISEC is the closest like-for-like peer, with a marginally lower yield (4.38% versus 4.43%) and a lower fee (0.12% versus 0.18%). BILL, managed by BlackRock rather than BetaShares, targets capital preservation via short-term money market instruments at a 0.07% fee, the lowest in the group, but without the bank deposit structure that AAA uses.
QPON sits in a different category. Its 5.07% all-in yield (as of 7 May 2026) reflects floating rate bank bond exposure rather than pure deposits. That higher yield carries credit risk above the deposit products, making it a different risk proposition rather than a straight upgrade.
All four products benefit from rate increases, but the transmission mechanism differs. BBSW1M-linked products like AAA reset monthly with rate movements, while floating rate products like QPON reset more frequently, potentially pulling its yield premium wider as rates climb. Westpac forecasts three additional hikes beyond the current 4.35% level, targeting 4.85% by end-2026. Market pricing sits at approximately 4.70%. Both figures imply further tailwinds across this entire peer group, with the floating rate products positioned to capture rate moves marginally faster.
Westpac’s rate plateau forecasts, which project a path to 4.85% by August 2026 driven by second-round fuel price pass-through into freight, construction, and services costs, sit at the more aggressive end of major bank projections but are acknowledged by NAB as a credible upside scenario if Q2 CPI data confirms sustained inflation.
On the raw numbers, cash wins the headline comparison. AAA at 4.43% sits above CBA at approximately 3.45% forward, Telstra at 3.98% trailing (fully franked), and Wesfarmers at 2.78% forward. These equity yields have been compressed by share price appreciation, with the ASX near all-time highs and CBA trading at roughly 22x earnings.
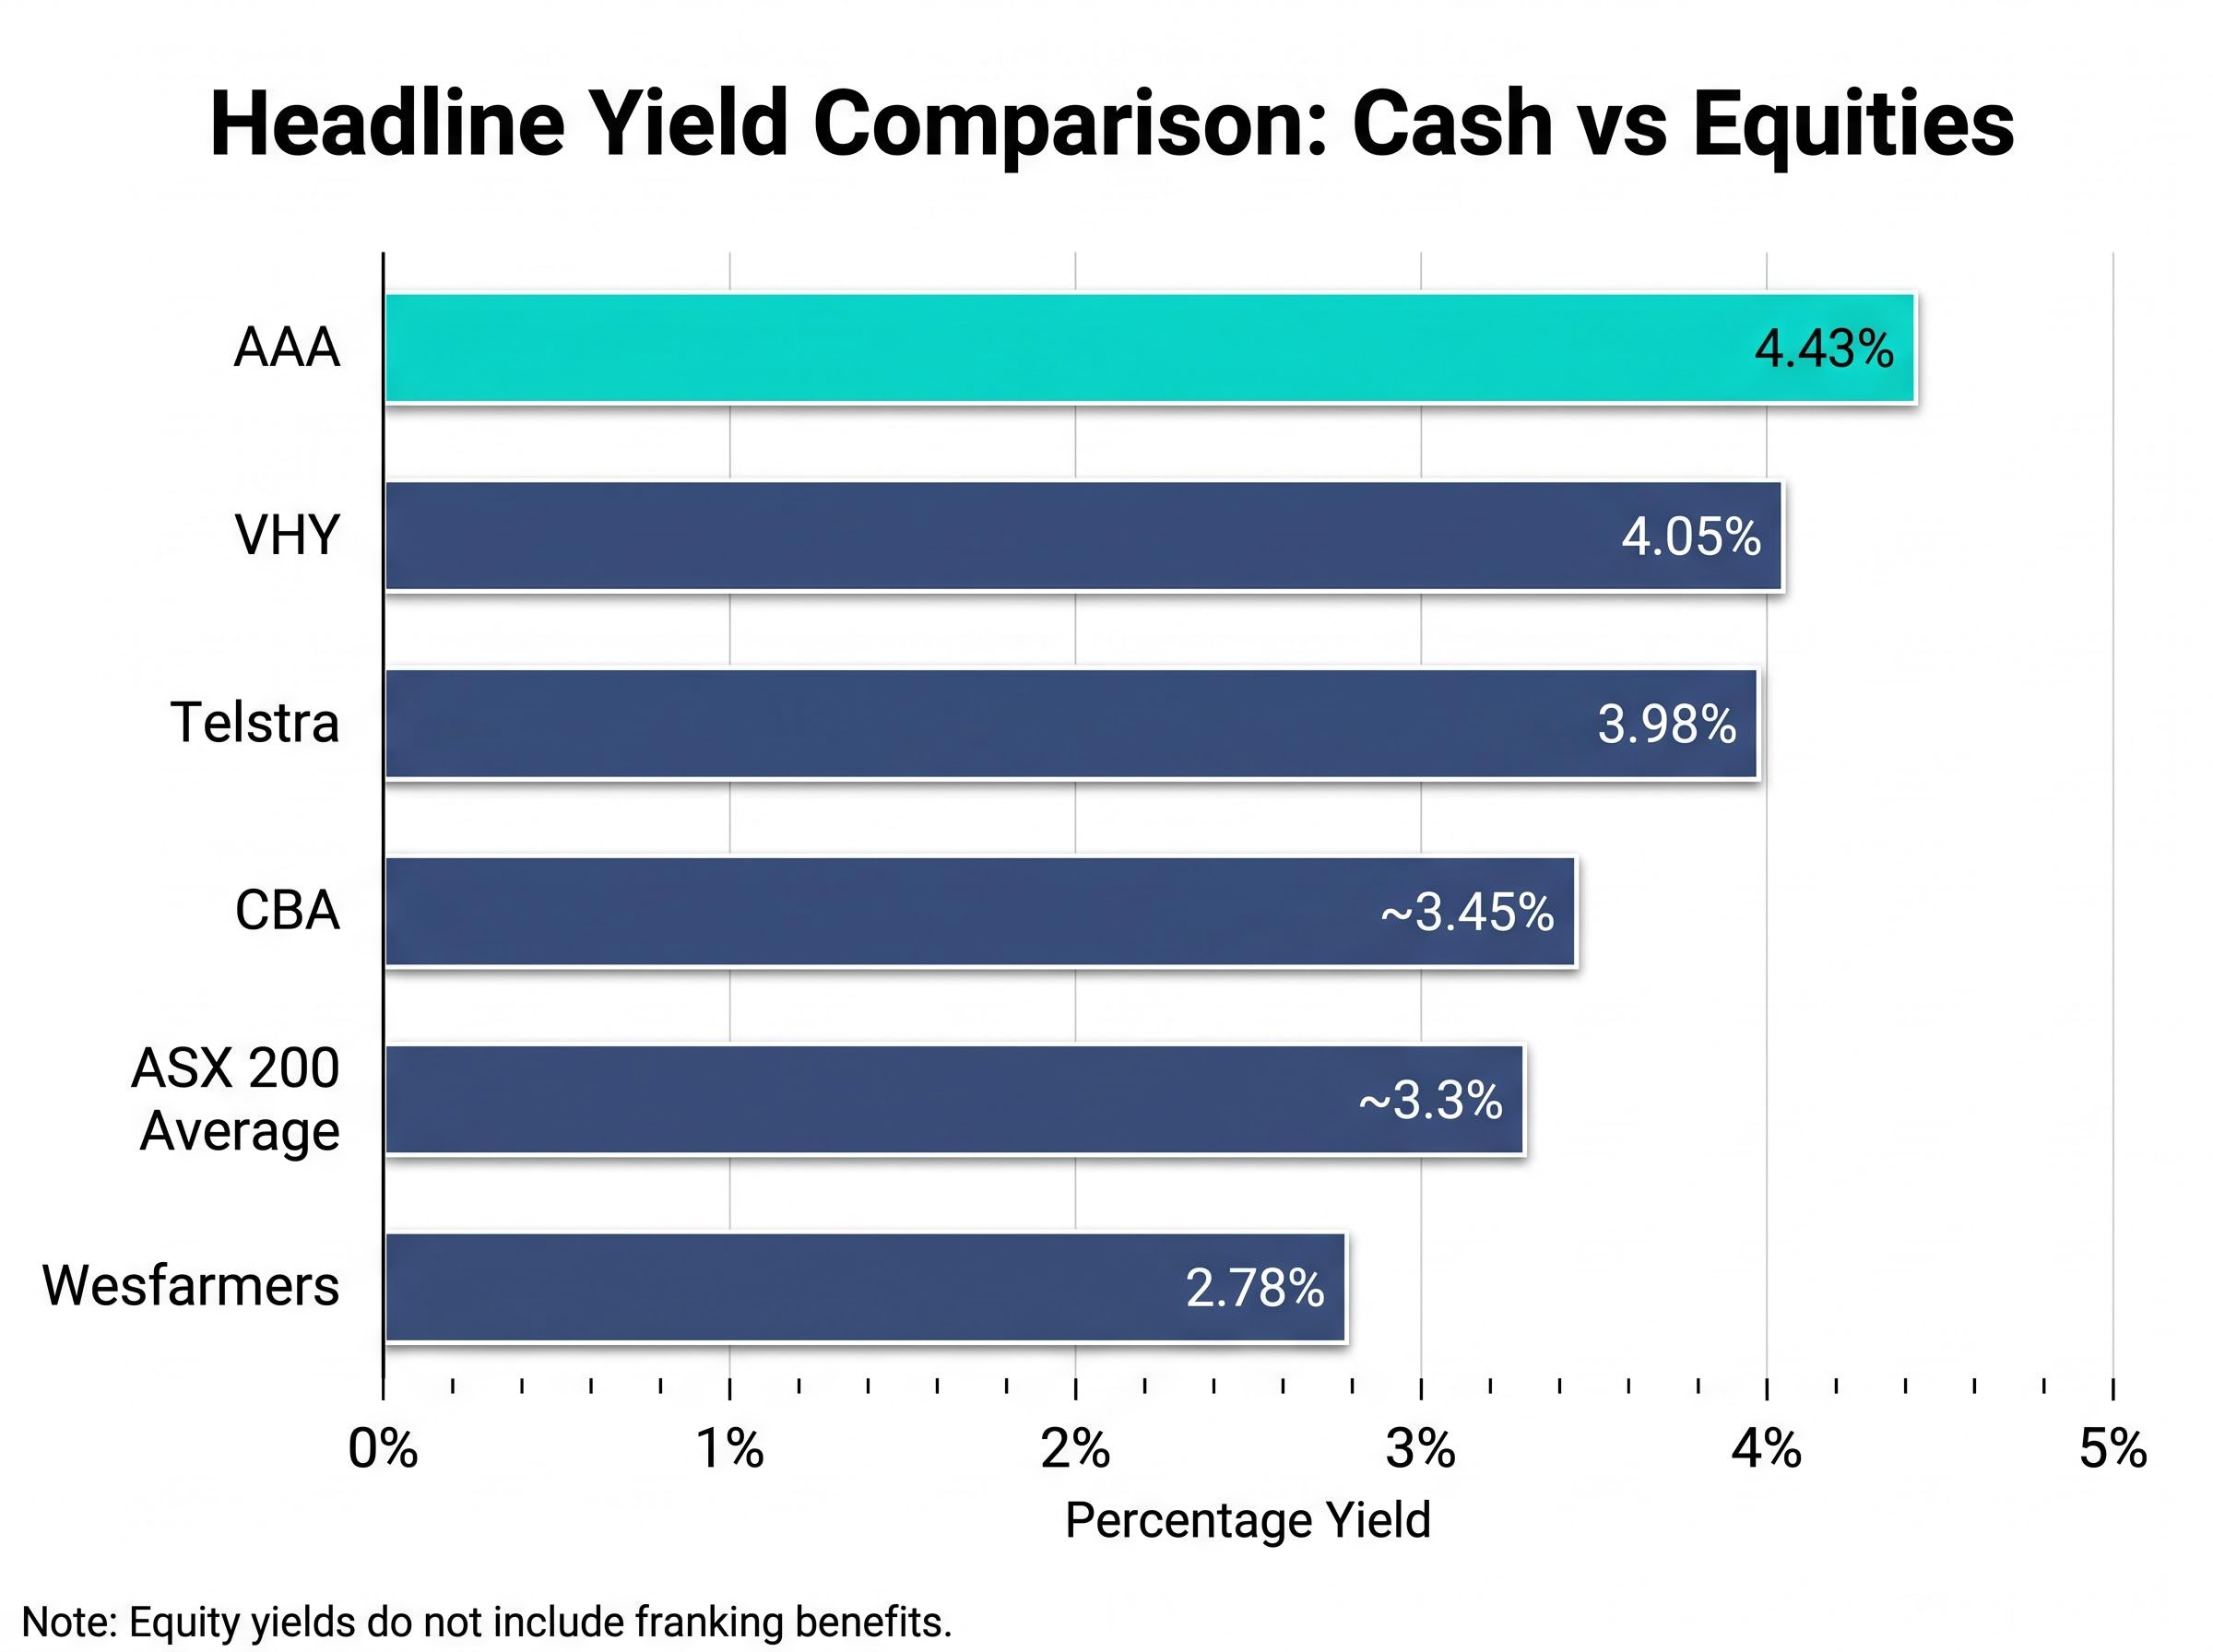
The Vanguard Australian Shares High Yield ETF (VHY) offers a 4.05% 12-month distribution yield (net of its 0.25% MER), but it carries equity volatility: a 1-year standard deviation of approximately 12%, compared to AAA’s near-zero.
| Investment | Headline Yield | Franking Benefit | Volatility | Income Reliability |
|---|---|---|---|---|
| AAA | 4.43% | None | ~0% | Monthly, stable |
| CBA | ~3.45% | ~1-1.5% uplift | Moderate-High | Semi-annual |
| Telstra | 3.98% | ~1-1.5% uplift (100% franked) | Moderate | Semi-annual |
| Wesfarmers | 2.78% | ~1-1.5% uplift | Moderate | Semi-annual |
| VHY | 4.05% | Franking included | ~12% std dev | Monthly |
Then franking credits enter the equation. Fully franked dividends from CBA and Telstra carry imputation credits worth approximately 1-1.5 percentage points of effective additional return for Australian taxpayers who can utilise them. That narrows the gap considerably, and for some investors, it closes it entirely.
Grossed-up dividend calculations reveal the real income gap more precisely than headline yield comparisons: a $1,000 fully franked dividend is worth $1,428.57 to an SMSF in pension phase once the ATO refunds the attached $428.57 credit, a figure that changes the competitive picture materially when stacked against AAA’s unfranked 4.43%.
BetaShares’ Cameron Gleeson has described cash as an attractive “parking spot” given elevated equity P/E multiples. Wilson Asset Management offers the counter-argument: franking credits in Telstra and Wesfarmers make equities still competitive for income investors willing to accept the volatility.
AAA distributions are interest income with no franking, taxed at the investor’s marginal rate. Dividends from the blue-chips carry imputation credits that can reduce or eliminate tax on that income for investors below the top bracket. The headline comparison flatters cash; the after-tax comparison is genuinely investor-specific.
AAA and its peers distribute interest income, which is taxed at the investor’s marginal tax rate with no franking credits attached. This makes the effective after-tax yield highly sensitive to the investor’s tax bracket in a way that franked dividend income is not.
Two concrete examples illustrate the difference:
SMSF investors in pension phase occupy a structurally different position. They pay zero tax on pension-phase income and can receive franking credits as a cash refund, meaning a fully franked dividend does not just reduce their tax liability; it generates a positive cash return from the tax system itself. For this investor type, fully franked equities are potentially superior to cash ETFs at equivalent headline yields. This does not mean SMSFs should avoid cash ETFs, only that the calculus is materially different for pension-phase members than for individual investors in higher tax brackets.
The historical record is unambiguous: cash investments have produced materially lower total returns than ASX equities over long periods. The current environment does not change that structural relationship.
The long-term cash return record is a useful anchor here: over 20 years of verified Australian asset class data, cash has produced a negative real return after inflation, while residential property delivered 9.16% annualised and Australian shares returned 7.55%, figures that sit behind the article’s caution against treating the current rate-driven yield window as a structural shift.
What it does is create a specific and unusual confluence. Elevated equity valuations have compressed dividend yields at the same time a rising rate cycle has pushed cash ETF yields upward. The result is a temporary window where the yield gap has closed to near zero on a raw basis. Morningstar Australia has characterised cash ETFs as “unusually competitive” relative to the ASX 200 average yield of approximately 3.3% (end-March 2026).
Morningstar Australia notes cash ETFs are “unusually competitive” at current rate levels relative to the ASX 200 average yield.
Three conditions underpin this window, and all three are rate-dependent:
The same rising rate environment that boosts cash ETF yields also applies downward pressure to equity valuations. The window of competitive cash yields may coincide with an equity re-rating period worth monitoring. Investors who anchor to the current yield comparison risk treating a temporary condition as permanent.
The allocation question resolves differently depending on investor type rather than producing a single universal answer.
The yield figure captures the income; it does not capture the liquidity and stability features. AAA offers daily liquidity, a structural advantage over term deposits (currently 4.20-4.40%) that lock capital for fixed periods at comparable rates. BetaShares’ own commentary from 15 March 2026 explicitly positioned this as the primary competitive advantage over term deposits. Monthly distribution cadence also compares favourably to the quarterly or semi-annual dividends from many equities.
The forward rate outlook adds a further dimension. With Westpac forecasting 4.85% by end-2026 and market pricing at approximately 4.70%, AAA’s yield has further upside from here. Equity income yields, by contrast, face valuation headwinds if rates continue rising, suggesting the current comparison may improve further in cash’s favour over the next 6-12 months.
AAA is not presented as a replacement for equity income exposure. It is a competitive alternative for a portion of income allocation, particularly for investors managing downside risk or running shorter time horizons.
At 4.43% net of fees, AAA now exceeds the raw dividend yields of CBA, Telstra, and Wesfarmers simultaneously. That is a genuinely unusual configuration, driven by the simultaneous compression of equity yields and elevation of cash rates rather than any single catalyst.
The attractiveness of cash ETFs in this environment is a function of two variables: RBA rate trajectory and equity valuations. Both can and will shift, and both deserve ongoing monitoring. The three additional hikes forecast by Westpac would push yields higher still; a reversal in rate expectations would erode the case.
For investors with shorter time horizons, defensive mandates, or tax positions that dilute the franking advantage, AAA and its peers represent a legitimately competitive income allocation right now, not merely a temporary shelter. The investor who understands exactly which conditions support that case is better positioned than the one who treats the current 4.43% as permanent.
This article is for informational purposes only and should not be considered financial advice. Investors should conduct their own research and consult with financial professionals before making investment decisions. Past performance does not guarantee future results. Financial projections are subject to market conditions and various risk factors.
The BetaShares AAA ETF is an ASX-listed cash ETF that holds Australian dollar interest-bearing bank deposit accounts and distributes income monthly, with its yield benchmarked against the 1-month Bank Bill Swap Rate rather than the RBA cash rate directly.
Fully franked dividends from companies like CBA and Telstra carry imputation credits worth approximately 1-1.5 percentage points of additional effective return for Australian taxpayers, which can narrow or close the headline yield gap between cash ETFs and dividend stocks depending on the investor's tax bracket.
Following the RBA's rate increase to 4.35% on 5 May 2026, BetaShares updated the AAA ETF's effective yield to 4.43% net of its 0.18% management fee, up from 4.30% the prior month.
Cash ETF distributions like those from AAA are classified as interest income and taxed at the investor's full marginal rate with no franking credits attached, meaning a top-bracket investor at 47% retains only around 2.3% net from a 4.43% gross yield.
The main ASX cash ETFs are AAA (4.43% yield, 0.18% fee), ISEC (4.38% yield, 0.12% fee), BILL (approximately 4.35% yield, 0.07% fee), and QPON (5.07% yield, 0.22% fee), with QPON carrying higher credit risk through floating rate bank bond exposure rather than pure deposit accounts.