On 28 July 2026, every major Australian bank stock is sitting on monthly gains, some as high as 8%, while the sectors that dominated earlier in the year are handing back ground. That reversal is not accidental.
A combination of moderating inflation data, growing conviction that the Reserve Bank of Australia (RBA) is at or near its rate peak, and a broad rotation away from cyclicals has sent capital flooding into ASX-listed financial stocks this month. With banks collectively representing roughly 25% of the S&P/ASX 200 by market capitalisation, even a moderate reallocation toward the sector produces visible price movement across the board.
Here is exactly what has moved and by how much, the macro logic driving the rotation, and the specific variables that will determine whether July’s rally holds into August. Pricing data is sourced from Motley Fool Australia as of 28 July 2026 and does not constitute financial advice.
Why Australian bank stocks are rallying in July 2026
Three identifiable forces powered the July move, and understanding them as cause-and-effect rather than coincidence changes how you interpret the gains.
- Rate expectations shifted. Moderating inflation data solidified market expectations that the RBA will begin cutting rates later in 2026. Commentary around the central bank having “tightened enough” reframed the rate cycle as having peaked, making bank earnings look more resilient on a forward basis.
- Sector rotation accelerated. Growth-sensitive sectors such as materials, industrials, and mining-related names lost ground as commodity prices fell and global growth outlooks dimmed, prompting investors to shift toward income-generating, defensive holdings. Financials, at roughly 25% of the S&P/ASX 200 by market capitalisation, were the largest available destination.
- Dividend reliability held. Banks’ relatively predictable earnings and consistent dividend payouts reinforced their appeal during a volatile macro period, though this reflects positioning, not a fundamental re-rating.
Franking credit yield adds a structurally important layer to the income appeal that drove defensive rotation into banks in July, with pension-phase SMSF members receiving credits as a direct ATO cash refund rather than a tax offset, widening the gap between Australian bank income and alternatives.
The RBA board minutes for 2026 document the central bank’s deliberations on inflation, credit conditions, and the labour market, providing the primary record of how policymakers assessed whether the tightening cycle had run its course.
The rotation into financials tells you that professional investors are making a defensive positioning call, not a growth call. That distinction matters for how you interpret these share price gains.
When big ASX news breaks, our subscribers know first
How the Big Four banks performed across July
All four major banks posted positive monthly returns in July, but the spread between the top and bottom of the group carries meaning beyond a simple ranking.
| Bank | ASX Code | Price (28 Jul 2026) | Daily Move | Monthly Move (approx.) |
|---|---|---|---|---|
| Commonwealth Bank | CBA | $176.34 | +0.2% | +8% |
| National Australia Bank | NAB | $41.01 | +0.2% | +8% |
| Westpac Banking Corp | WBC | $37.66 | -0.1% | +7% |
| ANZ Group Holdings | ANZ | $36.94 | +0.2% | +5% |
Pricing data sourced from Motley Fool Australia, as of 28 July 2026.
CBA and NAB led the group, both gaining approximately 8% for the month. Westpac followed at +7%, despite edging marginally lower on the day. ANZ posted the most modest return at roughly +5%, a solid gain in absolute terms but a clear laggard relative to its peers.
Three of the four recorded slight intraday gains on 28 July, with only Westpac slipping fractionally, giving real-time texture to the broader monthly picture. The gap between CBA and ANZ is not simply about performance ranking. It reflects different valuation premiums and market positioning that carry different risk profiles heading into earnings season.
CBA’s valuation premium and why it matters more than the monthly return
CBA’s 8% monthly gain at $176.34 per share comes with a persistent valuation premium versus peers that analysts are increasingly scrutinising. That premium is not a reward for superior performance alone; it prices in an expectation of consistency that leaves little room for disappointment.
Slowing household spending, credit growth deceleration, and potential increases in arrears could all expose that premium if earnings underwhelm. A bank trading at a premium to peers is not simply a stronger business. It is a business where you are paying more for the same macroeconomic risks, and that changes the risk-reward calculation for anyone considering new exposure at these levels.
NAB, the joint top performer at +8%, offers strong yield but faces finely balanced risks between margin compression from disinflation and potential provisions if arrears rise. It appeals on income, but lacks an obvious re-rating catalyst beyond the broader sector rotation.
Westpac and ANZ: solid gains, more balanced risk profiles
Westpac’s 7% monthly return came with a caveat: rate-driven margin expansion is increasingly limited given the RBA’s policy stance and competitive lending dynamics. The benefit from prevailing rate levels has been partially priced in, capping the upside from here.
ANZ’s 5% gain made it the laggard, but its less stretched starting valuation means it also carries less downside risk if the macro outlook softens. The same sector pressures apply, but the price you pay for exposure to those pressures is lower.
Beyond the Big Four: mid-tier bank returns and what drove the gap
The rotation reached beyond the majors to capture mid-tier lenders, but the dispersion in returns reveals that not all bank stocks rallied for the same reasons.
| Bank | ASX Code | Price (28 Jul 2026) | Daily Move | Monthly Move (approx.) |
|---|---|---|---|---|
| Bendigo and Adelaide Bank | BEN | $11.06 | +0.5% | +6% |
| Bank of Queensland | BOQ | $6.51 | +0.5% | +4% |
| Macquarie Group | MQG | $254.72 | -1.5% | +2% |
Pricing data sourced from Motley Fool Australia, as of 28 July 2026.
Bendigo and Adelaide Bank was the mid-tier standout at approximately +6%, a return broadly in line with the Big Four and suggesting investors extended the defensive income thesis beyond the majors. Bank of Queensland advanced a more modest +4%, reflecting ongoing scrutiny of margins, regional exposure, and credit quality that weighs more heavily on smaller lenders.
Macquarie Group was the clear outlier: up only +2% for July and down -1.5% on the day. Its globally exposed, diversified model means domestic RBA rate narratives have far less direct bearing on its share price. You should not assume a single sector rotation narrative applies uniformly to every stock carrying a banking licence. Macquarie’s underperformance makes that point clearly.
What is actually driving sector rotations into ASX financials, and why this one fits the pattern
Sector rotation is the movement of investment capital between industry groups in response to shifting economic and monetary conditions. It is a repeating market dynamic, and understanding the mechanics helps you recognise when it is happening rather than only identifying it in hindsight.
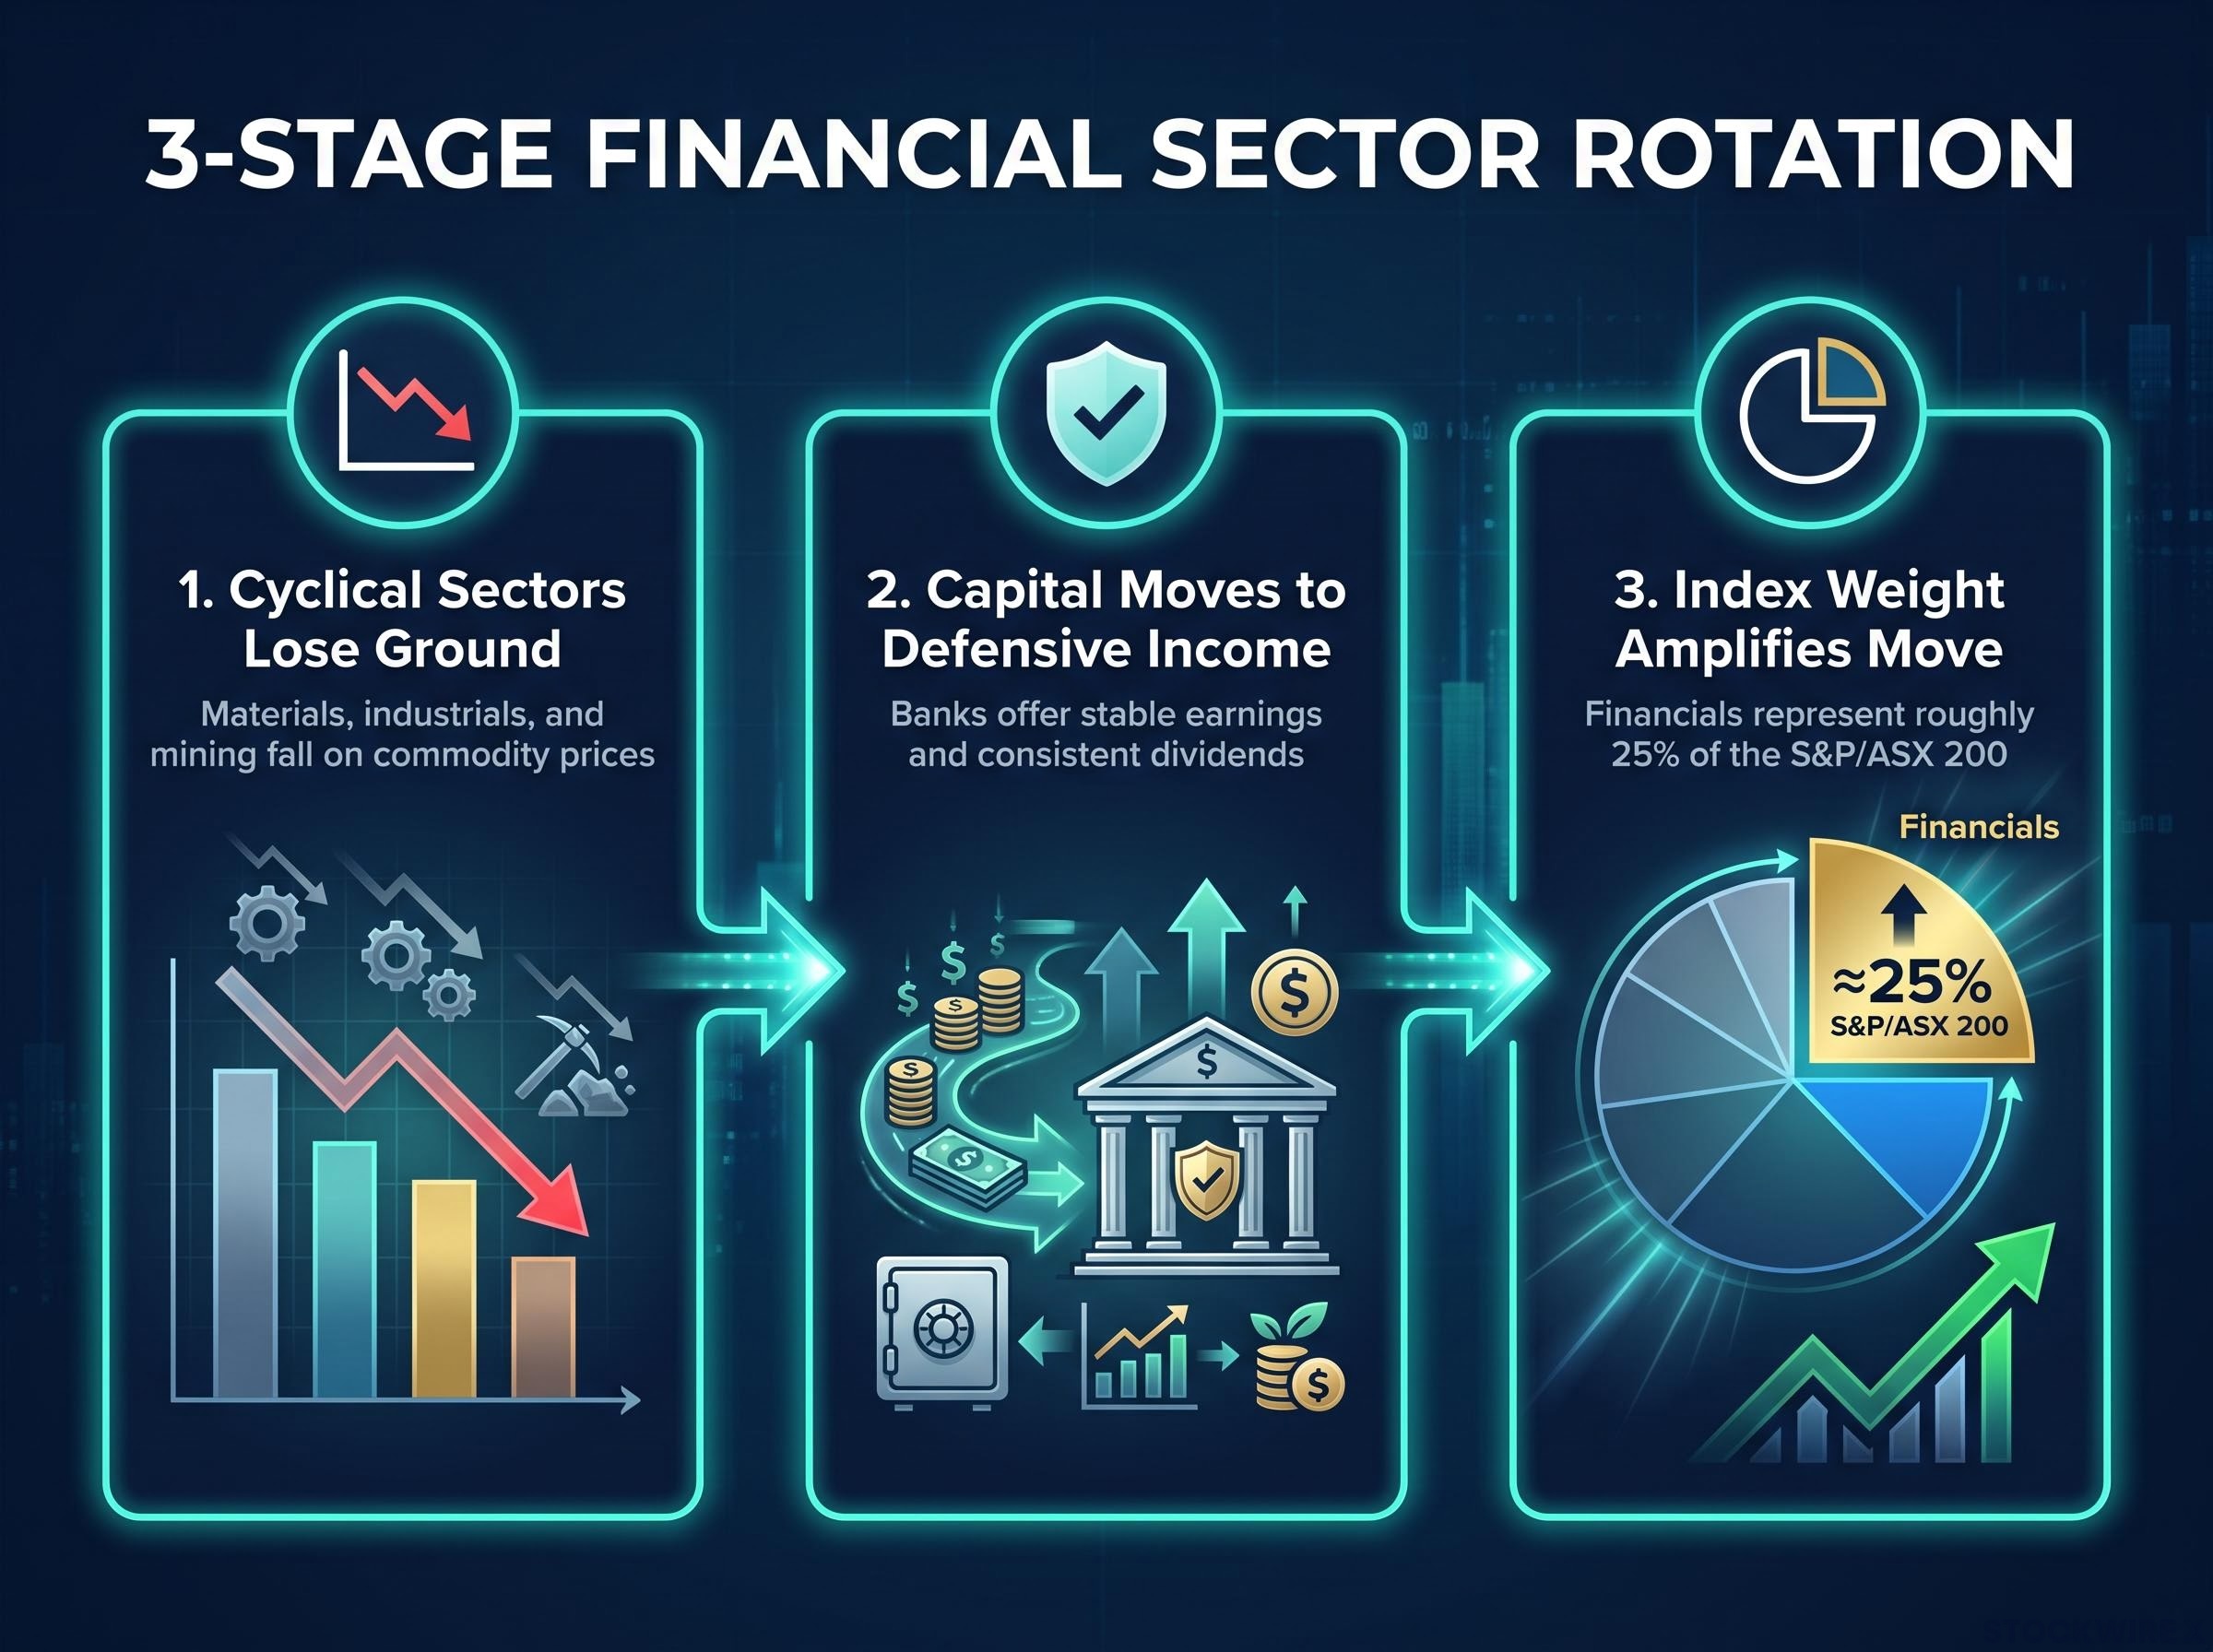
The July move followed a three-stage sequence:
- Cyclical sectors lost ground as falling commodity prices and rising uncertainty over global growth prospects dragged on materials, industrials, and mining names, pushing investors to reassess their exposure.
- Capital moved toward defensive income destinations, and banks drew those flows by offering relatively stable earnings and a track record of consistent dividend payments.
- Financials’ index weight amplified the effect. At roughly 25% of the S&P/ASX 200 by market capitalisation, even moderate reallocation produced outsized share price movement.
The RBA having “tightened enough” became the consensus framing that gave investors permission to position for a rate peak, making financials a natural late-cycle destination.
Banks’ earnings are sensitive to the direction of interest rates: net interest margins (the difference between what a bank earns on loans and pays on deposits), credit demand, and funding costs all shift with the rate cycle. Knowing that this rally fits a late-cycle rotation pattern rather than a fundamental upgrade means you can set a more realistic expectation for how long the momentum is likely to persist.
Three variables that will determine whether July’s gains hold through August
If you are evaluating whether to add to bank positions after a strong July, these three variables are the stress tests your thesis needs to survive before August results land.
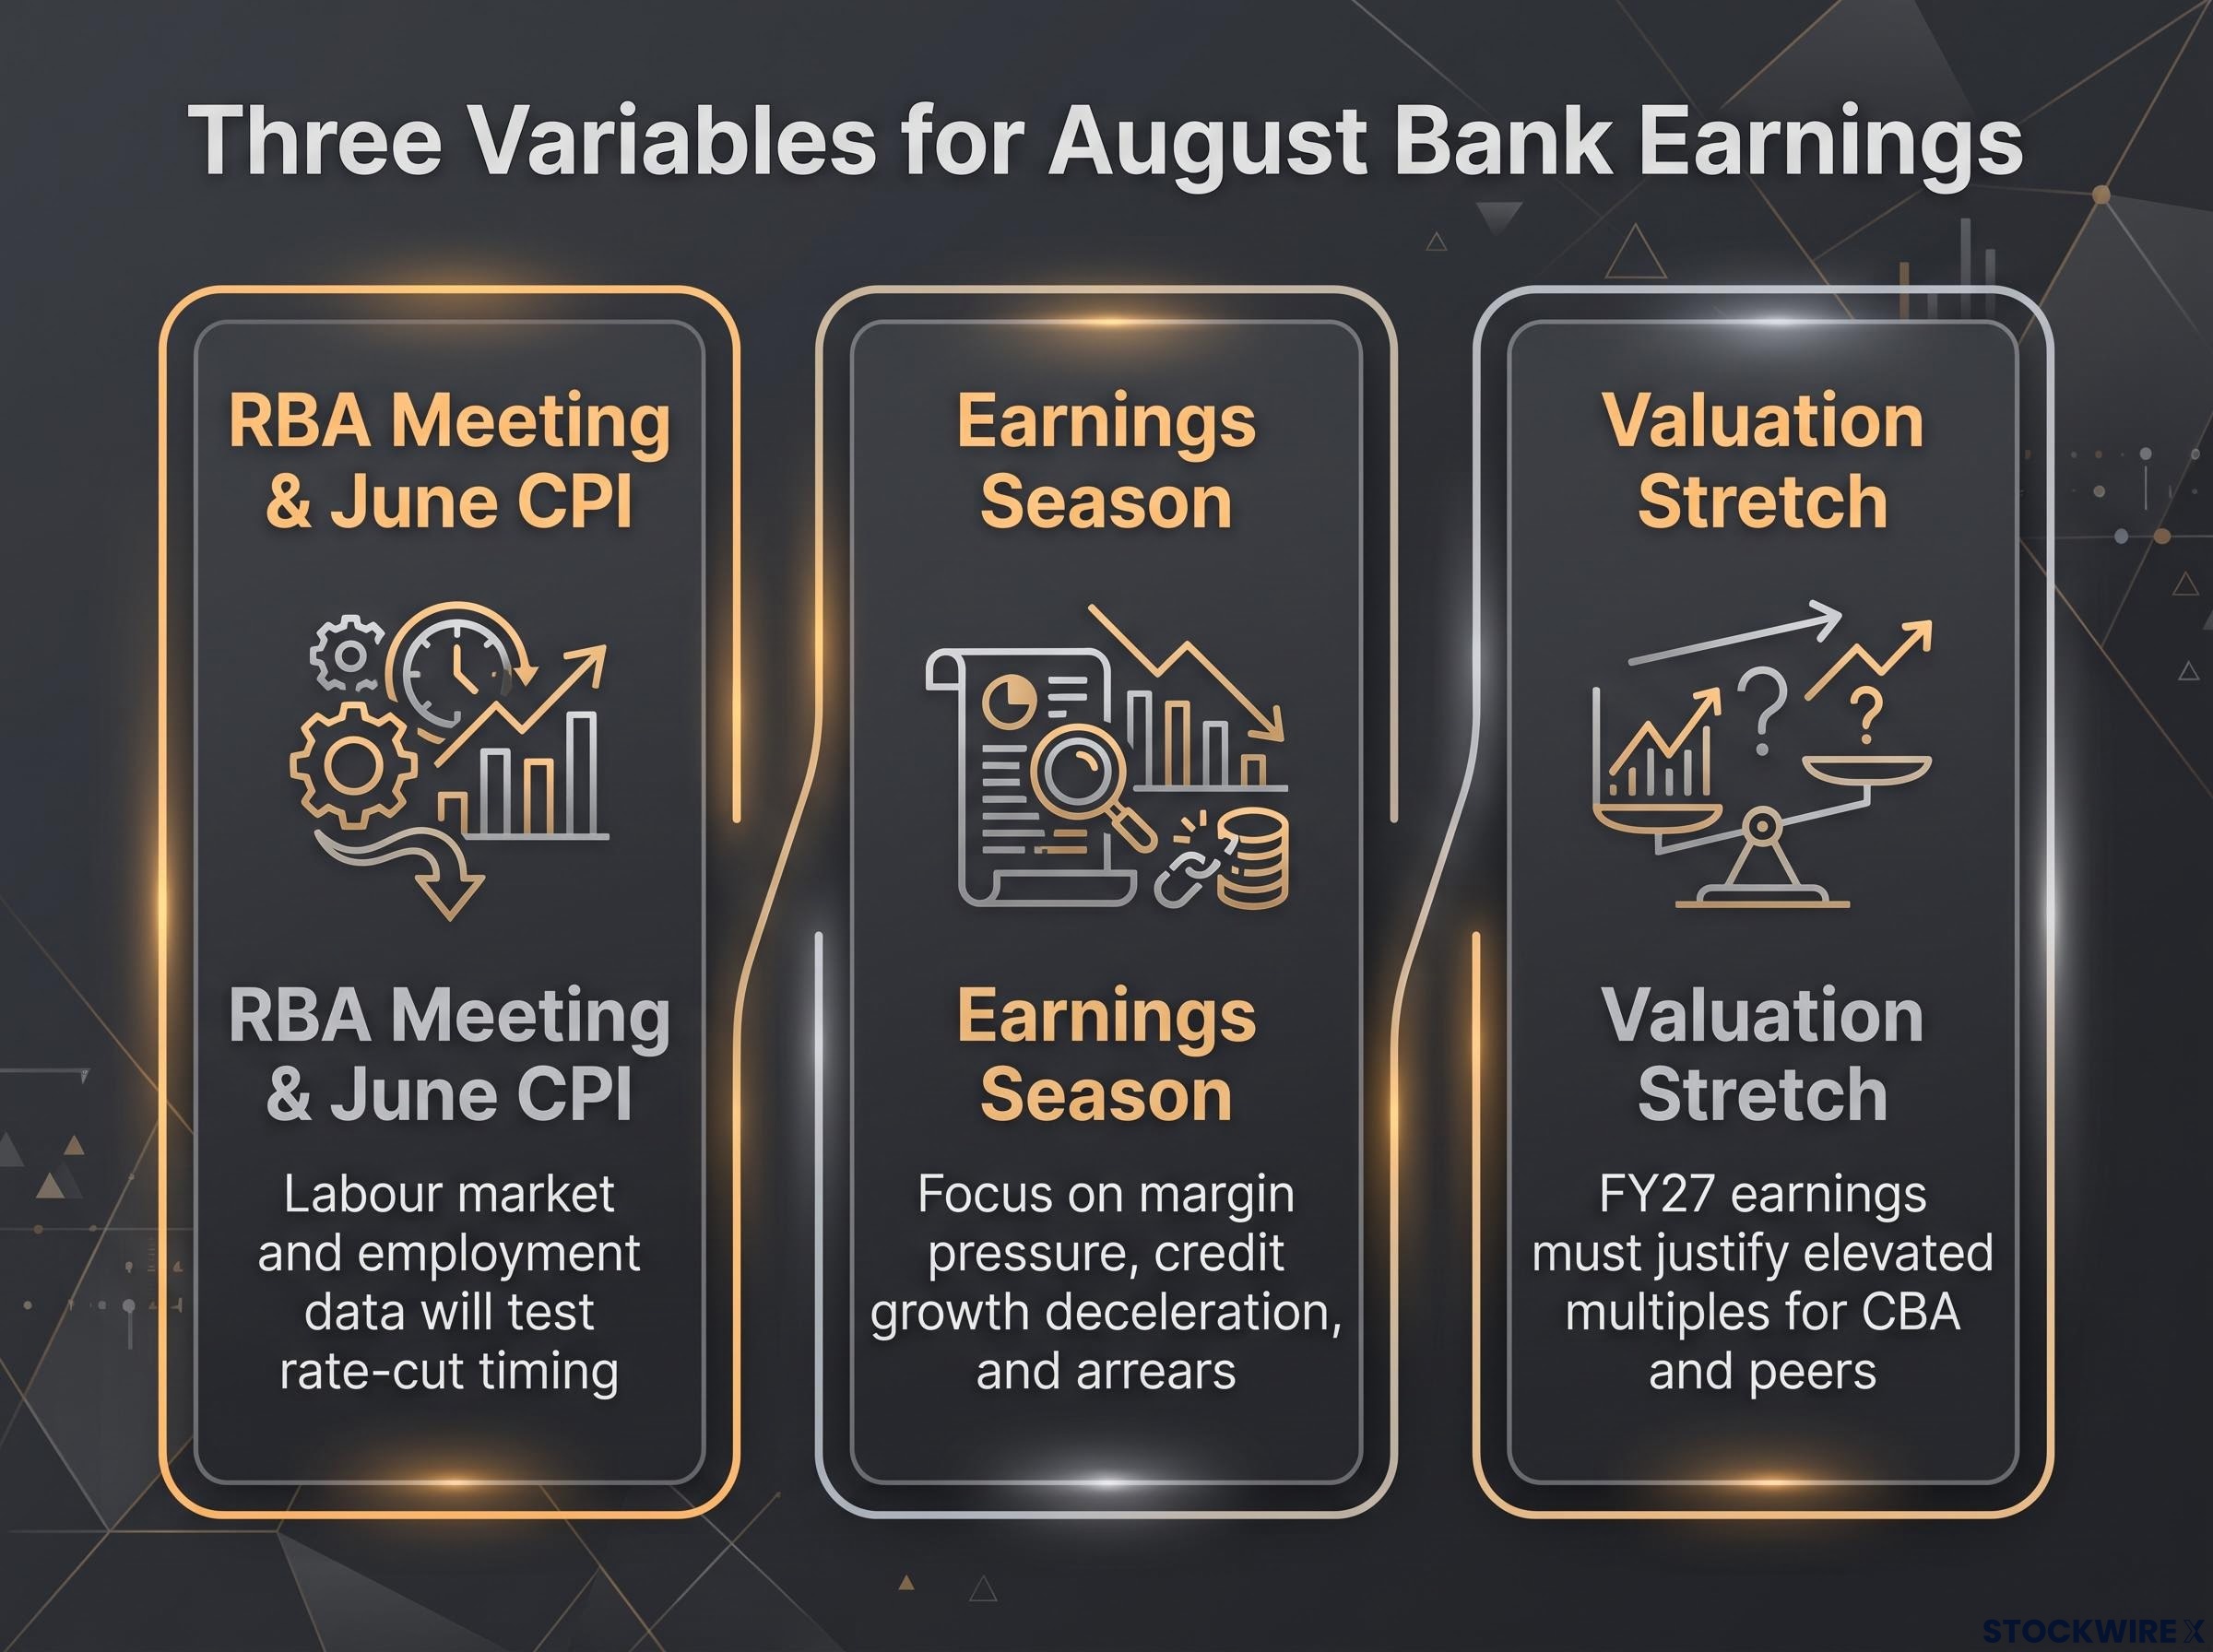
- The RBA’s August meeting and the June CPI release. Rate-cut timing is the central variable for bank valuations right now. Any hawkish surprise in the RBA’s guidance, or an upside surprise in inflation data, would materially undermine the rate-cut thesis underpinning the entire July rally. Labour market data, including employment, unemployment, and underemployment figures, will also shape the RBA’s posture.
- Earnings season. Upcoming results will test whether margin pressure, credit growth deceleration, and arrears trends are as manageable as current valuations assume.
- Valuation stretch. Several brokers have warned that valuations have raced ahead of fundamentals. With CBA and peers trading at elevated multiples, FY27 earnings would need to justify current prices, leaving stocks exposed if results disappoint.
The bank earnings valuation gap has been a persistent concern through 2026, with CBA trading at roughly 27x earnings against a historical average of approximately 18x, a premium that strong profits have not closed because rising share prices offset improved earnings.
What to look for in bank earnings results
Three metrics will matter most when results begin landing: net interest margin trends, which reveal whether competitive lending and elevated funding costs are compressing profitability; credit growth volume data, which signals whether loan demand is holding or decelerating; and arrears and provisioning disclosures, which show whether household stress is translating into actual credit losses.
July’s rally in context: mean reversion, not a new cycle
The Big Four entered 2026 on elevated valuations and largely underperformed in the earlier months as higher rates, softer margins, and rotation into cheaper sectors weighed on sentiment. July’s 5-8% gains across the group represent a partial recovery, not a departure from that story.
The July move looks more like mean reversion within an ongoing period of valuation scrutiny than the beginning of a sustained re-rating based on improved fundamentals.
Mean reversion mechanics on the ASX show the 10 worst-performing top-100 stocks in any given year have historically returned an average 25.2% the following year, a data point that adds quantitative weight to the July recovery narrative for banks that underperformed earlier in 2026.
The genuine positives are real: defensive income appeal and rate cycle positioning gave investors a reason to rotate back. But those drivers support a tactical reallocation, not a wholesale upgrade of the sector’s long-term growth profile. Treating July as a mean-reversion event rather than a breakout moment changes how you should size a position in bank stocks right now, because mean-reversion moves tend to fade once the macro catalyst is fully priced.
This article is for informational purposes only and should not be considered financial advice. Investors should conduct their own research and consult with financial professionals before making investment decisions. Past performance does not guarantee future results. Financial projections are subject to market conditions and various risk factors.