Brad Jacobs has spent roughly $30 billion in under 18 months assembling a building products distribution empire, and the market has responded by cutting his company’s share price by more than half.
That gap between ambition and verdict is the analytical puzzle worth sitting with. QXO Inc. has closed three major acquisitions, Beacon, Kodiak, and TopBuild, pulling together roughly $18 billion in pro forma revenue and a stated path to $50 billion within the decade.
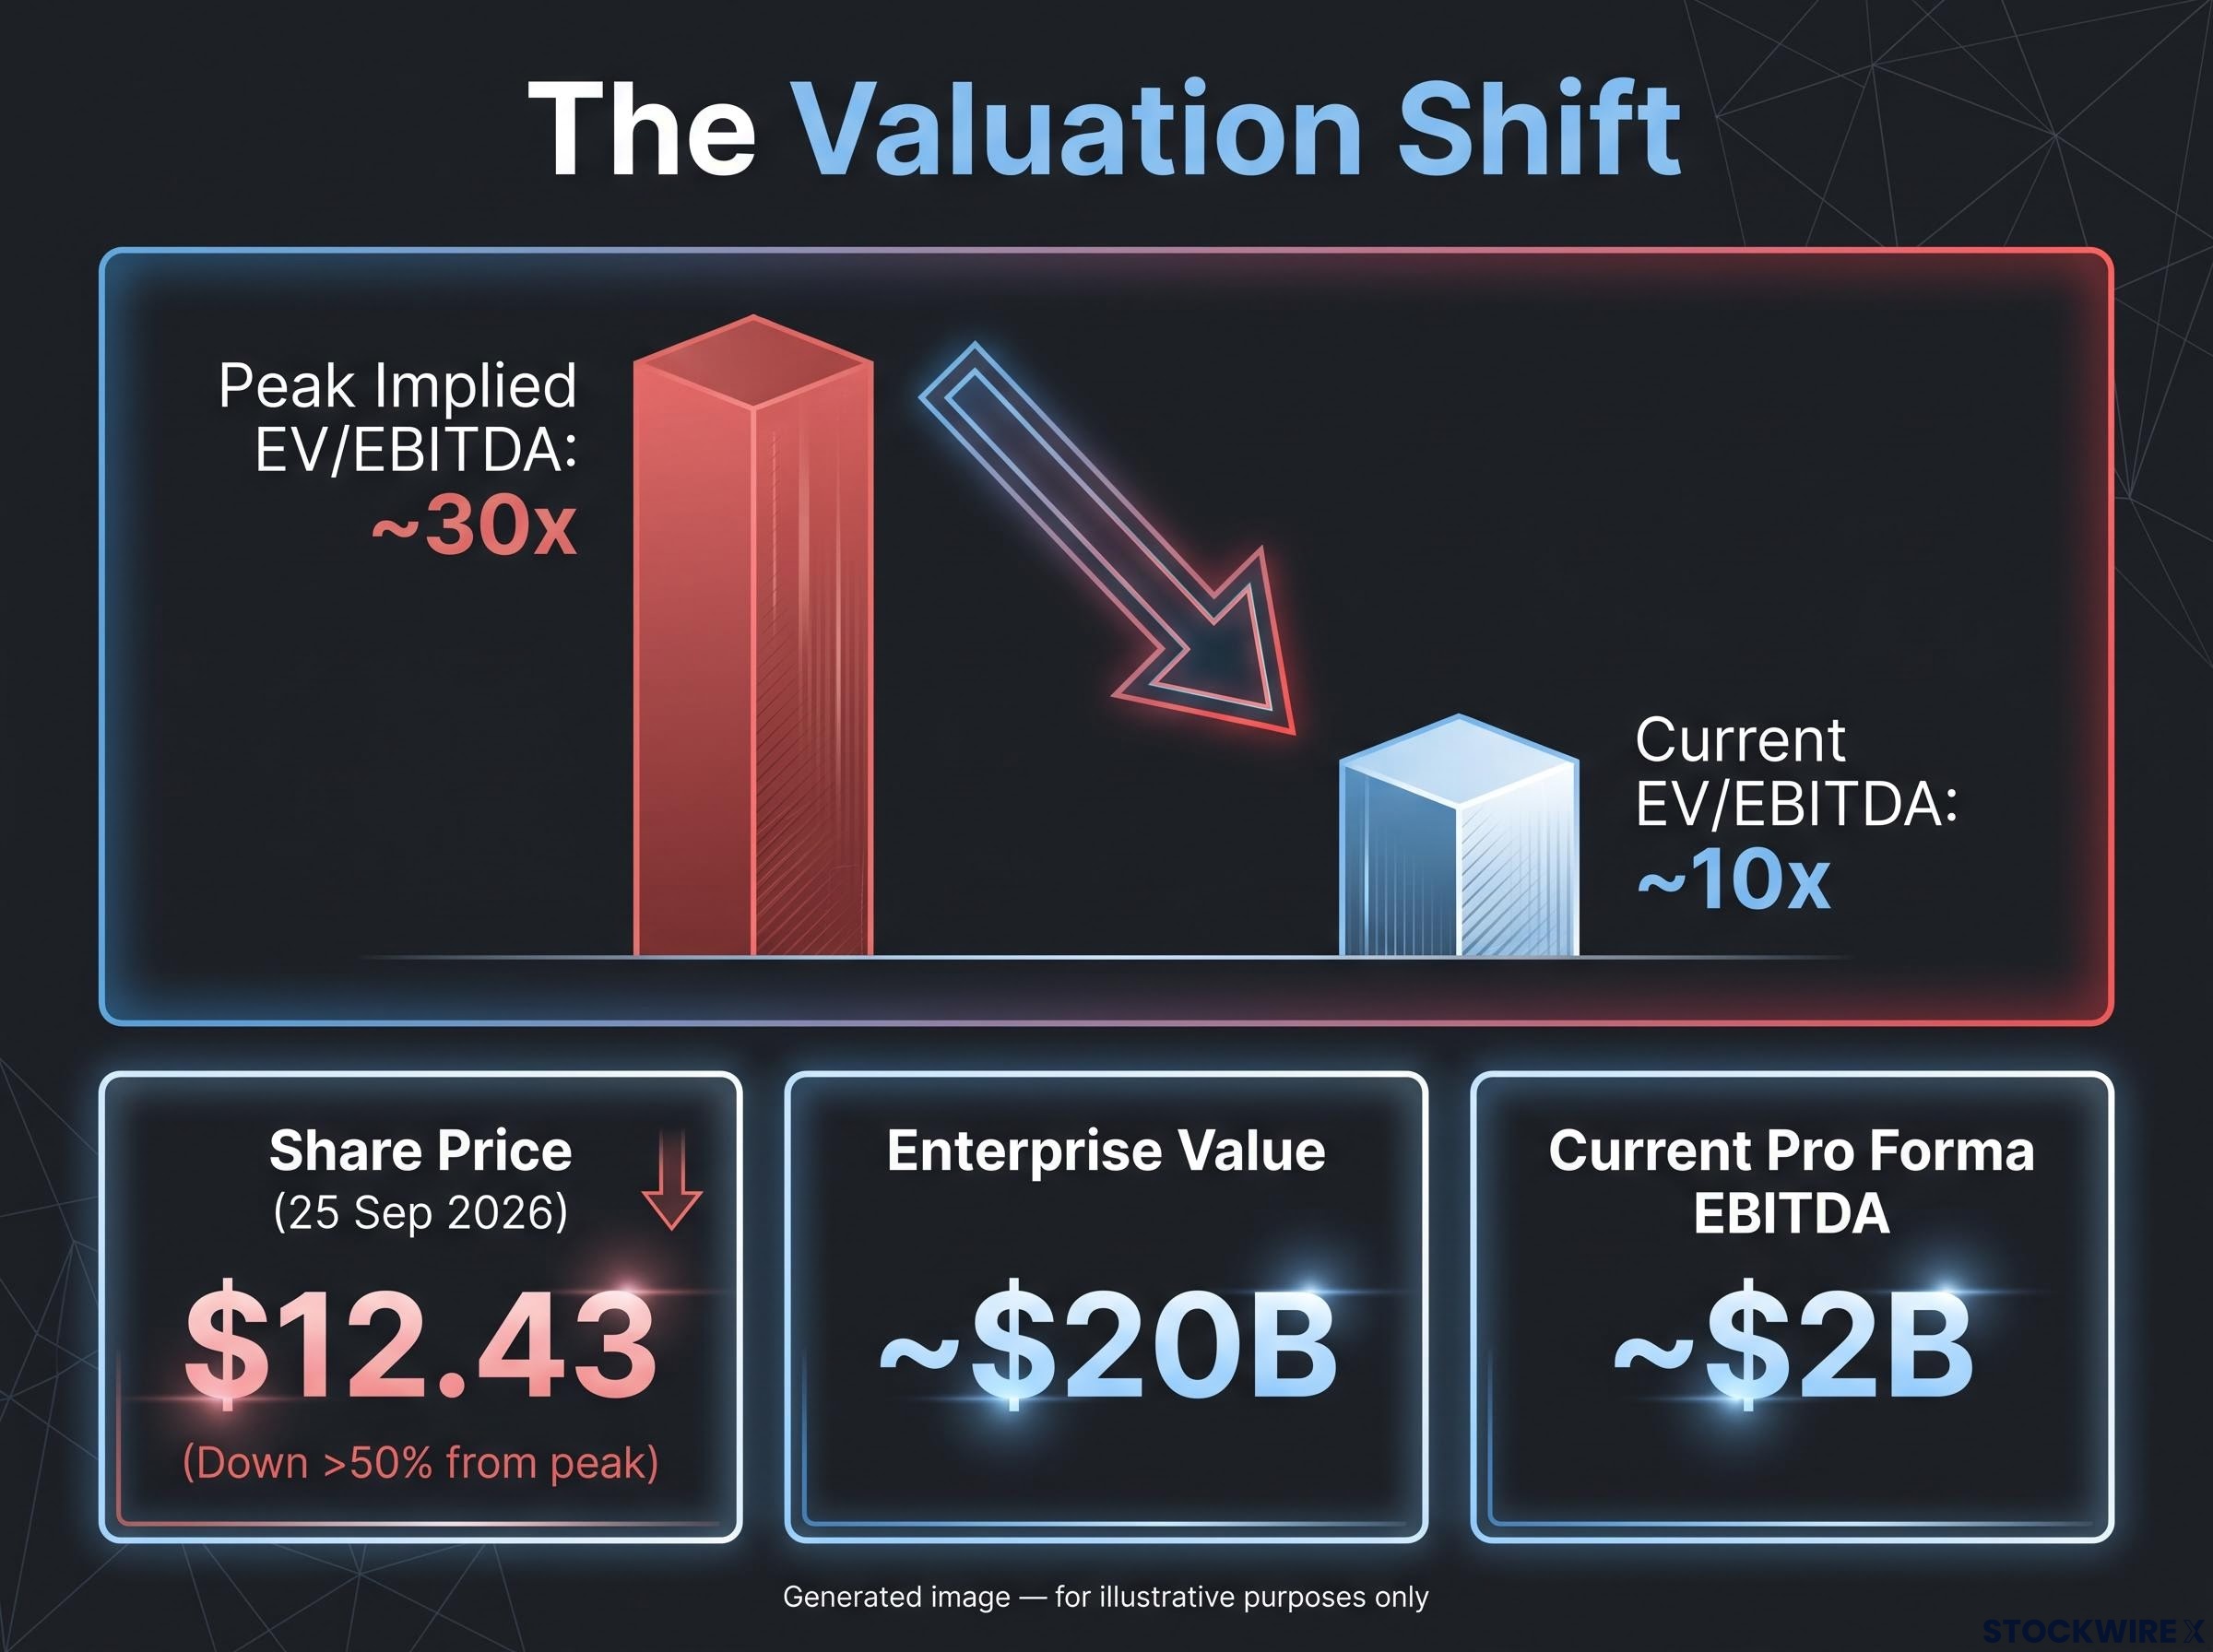
Yet the stock closed at $12.43 on 25 September 2026, down about 35% over the prior year.
This is a framework for deciding whether that discount is an opportunity or a warning. The strategic logic, the financial architecture, and the execution risks each pull in different directions, and the honest read is that the answer is not yet visible in the numbers. What follows here separates the variables that will actually resolve the question from the generic acquisition-risk noise that will not.
Brad Jacobs has done this before, and the playbook is not a mystery
The reason the share-price decline is not automatically a verdict on the strategy is simple: Jacobs has run this exact play three times and made investors serious money each time. He does not theorise about consolidating fragmented industries. He has done it, at scale, in sectors most people considered unglamorous and operationally messy.
His methodology is documented in his own words. Jacobs wrote How to Make a Few Billion Dollars in 2024, laying out the approach: acquire a platform in a fragmented industry, bolt on additional companies, standardise the operations, and extract the scale advantages that individual operators simply cannot access.
Here is the track record he built before QXO:
- United Waste Systems: consolidated a fragmented waste management sector before it was folded into Waste Management, one of the industry’s giants.
- United Rentals: rolled up the equipment rental industry into what became the largest player of its kind in North America.
- XPO Logistics: built a global logistics platform that later spun off two additional listed companies, GXO and RXO, each a business in its own right.
That is not a single lucky outcome. It is a repeatable pattern applied across three distinct industries, and it is why the reader should weigh Jacobs’ pedigree seriously before treating a falling stock as proof the thesis is wrong.
Why building products distribution, and why now
The sector choice is deliberate. Building products distribution is a roughly $800 billion total addressable market by management’s estimate, and it is served by thousands of regional and local distributors running inconsistent pricing, procurement, and technology.
That fragmentation is precisely the condition Jacobs exploited at United Rentals, where scattered equipment rental operators had no way to match a consolidated player on purchasing power or logistics. The structural parallel is real. The open question is whether distribution, where local customer trust and installer relationships carry more economic weight than in equipment rental, is genuinely as standardisable as the equipment business proved to be.
QXO’s revenue mix offers a partial cushion. The business splits roughly 50% repair and remodel against 50% new construction, and around 60% residential to 40% commercial. That repair-and-remodel weighting matters because renovation spending holds up better than new builds when housing cycles turn, giving the platform more earnings stability than a pure new-construction operator would have.
When big ASX news breaks, our subscribers know first
Three acquisitions, $30 billion deployed, and what QXO actually owns now
Understanding what QXO owns means walking through the three deals in sequence, because each one adds something the others do not. This was assembled as a system, not a shopping spree.
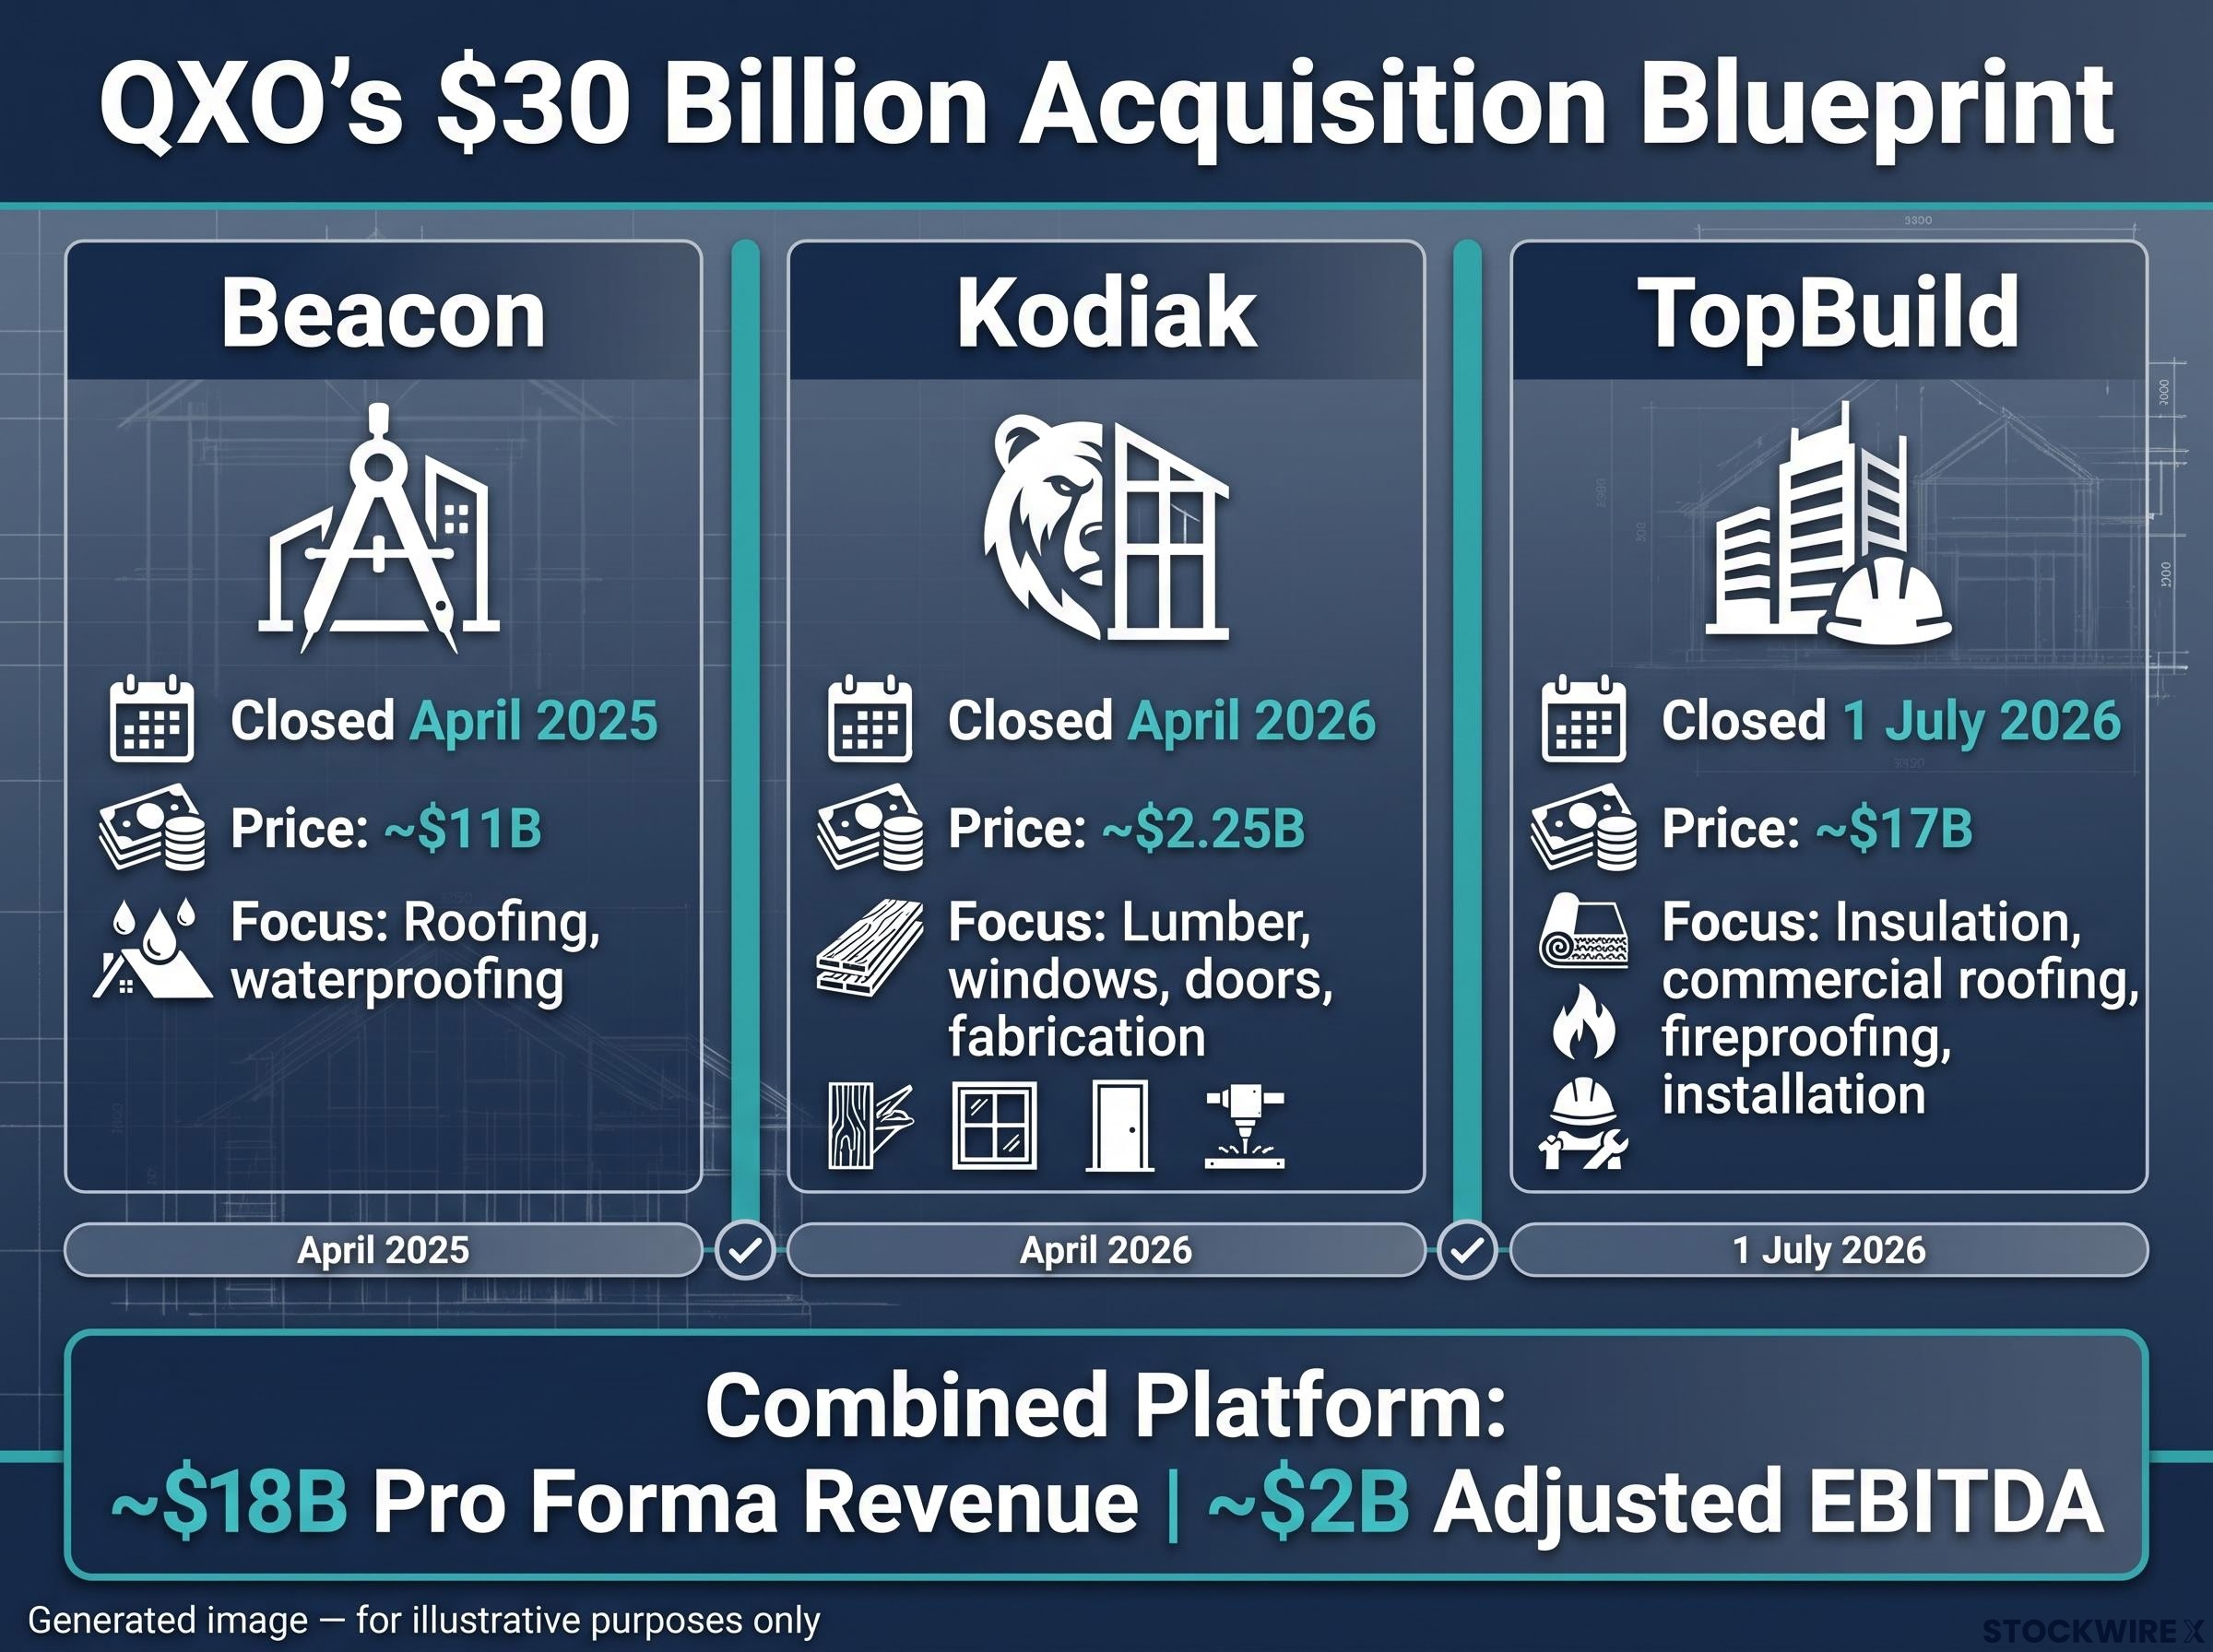
Beacon Building Products came first, acquired for approximately $11 billion and closed in April 2025. It anchored the platform in roofing and waterproofing, the core distribution categories where QXO wanted scale.
Kodiak Building Partners followed at roughly $2.25 billion, closing in April 2026. Kodiak widened the product scope into lumber, windows, doors, and fabrication, and added installation and construction supply capabilities that Beacon alone did not cover.
TopBuild was the largest and most strategically important, acquired for approximately $17 billion and closed on 1 July 2026. TopBuild brought insulation, commercial roofing, and fireproofing, and critically it added installation services, moving QXO beyond pure distribution into the install side of the value chain.
| Acquisition | Focus Area | Price | Close Date | Multiple (pre-synergy) |
|---|---|---|---|---|
| Beacon Building Products | Roofing, waterproofing | ~$11B | April 2025 | 11-15x range |
| Kodiak Building Partners | Lumber, windows, doors, fabrication | ~$2.25B | April 2026 | 11-15x range |
| TopBuild | Insulation, commercial roofing, fireproofing, installation | ~$17B | 1 July 2026 | ~14.9x |
The discipline showed up in what QXO chose not to buy. When Home Depot submitted a higher competing bid for GMS, QXO walked away rather than overpay, a signal that the deal-making has a valuation ceiling rather than a fill-the-basket mandate.
Still, TopBuild was priced at a full strategic premium: approximately 14.9x 2025 adjusted EBITDA before synergies, falling to 11.8x only after synergies are assumed. That distinction matters enormously for the reader, because QXO is betting that the synergy case closes that gap. The thesis lives or dies on whether those synergies are real and achievable within the stated window.
Pro forma combined position (per July 2026 Investor Q&A) Approximately $18 billion in combined revenue and nearly $2 billion in combined adjusted EBITDA, based on 2025 actual results adjusted to reflect full-year ownership of Beacon, Kodiak, and TopBuild.
The asset base is now concrete and auditable. The question has shifted from what QXO is buying to whether it can extract the value it paid for, and that is where investors should be looking.
How the $2 billion profitability improvement is supposed to work
Owning the assets is one thing. Turning them into the profit management has promised is where the real work sits, and QXO’s approach has a specific name and a specific structure.
The company calls its model “federated.” The idea is to standardise the things that scale, systems, data, pricing architecture, procurement, finance, and governance, while deliberately preserving the local customer relationships and installer scheduling that make each acquired business work. That local trust is not incidental. It is the economic moat QXO paid for, and destroying it in the name of integration would defeat the point.
The synergy hierarchy: where the value is supposed to come from
The composition of the synergies tells you where the risk sits. Management has been explicit that this is not primarily a back-office cost-cutting story.
“The majority of the synergies are related to revenue and gross profit,” QXO stated in its Investor Q&A, identifying the biggest synergy bucket as sales excellence, especially pricing discipline and cross-selling, followed by scaled procurement.
That framing should give the reader pause in a constructive way. Revenue and gross profit synergies depend on front-line salesforce execution and on customers accepting pricing changes. They are inherently harder to guarantee than headcount reductions or consolidated back offices, which makes the synergy case more uncertain than the clean headline numbers suggest.
The specific operational levers
Underneath the hierarchy sit concrete mechanisms. These are the named levers management has pointed to:
- Private-label consolidation: merging multiple brands into a single private-label offering to strengthen purchasing leverage with suppliers and widen margins.
- Delivery route density: denser routing and fuller truck loads across a broader footprint to cut logistics cost per delivery.
- Technology standardisation: moving disparate systems onto one platform for unified inventory, pricing, and demand forecasting.
- Inventory management: improving availability across a denser store network to reduce lost sales.
- Beacon stockout resolution: fixing Beacon’s frequent stockouts of top-selling items, named specifically as a meaningful margin opportunity.
That last lever is worth explaining, because a stockout is not just a service annoyance. When a top-selling product is unavailable, the customer either walks or buys elsewhere, so availability is a direct revenue and margin lever, not merely a metric on a dashboard.
The $2 billion target and what has actually been confirmed
Precision matters here, because two different numbers circulate and they carry different weights of confirmation. The $300 million in annual TopBuild-specific synergies by 2030 appears consistently across QXO’s accessible 2026 investor materials, including the April and July 2026 disclosures.
The broader $2 billion cumulative profitability improvement target by 2030, which appears in original source material, is not explicitly restated in the accessible post-TopBuild investor documents. The component levers are described, but the aggregate figure is not reaffirmed in the same way. Readers should treat the $300 million figure as firmly confirmed and the $2 billion figure as a directional ambition rather than a hard, restated commitment.
For valuation work, the more grounded near-term anchor is management’s $4-6 billion EBITDA planning range. The $50 billion revenue goal, by contrast, is a decade-long ambition and should not be treated as a near-term driver of value.
Where the thesis is exposed: leverage, cycles, and the valuation gap
For all the operator pedigree, the risks here are genuine and specific, and they deserve precision rather than hand-waving. Four exposures matter most.
- Integration complexity: QXO is absorbing three large businesses simultaneously, each with its own culture, systems, and end markets, which strains management bandwidth and invites friction.
- Leverage: debt financing for TopBuild has pushed borrowing to elevated levels, leaving less financial cushion if results disappoint.
- Cyclicality: the platform remains tied to housing and construction, so a sustained slowdown would hit volumes and delay synergy capture.
- Valuation compression: the multiple that made the roll-up math work has narrowed sharply, raising the pressure to deliver operationally.
On leverage, S&P Global Ratings affirmed QXO’s rating on 1 June 2026 in connection with the TopBuild deal, describing leverage as temporarily elevated in 2026. The stable outlook rests on a specific condition: leverage falling below 5x by 2027 through EBITDA growth and debt repayment. If that trajectory slips, financial flexibility tightens and equity holders carry more downside.
The cyclicality risk is partly cushioned by the repair-and-remodel mix, but only partly. A prolonged decline in housing starts or commercial construction would compress volumes and stretch the timeline for realising synergies, precisely when leverage needs EBITDA growth to come down.
The construction sector backdrop intersects with broader market conditions: elevated leverage signals across the US equity market, including a 54% year-over-year surge in margin debt to a record $1.4 trillion, add a macro dimension to the cyclicality risk QXO carries at a time when its own balance sheet is already stretched.
Then there is the valuation story, which is where the market’s changed mind is clearest.
| Metric | At Peak | Current (25 Sep 2026) | Implication |
|---|---|---|---|
| Share price | Peak levels | $12.43 | Down more than 50% from peak |
| Market capitalisation | Materially higher | ~$12.72B | Investor patience being tested |
| Enterprise value | Materially higher | ~$20B | Reflects added acquisition debt |
| Implied EV/EBITDA | ~30x | ~10x (on ~$2B pro forma EBITDA) | Multiple-arbitrage headroom has narrowed |
The move from roughly 30x EV/EBITDA at peak to approximately 10x today, an approximate figure derived from the pro forma EBITDA base, tells the reader something specific. The market has stopped pricing in a successful roll-up premium and started pricing in execution risk and cyclical exposure instead.
The investment decision now hinges on whether that repricing is an overreaction or a fair reflection of what three simultaneous integrations actually demand. Notably, Michael Burry, the deep-value investor, has disclosed a position in both QXO common and preferred shares, a data point on where value-focused capital has been looking, though not a validation of the thesis.
The share-price decline is not a signal that the thesis is broken. It is a signal that the burden of proof has moved from “is this strategy credible” to “can this team execute three integrations at once, in a softening construction market, while managing elevated leverage.” Those questions decide the next 18 months.
Three variables that will determine whether QXO’s discount is a buying opportunity or a value trap
The honest way to close this is not with a verdict but with a monitoring framework, because the information needed to resolve the thesis does not yet exist in public disclosures. Here are the three variables to watch, in priority order:
The distinction between a temporary drawdown and permanent capital loss is not academic when evaluating a position like QXO: a thesis that proves wrong after three simultaneous integrations have consumed $30 billion and elevated leverage leaves little room for recovery without sustained EBITDA delivery.
- Synergy velocity. Watch for quantified, auditable synergy captures appearing in reported results, not just reaffirmed targets. The first hard checkpoint is the S&P leverage covenant: leverage falling below 5x by 2027, which the market can use as a proxy for whether synergies are actually converting into cash. Accessible 2026 materials contain no quantified realised synergies yet, which is information the market is waiting on rather than a red flag in itself.
- Housing and construction demand. The repair-and-remodel mix buffers QXO from pure new-build cycles, but volumes still drive the synergy case. Watch housing starts, renovation spending indices, and commercial construction permit data as leading indicators for the volume assumptions underneath management’s targets.
Census Bureau housing starts data provides the primary leading indicator for new construction volume, and investors tracking QXO’s synergy timeline should monitor it alongside renovation spending indices to gauge whether the volume assumptions underneath management’s EBITDA targets are holding.
- Valuation re-rating conditions. A re-rating back toward the historical roll-up premium requires demonstrated synergy delivery and a credible path to the $4-6 billion EBITDA range. Michael Burry’s position is a data point on deep-value interest, not a green light. The combined revenue starts at roughly $18 billion pro forma, with management guiding toward the low-$20 billion range on mid-single-digit organic growth.
The near-term public checkpoint S&P’s condition, leverage below 5x by 2027, is the single cleanest proxy the market has for whether integration is delivering. Track it as the synergy progress signal.
For a reader deciding whether to initiate, add to, or exit, the framing is deliberately unresolved: the evidence that settles the question has not been reported yet. The next 12-18 months of results will be the first genuine test of whether Jacobs’ methodology translates to building products distribution at this scale.
What Jacobs has to prove, and when the market will start believing it
The core tension does not resolve neatly, and pretending otherwise would do the reader a disservice. The acquisition logic is coherent, the operator has a documented record across three industries, and the entry multiple at roughly 10x pro forma EBITDA is far more attractive than the 30x peak.
Against that, three simultaneous integrations with elevated leverage in a potentially softening construction market is a genuinely hard execution environment.
The $50 billion revenue target is a decade-long ambition and should not be expected to drive near-term valuation. The next real catalyst is the first auditable evidence of synergy realisation in reported financials, not another strategic announcement.
A credible progress signal by mid-2027 would look like three things together: leverage tracking toward the S&P 5x threshold, quantified synergy captures disclosed in earnings materials, and organic revenue growth in the mid-single-digit range, bridging the roughly $2 billion EBITDA starting point toward the $4-6 billion planning range.
The shift from a 30x peak multiple to roughly 10x today captures the whole debate: the market has stopped pricing optimism and started pricing execution risk.
The discount is analytically justifiable given what is currently known. But the thesis is not broken, and the difference between a value trap and a buying opportunity will be resolved by operating results, not by further ambition.
This article is for informational purposes only and should not be considered financial advice. Investors should conduct their own research and consult with financial professionals before making investment decisions. Past performance does not guarantee future results. Financial projections are subject to market conditions and various risk factors, and forward-looking statements are speculative and subject to change based on market developments and company performance.