Right now, the average company listed on the Australian Securities Exchange is trading below what an independent analyst thinks it is worth. Most investors would tell you the opposite, that the market looks expensive, and they would be relying on a number that quietly misleads them.
The reason for the disagreement is not the market. It is the measuring stick. The way most investors read the ASX, by weighting it toward the biggest names, hides a valuation story that only appears when you count each company equally. According to Morningstar, that gap has widened to a level rarely seen over the prior decade.
This is a question of where value actually sits when the headline benchmark says one thing and the underlying companies say another. Using Morningstar’s end of Q2 2026 data and the analysis published in September 2026, here is how to locate where ASX small-cap value genuinely exists today, and the quality filters worth applying before you act on it.
The numbers that reveal a two-speed ASX
Two measurements of the same Morningstar Australian equity coverage tell completely different stories, and the distance between them is the whole point.
Measured on an equal-weighted basis, where every company counts the same regardless of size, Morningstar’s coverage was trading at roughly a 3% discount to fair value at the end of Q2 2026. Measured on a size-weighted basis, where the largest companies dominate the calculation, that same coverage sat at around a 10% premium to fair value.
That is a spread of 13 percentage points between two readings of an identical set of companies.
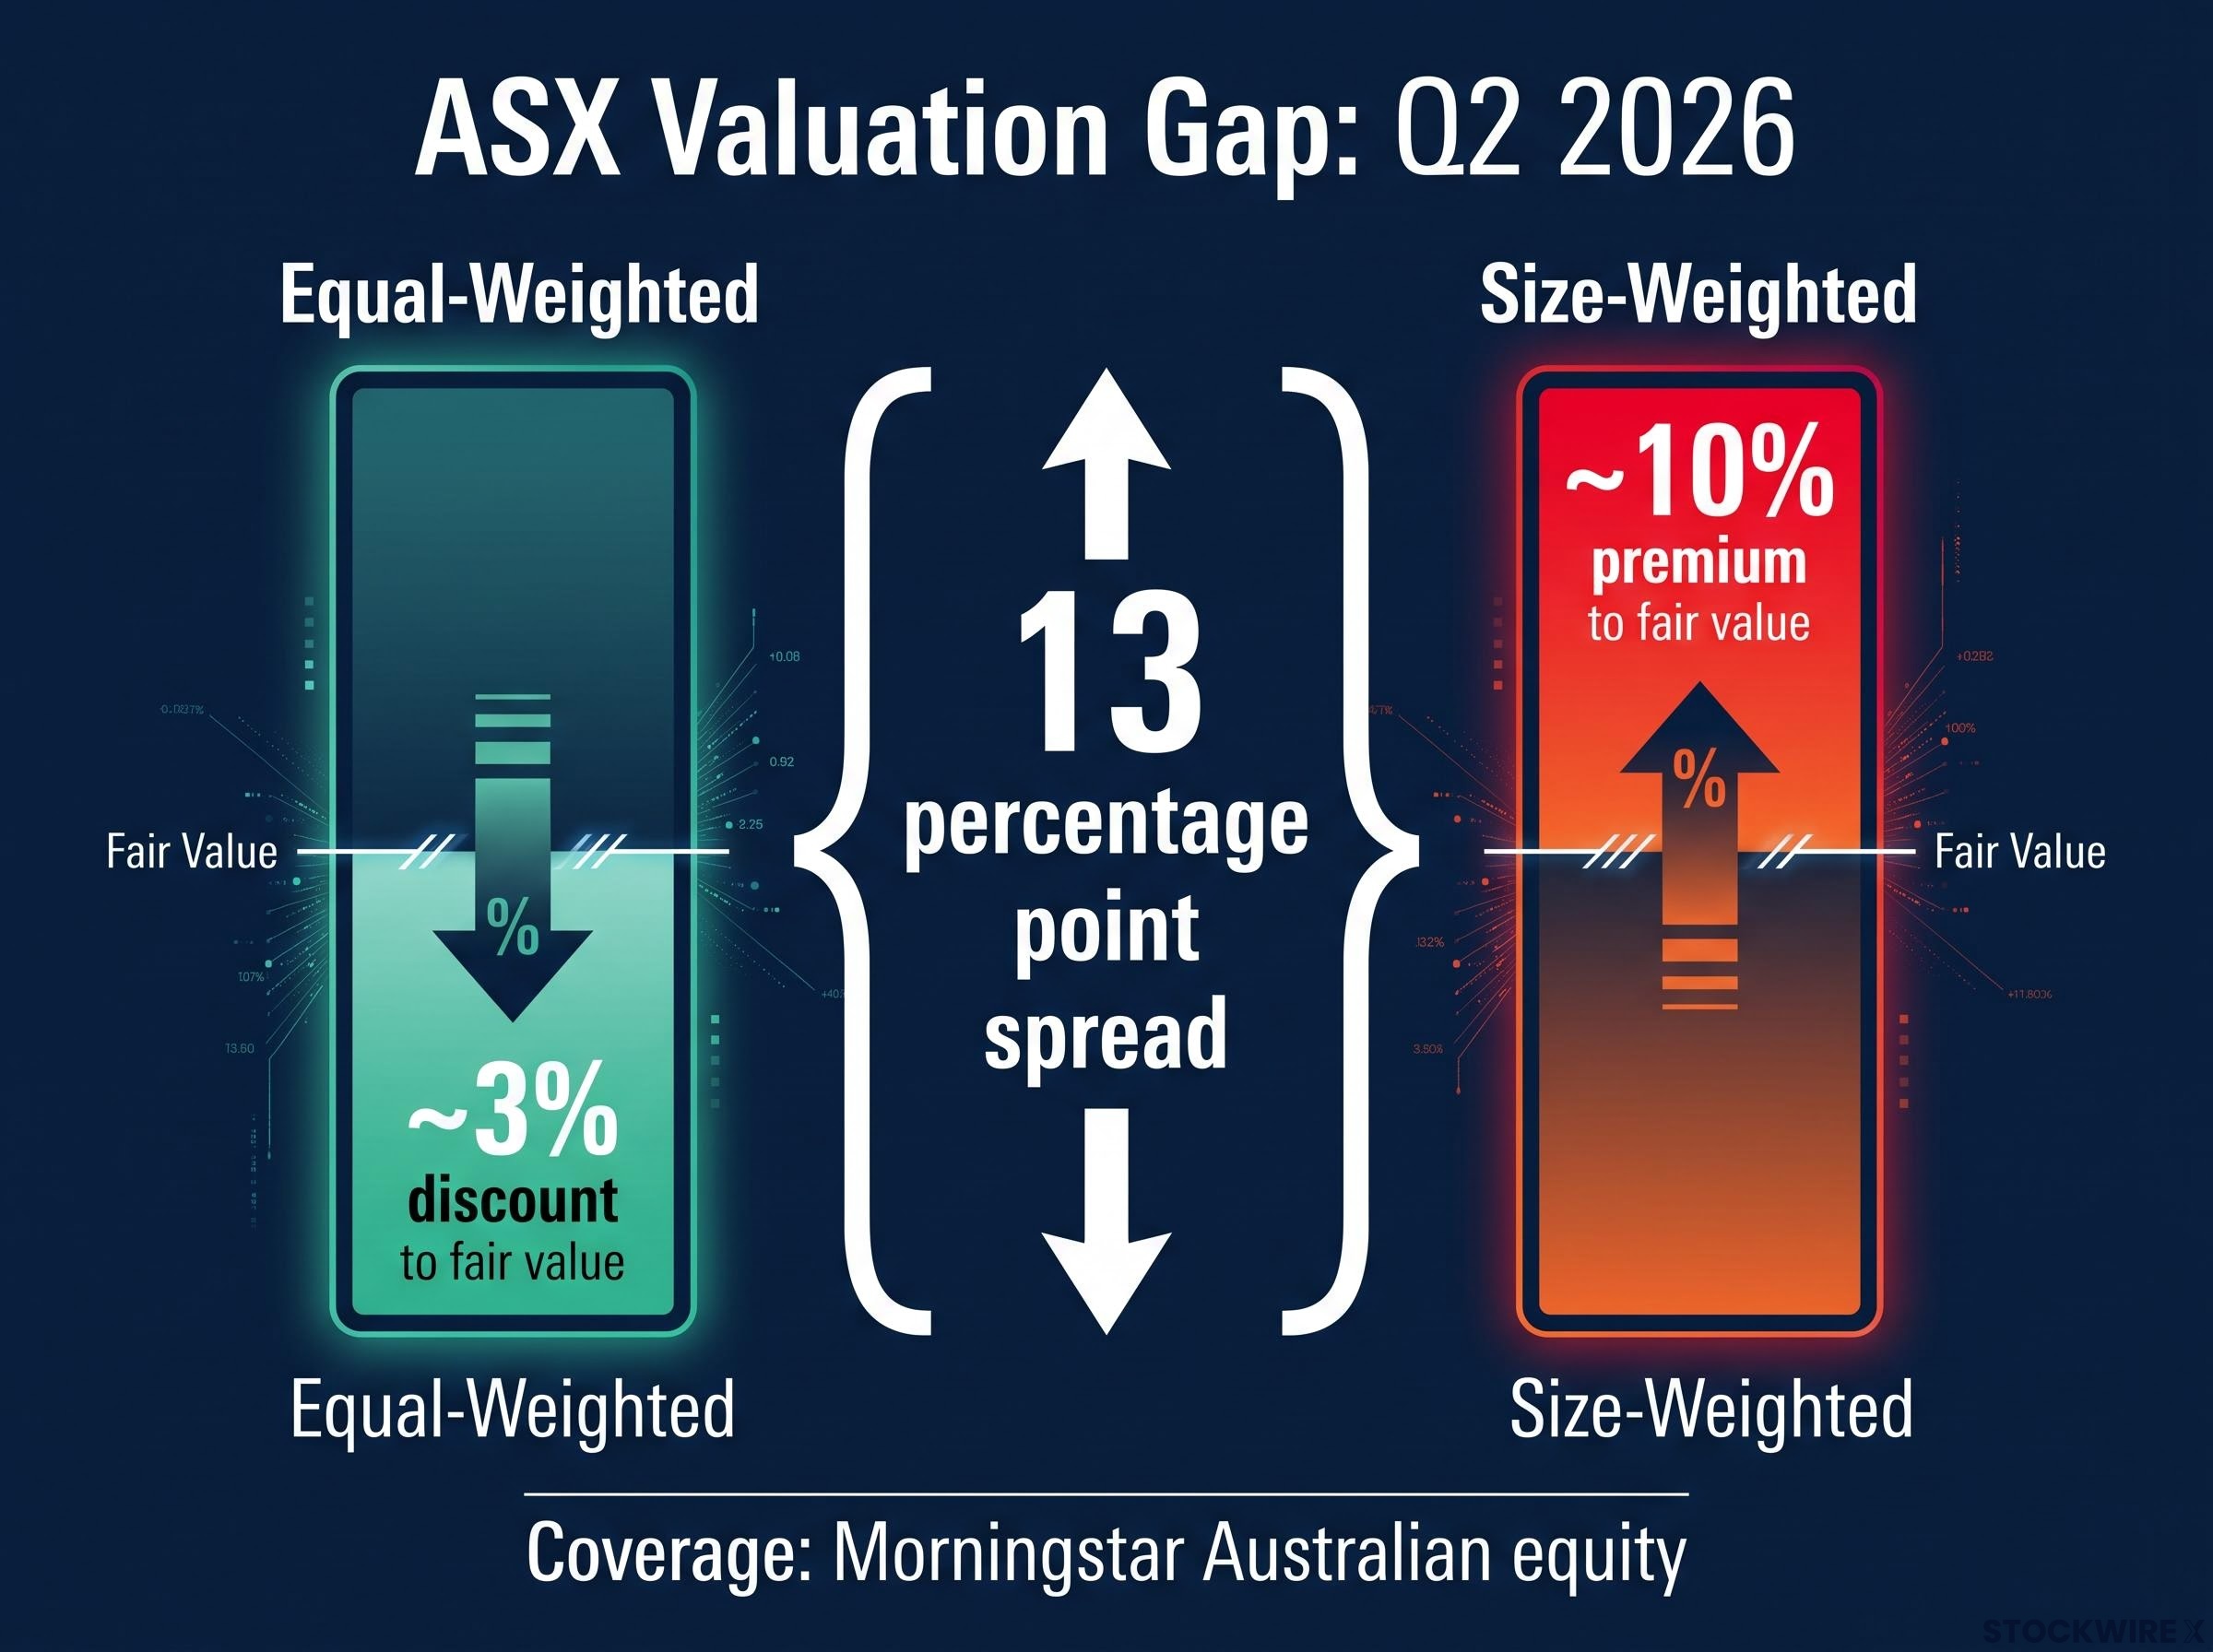
The equal-weighted market was priced at a 3% discount to fair value. The size-weighted market was priced at a 10% premium. The same companies, measured two ways, produce a 13-percentage-point gap.
The reason the two numbers diverge so sharply is structural, not accidental. A size-weighted figure is dominated by a handful of giants, the big banks and miners, and when those names are bid up, they drag the aggregate reading with them. That is exactly why the average investor, anchored to a cap-weighted view, concludes the market is expensive.
ASX cap tiers run from large-cap (above $10 billion) through mid-cap and small-cap down to micro and nano-cap, with each tier carrying distinct liquidity, volatility, and analyst coverage characteristics that explain precisely why a size-weighted aggregate reading and an equal-weighted one can diverge by 13 percentage points on the same universe.
| Measurement method | Coverage universe | Price-to-fair-value reading | Implied positioning |
|---|---|---|---|
| Equal-weighted | Morningstar Australian equity coverage | ~3% discount | Broadly undervalued once every company counts equally |
| Size-weighted | Same Morningstar coverage | ~10% premium | Pulled above fair value by the largest names |
According to Morningstar Market Strategist Lochlan Halloway, this divergence is the clearest available expression of the valuation gap on the ASX today. Conditions have shifted over the past year. A separate Morningstar reading from mid-2025 had the coverage universe around 4% above fair value on an equal-weighted basis, a different point in the cycle that is not directly comparable to the current figure.
What the gap tells you is direct. Australia’s largest companies have been bid up to a level that makes the whole market look pricey, while the majority of listed companies by count are quietly discounted. That is the opportunity to understand before deciding whether to act on it.
When big ASX news breaks, our subscribers know first
Why large-caps get bid up and smaller companies get left behind
Once you see the gap, the obvious question is why it exists at all. It is not a market quirk. It is the predictable outcome of how investors behave when they are uncertain.
Four mechanisms do most of the work:
- Liquidity preference: When the macro picture is cloudy, capital rotates into large, liquid, index-heavy names such as banks, miners, and defensives, bidding their multiples up regardless of underlying value.
- Interest-rate sensitivity: Growth-oriented smaller companies carry longer-duration cash flows, meaning more of their expected value sits further in the future, so rising discount rates compress their valuations harder than mature large-caps.
- Passive index flows: Money flowing into ASX 200 and ASX 100 vehicles mechanically favours the biggest names, reinforcing the large-cap premium with a persistent, structural bid.
- Earnings visibility: Large-caps offer steadier earnings and broader analyst coverage, which supports higher multiples when uncertainty is elevated, while thinner coverage leaves smaller companies discounted.
These are not random forces. They are the expected response to rate and risk conditions, which means understanding them lets you anticipate the moments when the gap begins to close, rather than noticing it only after the rotation has happened.
Domestic factors sharpen the picture for smaller companies tied to the local economy. Morningstar notes that a housing market boosted by an expanded 5% deposit scheme for first-home buyers is now tapering, and that changes to investment-property taxation rules alongside higher rates have cooled property investor demand.
How the small-cap cycle has actually played out
The performance record shows why smaller companies command a discount: they move harder in both directions.
| Year | Small Ordinaries return |
|---|---|
| 2021 | +16.90% |
| 2022 | -18.38% |
| 2023 | +7.82% |
| 2024 | +8.36% |
| 2025 | +24.96% |
The 18.38% drop in 2022 followed by the 24.96% rebound in 2025 captures the drawdown-and-recovery rhythm of the small-cap cycle. Recent months have been softer, with the S&P/ASX Small Ordinaries down 6.20% year-to-date as at 31 August 2026.
Set against a 10-year annualised return of 6.52%, that recent softness reads as cyclical noise rather than structural damage, which is the distinction that matters when you are weighing an entry point.
How to use moat ratings as a quality filter in the small-cap space
A discount alone is not a reason to buy. The harder task is telling genuine value apart from a value trap, a company that looks cheap for good reason. This is where Morningstar’s economic moat rating earns its place.
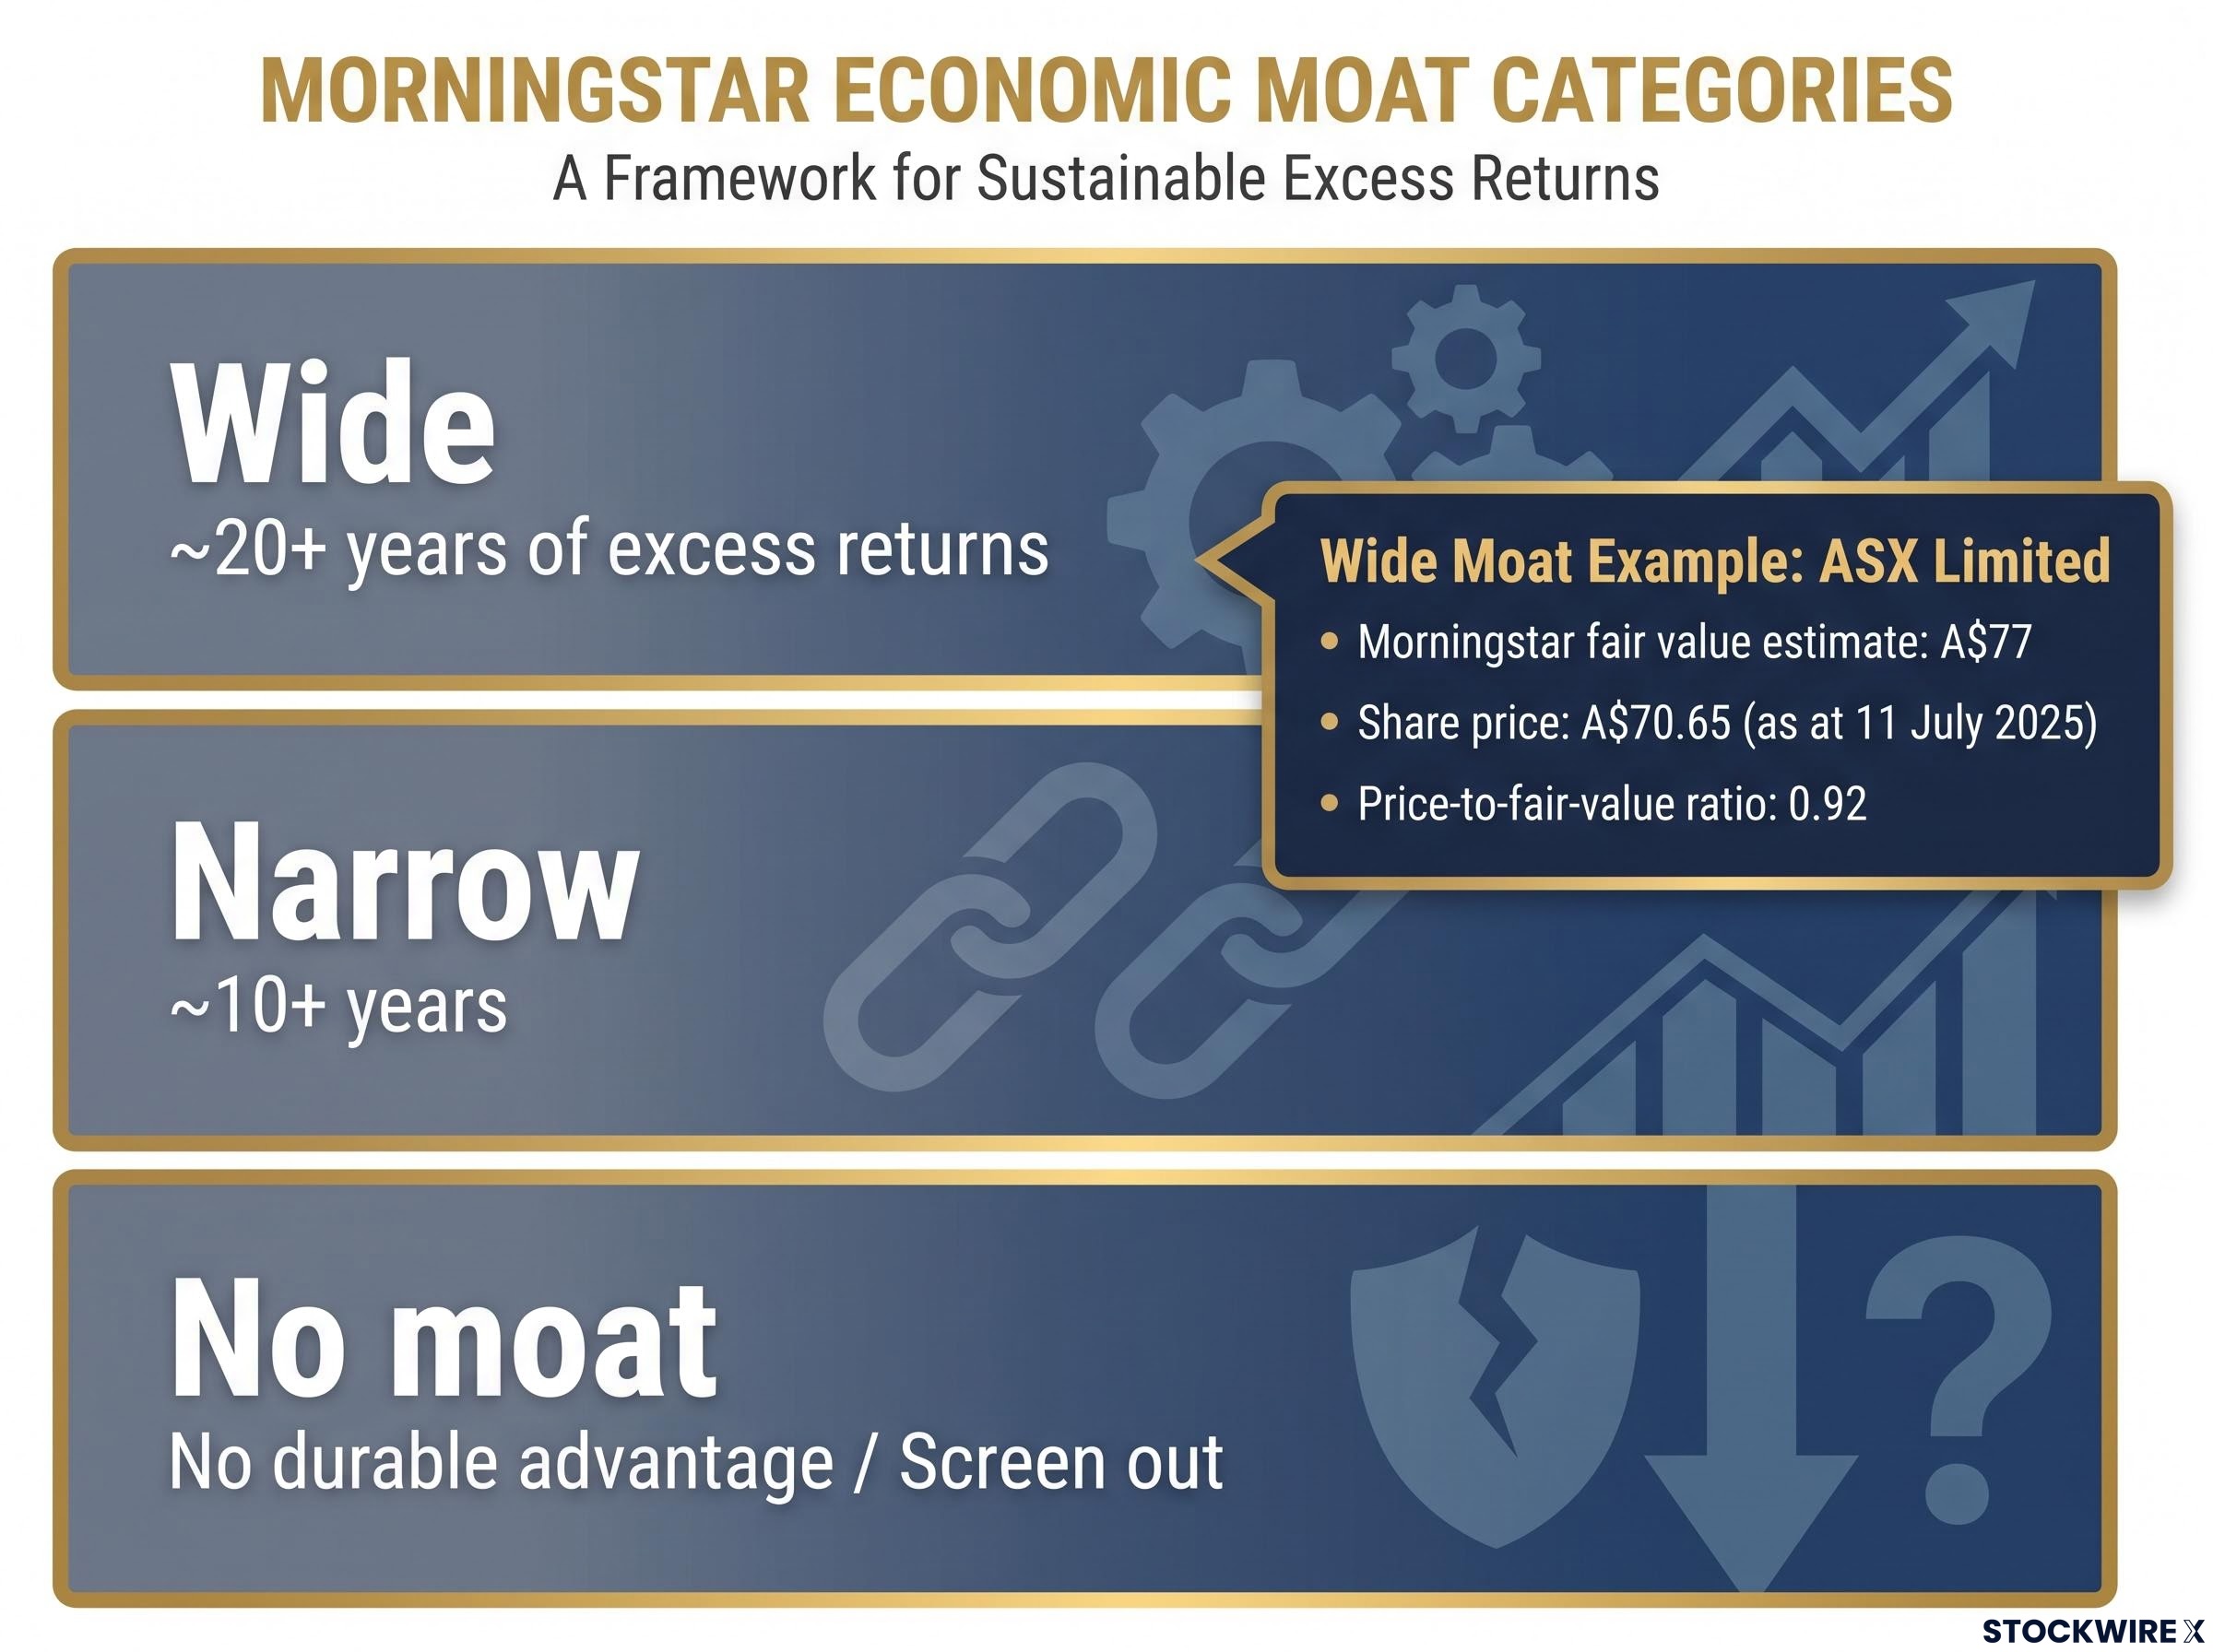
An economic moat is a durable competitive advantage that lets a company keep earning returns above its cost of capital. Morningstar sorts businesses into three categories based on how long that advantage is expected to last.
Economic moat investing applies a consistent quality screen regardless of company size, anchoring on whether a business can sustain returns above its cost of capital across a full cycle rather than during a single favourable period, which is exactly what the small-cap discount opportunity demands.
| Moat rating | Expected duration | Typical sources | Small-cap applicability |
|---|---|---|---|
| Wide | ~20+ years of excess returns | Cost leadership, intangible assets, switching costs, network effects, efficient scale | Rare but powerful signal of durability |
| Narrow | ~10+ years | Similar advantages, less durable or narrower in breadth | Common target when paired with low uncertainty |
| No moat | No durable advantage expected | Commoditised, capital-intensive, or structurally challenged | Screen out regardless of price |
Moat ratings matter far more in the smaller-cap space than among the giants. Down here, earnings are more volatile, analyst coverage is thin, and governance can be weaker, all of which raise the odds that a cheap-looking business is cheap for a reason. The rating is your defence against that.
Applying it comes down to a three-step sequence:
- Screen out no-moat names first. No matter how cheap a smaller company appears, the absence of a durable advantage is a red flag, not a bargain.
- Focus on wide- or narrow-moat names at a material discount. The ideal candidate pairs a recognised moat with a meaningful gap to fair value, giving you valuation upside alongside business-quality reassurance.
- Cross-reference uncertainty ratings. For smaller companies, a narrow moat with low or medium uncertainty is often preferable to a wide moat carrying very high uncertainty, because predictable cash flows are worth more than a fragile advantage.
ASX Limited shows the combination in practice, even though it sits well outside the small-cap universe.
ASX Limited: quality plus discount in action Morningstar fair value estimate: A$77. Share price: A$70.65 as at 11 July 2025. Price-to-fair-value ratio: 0.92. Economic moat rating: wide. A durable business trading below its assessed worth is exactly the profile the framework is built to find.
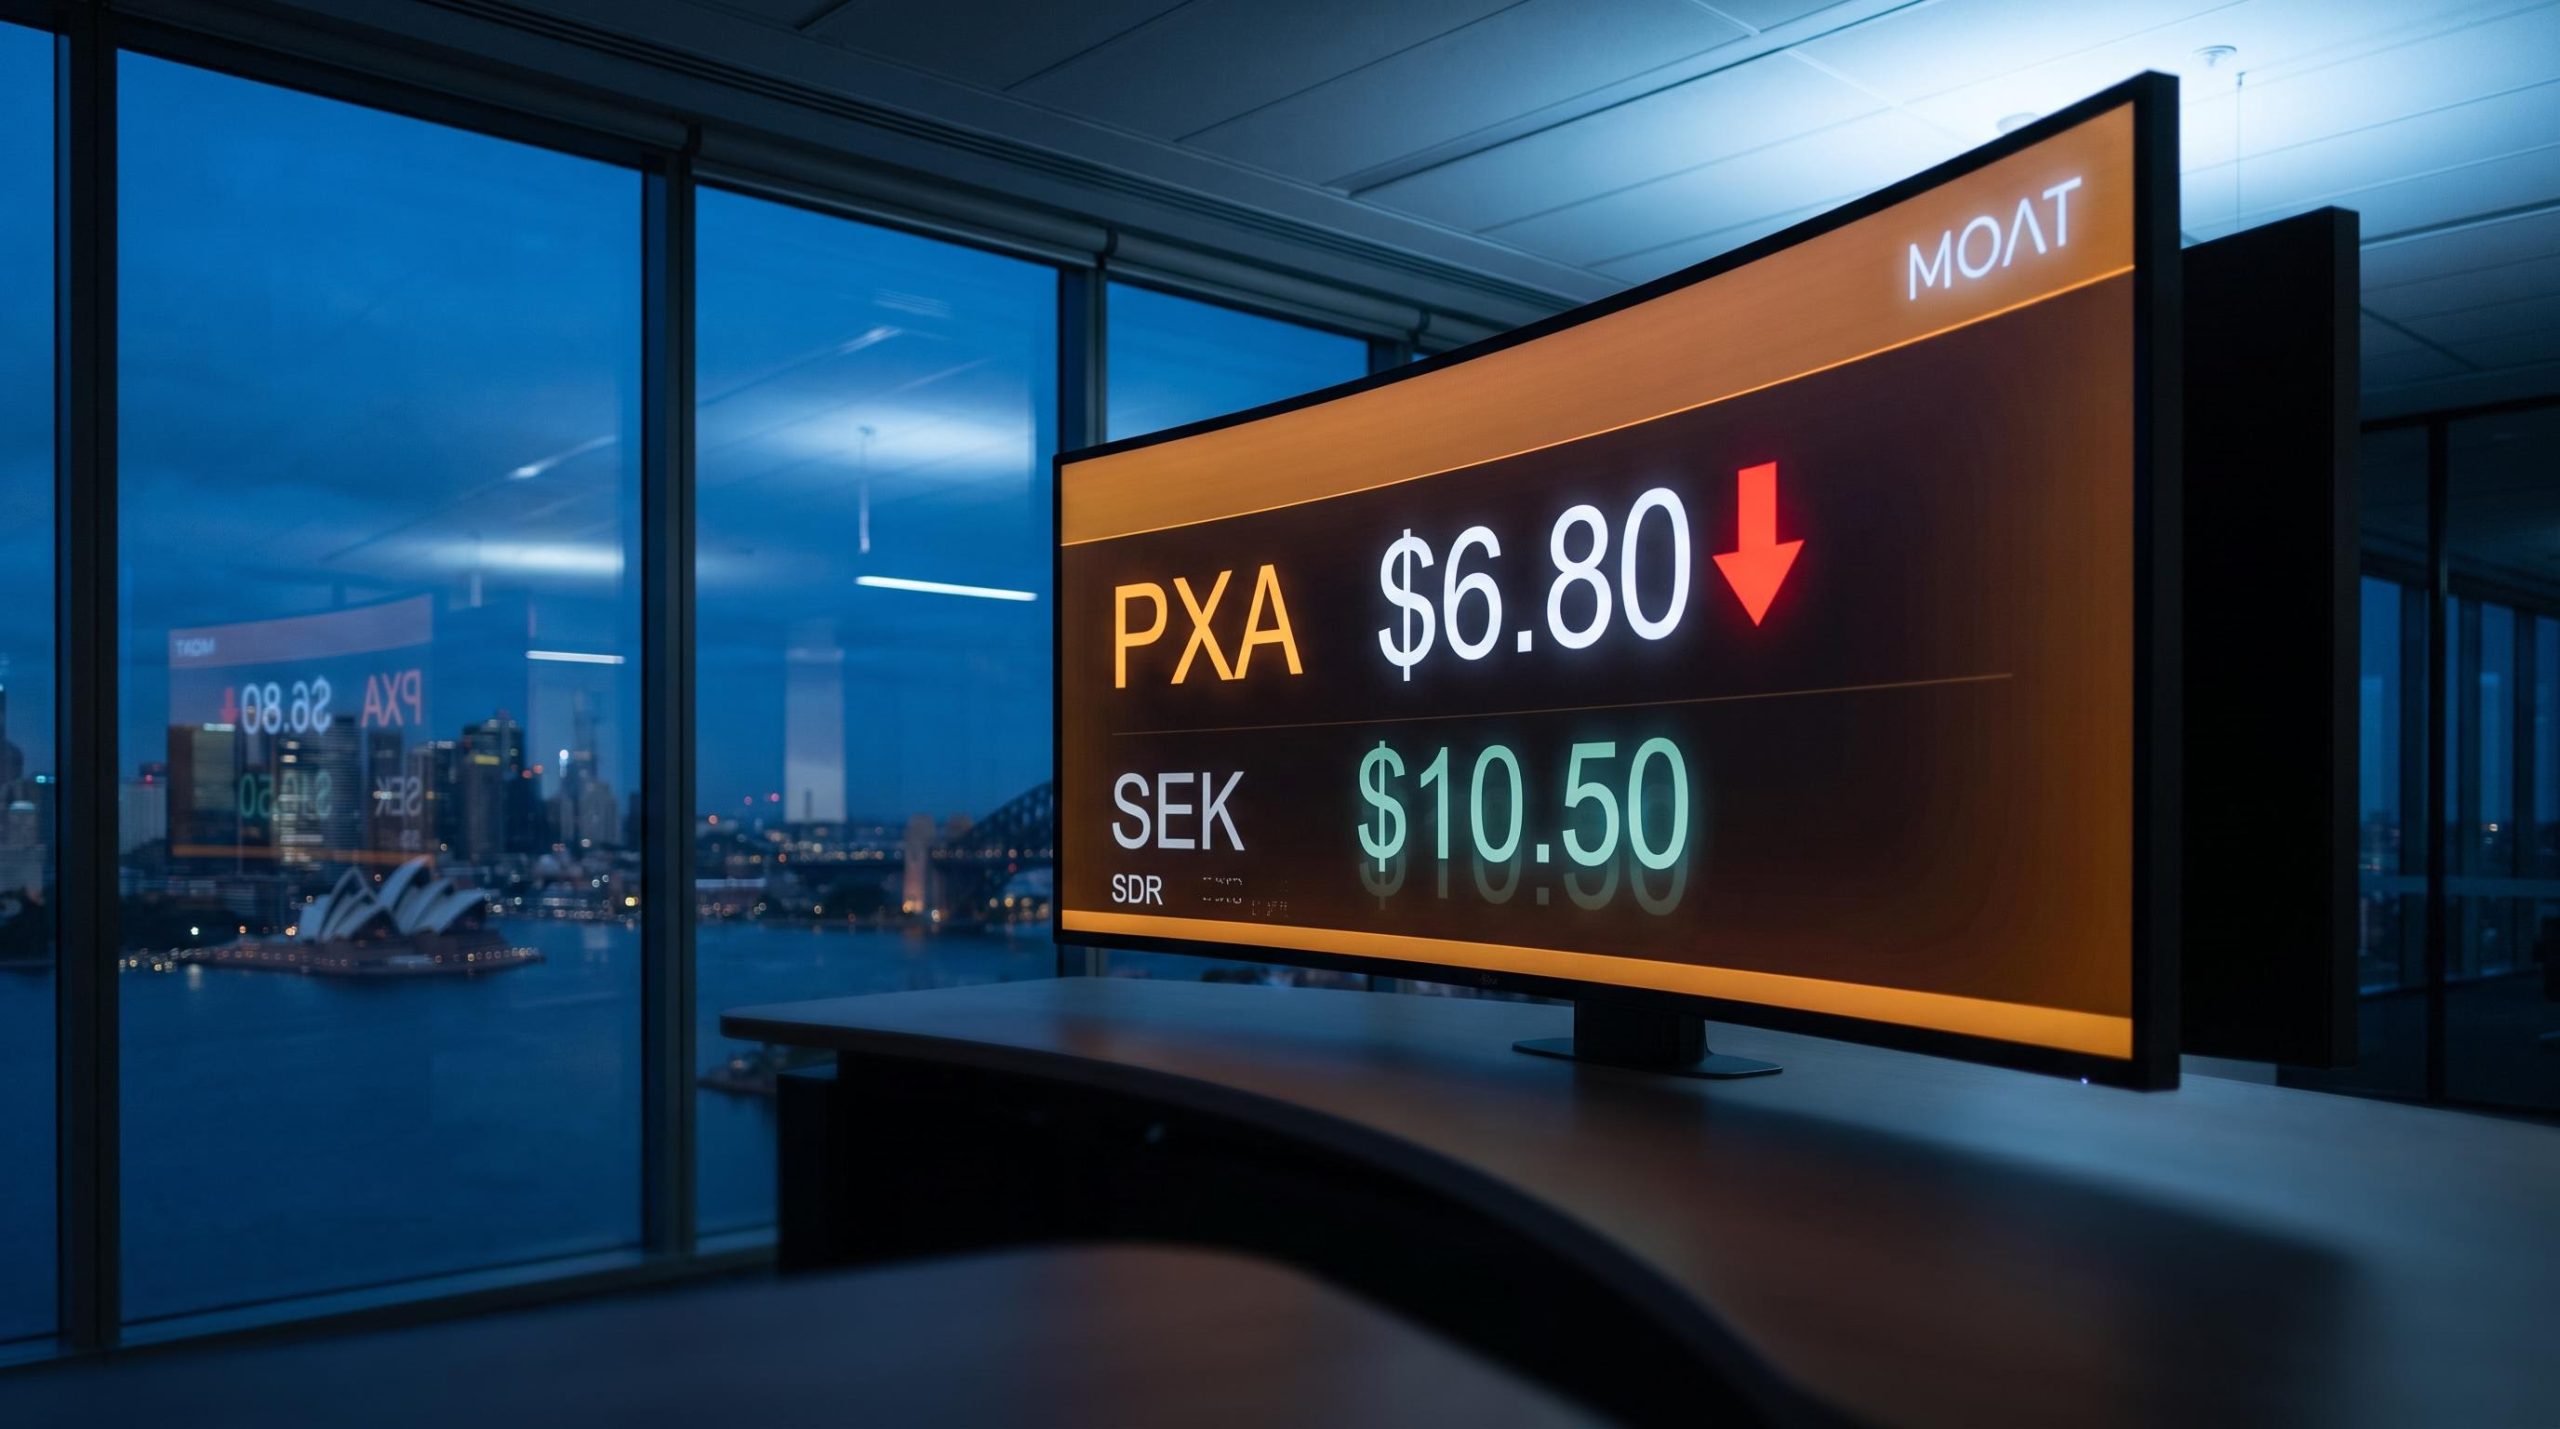
The three smaller companies Morningstar highlighted in its original analysis, PEXA Group, Seek Limited, and SiteMinder, all sit outside the ASX100. Specific current fair value estimates and buy, hold, or sell ratings for these three require access to current Morningstar premium research, so no figures are asserted here.
The lesson holds regardless. A low multiple without a moat is not a margin of safety. It is an invitation to overpay for the wrong business.
What keeps smaller companies cheap, and when that changes
The discount on smaller companies is not a market error waiting to be corrected. It is compensation for real risks, and treating it as free money is how investors get hurt.
Four risks explain most of the persistent discount:
- Liquidity risk: Many ASX small-caps trade thinly, so buying or selling can move the price, forcing a valuation discount as compensation for that difficulty.
- Earnings quality risk: Less mature financial controls and more one-off items mean a low multiple can rest on unsustainable earnings, the hallmark of a value trap.
- Balance-sheet risk: Smaller companies lean more on bank lines and capital markets, so refinancing pressure and higher funding costs can erode equity value in stressed conditions.
- Information asymmetry: Thinner disclosure and less institutional coverage mean bad news can surface slowly and hit share prices harder when it does.
Australian macro factors add specific pressure. The tapering housing market and changes to investment-property taxation weigh directly on domestically exposed businesses, PEXA Group among them, given its property-settlement platform is tied to transaction volumes.
Understanding what you are being compensated for is what lets you judge whether the current spread justifies the exposure, rather than seeing the discount and assuming it is a gift.
Conditions that have historically closed the gap
Large-cap premiums do not last forever. Morningstar’s read on historical patterns points to three conditions that have narrowed the gap before, each one a signal to monitor rather than a forecast to trust.
- Rate-cutting cycles. When central banks pivot from hiking to cutting, the discount-rate burden on long-duration cash flows eases, favouring growth-oriented smaller companies.
- Post-recession recoveries. As risk appetite returns after a downturn, the defensive premium built into large-caps tends to compress while cyclical earnings visibility improves.
- Sector rotations. On an index heavy with financials and resources, any de-rating of banks or miners can shrink the large-cap premium and let domestically exposed smaller names re-rate.
The 18.38% fall in 2022 and the 24.96% rebound in 2025 are recent evidence of how quickly that volatility can swing. The question for you is whether the current 6.20% year-to-date softness, against a 6.52% 10-year annualised return, marks the kind of entry point those historical triggers have followed.
The 2022-2024 ASX market cycle compressed a full sequence of drawdown, stabilisation, and sector rotation into a short timeframe, with Information Technology surging 52% and Financials 34% in 2024 while Energy and Materials reversed sharply, a pattern that illustrates how quickly the conditions favouring large-cap premiums can unwind.
Positioning for the valuation gap without betting the portfolio on it
The analysis builds to a two-part framework, and it is worth stating plainly before you act on any of it.
- Use the valuation gap as your opportunity identifier. The equal-weighted 3% discount against the size-weighted 10% premium tells you where value has migrated: away from the largest names and toward the broader field of smaller companies.
- Use moat ratings as your quality filter. The discount only becomes navigable once you screen for durable competitive advantages, which is why Morningstar recommends moat ratings as a key filter given the elevated risks in the smaller-cap space.
The quality anchor Morningstar’s guidance is direct: when considering smaller-cap investments, moat ratings should serve as a key filter, because the elevated risks make quality the difference between value and a trap.
Honesty about the limits matters here. A discount can persist far longer than expected, and mean reversion is not guaranteed on any particular timeline. Nothing above is a market call.
The practical next step is to identify moated smaller-cap businesses trading at a material discount to fair value, then size any exposure in proportion to the higher uncertainty involved. Stock-level research for names like PEXA, Seek, and SiteMinder requires current Morningstar premium coverage. Treat this as a research starting point, not a buy signal, and the discipline that makes the opportunity worthwhile stays intact.
Rigorous small-cap stock research starts with primary source material, the ASX announcement feed, management filings, and milestone delivery records, rather than secondhand commentary, because thinner institutional coverage means promotional noise is proportionally louder at the smaller end of the market.
This article is for informational purposes only and should not be considered financial advice. Investors should conduct their own research and consult with financial professionals before making investment decisions. Past performance does not guarantee future results, and financial projections are subject to market conditions and various risk factors.