#
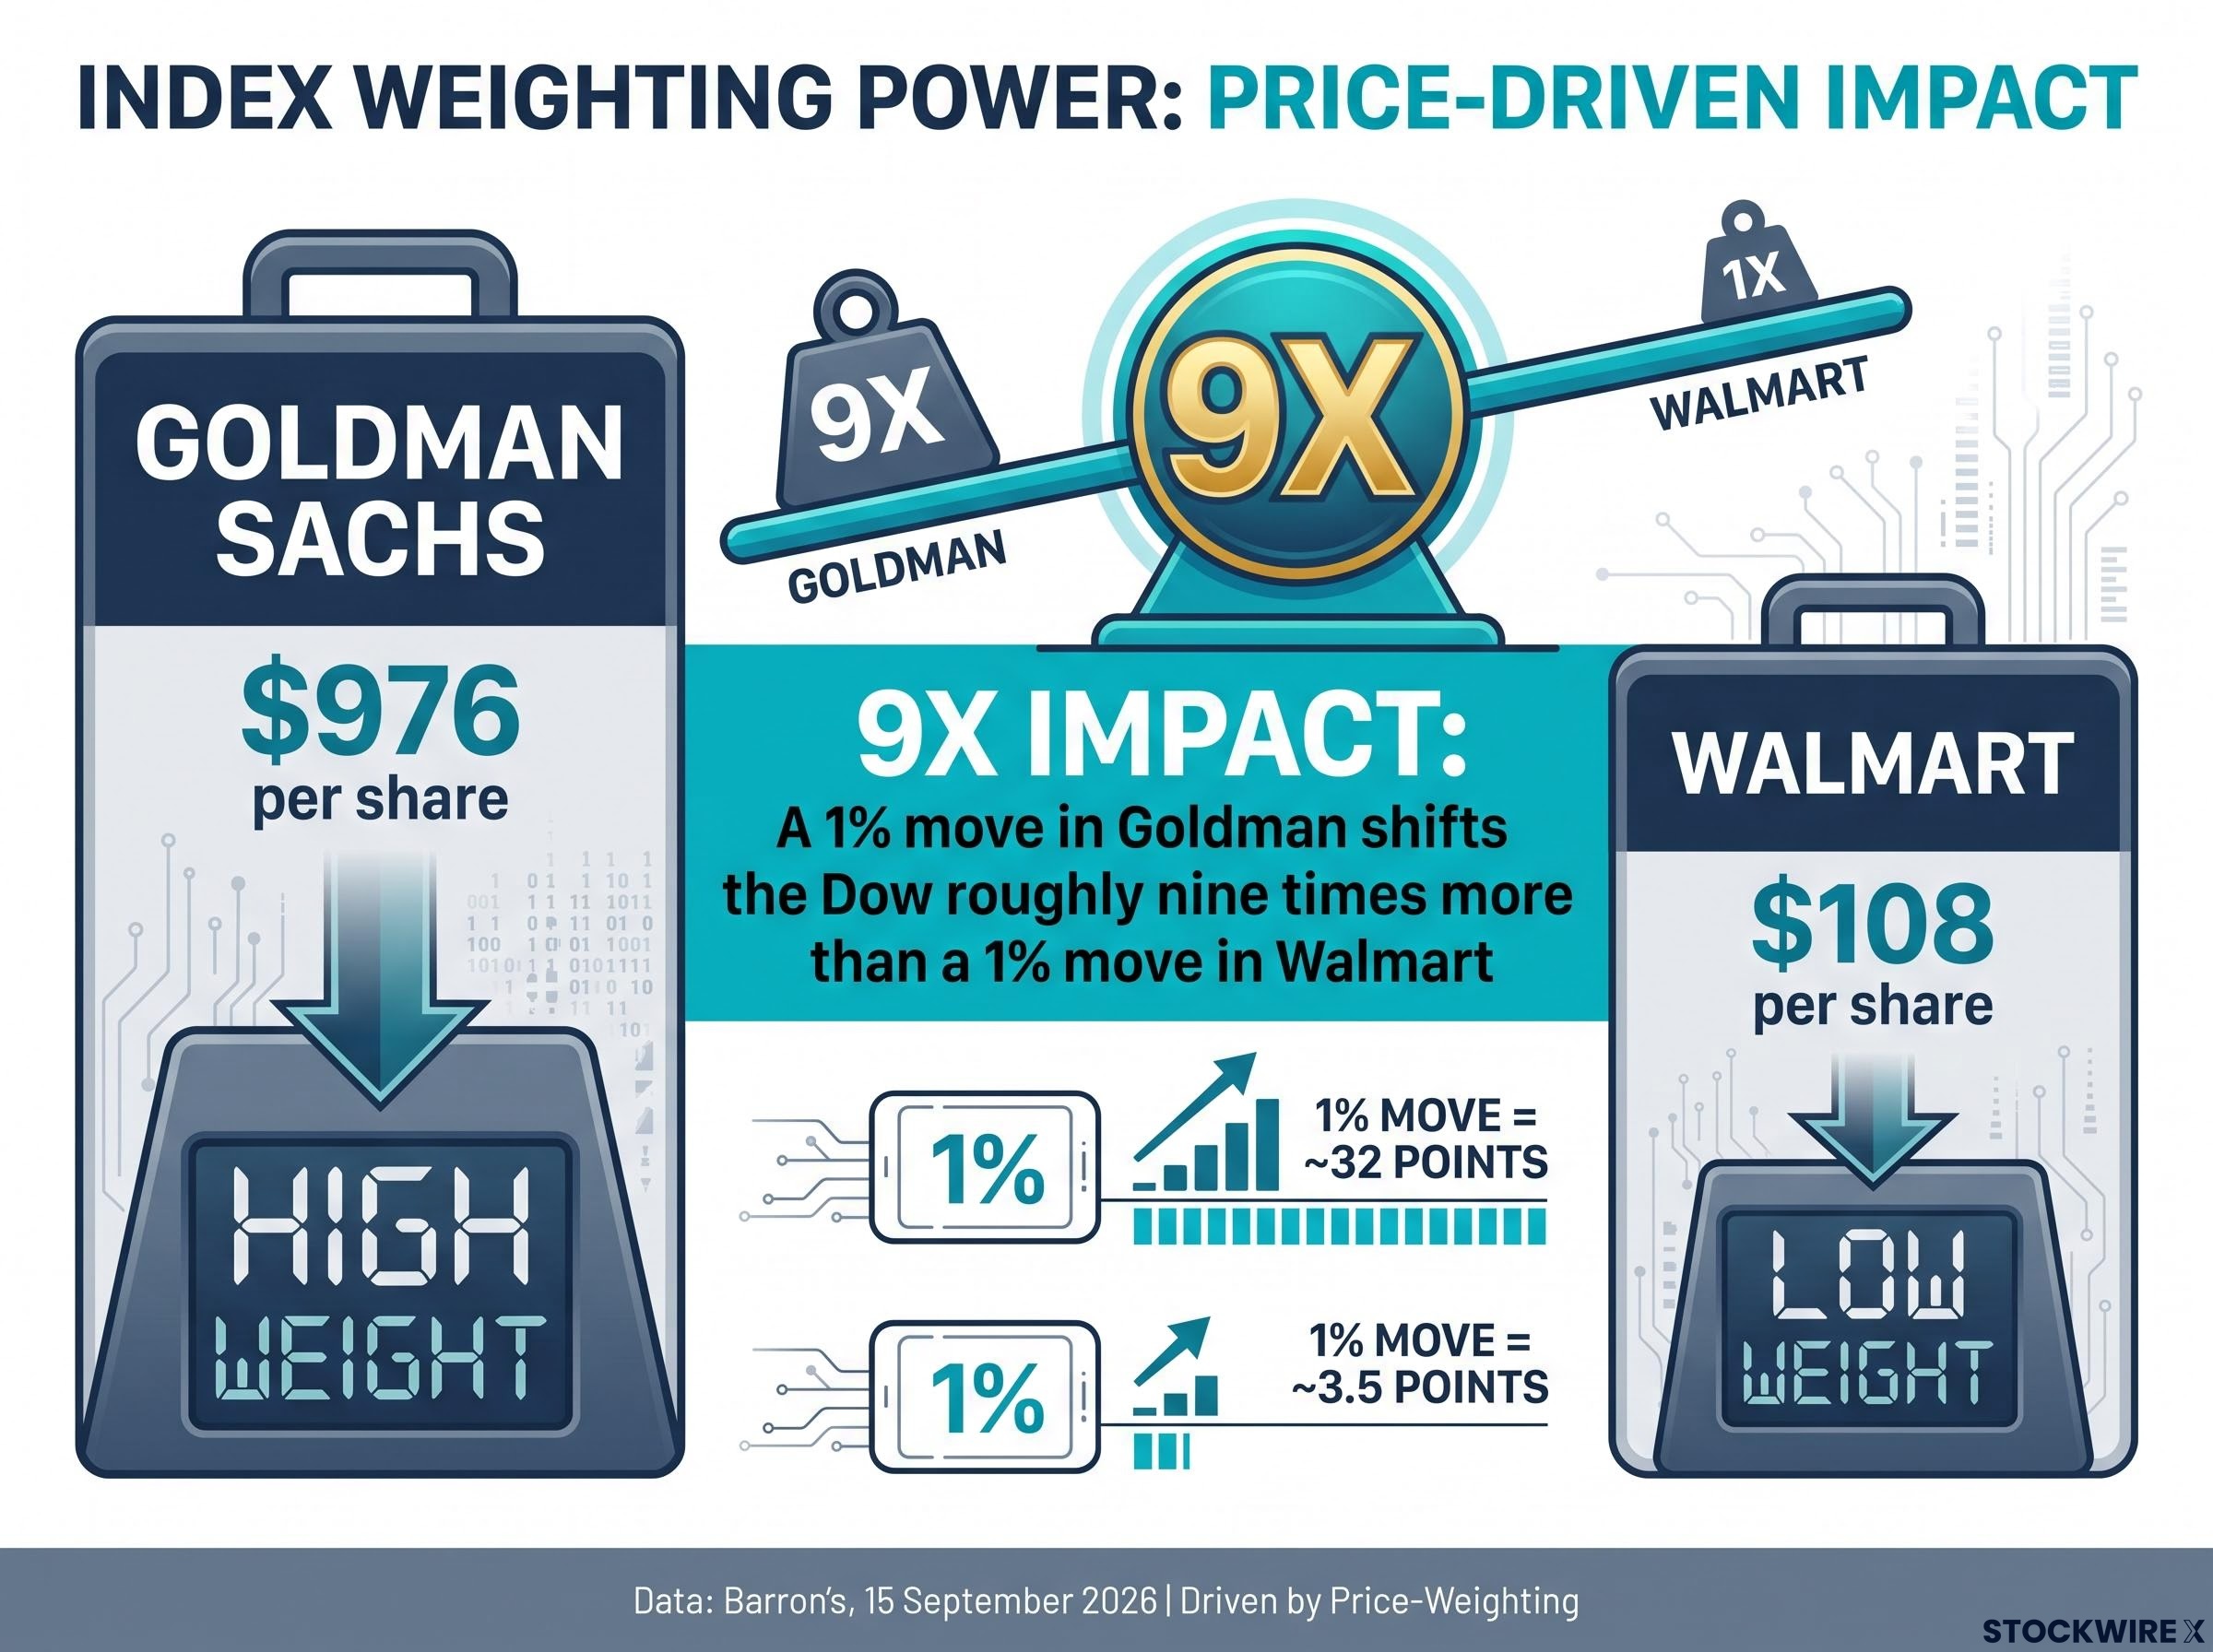
Every trading day, millions of Americans hear the Dow quoted on the evening news as shorthand for how “the market” performed. Almost none of them know that a single stock trading near $976 per share moves that number far more than a trillion-dollar giant trading near $108.
That first stock is Goldman Sachs. The second is Walmart, a company woven into daily American life far more visibly than any investment bank. Yet on any given day, Goldman shifts the index roughly nine times harder.
This gap between how often the Dow is quoted and how little it is understood is a real problem for your money, not an academic curiosity. Treat the Dow Jones Industrial Average (DJIA) as a complete picture of the U.S. market, and you are making portfolio decisions on an incomplete signal. Encounter Dow Theory terminology in financial media without grounding, and you will either dismiss it entirely or apply it far too aggressively.
This guide fixes both. After reading it, you will know exactly how the DJIA is built, why that design creates blind spots, what Dow Theory actually says about market trends, and where to buy DJIA exposure cheaply. Think of it as finally reading the manual for a tool you already touch every single day.
How the Dow is actually built: price-weighting and the divisor explained
Here is the strange part most people never learn: the DJIA does not care how big a company is. It cares how expensive one share is.
The DJIA uses price-weighting, which means each of its 30 constituent stocks influences the index in proportion to its per-share price, not the company’s total market value or economic footprint. A high-priced share pushes the index around more than a low-priced one, full stop.
The distortion in one comparison Goldman Sachs trades near $976 per share. Walmart trades near $108 per share (Barron’s, 15 September 2026). A 1% move in Goldman shifts the Dow roughly nine times more than a 1% move in Walmart, despite Walmart’s far larger presence in the American economy.
Sit with that for a moment. The number the news calls “the market” can be dominated by one high-priced stock having an ordinary session. That is the flaw price-weighting bakes in, and it is why a big Dow headline is never proof that the whole market surged or slumped.
The price-weighting distortion runs deeper than the Goldman-Walmart comparison suggests: Caterpillar’s 9.49% Dow weight gives it more index influence than Honeywell, Boeing, and 3M combined, meaning a single industrial stock’s rally can make an entire sector look healthy even when the underlying factory data says otherwise.
The mechanics behind this fall to a single figure called the divisor. Three effects flow from the design:
- Higher-priced stocks dominate the index’s daily point moves regardless of company size.
- A stock split can instantly slash a company’s weight without changing its business at all.
- The divisor is the adjustment lever that keeps the whole system consistent over time.
What the divisor does, and why it keeps changing
The divisor is the number the DJIA divides by to convert the summed share prices of its 30 components into the index level you see quoted. As of 29 June 2026, that figure is 0.16824816528350 (S&P Dow Jones Indices). If you have seen an older value like 0.152 floating around, it predates the June 2026 adjustment.
At that divisor, every $1 change in any component’s price moves the index by roughly 5.94 points. So a stock trading at $976 has far more room to swing the Dow than one trading at $108, purely by virtue of its price.
The divisor is not fixed. S&P Dow Jones Indices recalculates it after every stock split, special dividend, or component substitution that would otherwise cause a discontinuous jump in the index. The most recent reset came with Alphabet (GOOGL) replacing Verizon (VZ) on 29 June 2026, alongside a Honeywell restructuring. This continuity mechanism is precisely why the DJIA can trace a consistent price series back to 1896, even though its membership has changed beyond recognition.
When big ASX news breaks, our subscribers know first
What the Dow’s 30 stocks actually cover, and where the gaps are
Give the Dow its due first. Its 30 members are among the most recognised blue-chip companies in the world, spanning industries that touch nearly every part of the U.S. economy.
You will find financials (Goldman Sachs, JPMorgan Chase, American Express, Visa), healthcare (Johnson & Johnson, Merck, Amgen), technology (Apple, Cisco, IBM, NVIDIA, Alphabet), consumer staples (Walmart, Coca-Cola, Procter & Gamble), energy (Chevron), and heavyweight industrials (Caterpillar, Boeing, Honeywell, 3M). The full authoritative list is maintained by S&P Dow Jones Indices, and it is worth verifying there.
The index does evolve. Alphabet’s addition on 29 June 2026 shows it adapts to shifts in the economy. But change comes slowly and infrequently, far more slowly than the market structure it is meant to reflect.
Now the gaps, and they are structural. Thirty stocks is a tiny slice of the U.S. equity universe. Compare that scope to the broader benchmarks:
| Index | Components | Weighting method | What it covers |
|---|---|---|---|
| DJIA | 30 | Price-weighted | Large-cap blue chips; industrial, financial, consumer tilt |
| S&P 500 | 500 | Market-cap weighted | Large-cap breadth across all major sectors |
| Russell 2000 | 2,000 | Market-cap weighted | Small-cap companies across the U.S. market |
The DJIA omits the entire small- and mid-cap universe and thousands of large companies too. Its price-weighting and selective membership have historically tilted it toward industrial, financial, and consumer names, which can leave it underrepresenting fast-growing technology innovators and biotech firms during the very periods those sectors lead.
For you, building a diversified U.S. equity portfolio, that matters directly. Using the Dow as your standalone benchmark leaves blind spots around small-cap, mid-cap, and high-growth technology exposure, segments that can behave completely differently from the 30 blue chips in any given market. Knowing what the Dow actually measures is the first step to choosing the right yardstick for what you actually hold.
Dow Theory explained: the three-phase framework for reading market trends
Charles Dow, the same man who founded both the DJIA and the Wall Street Journal, built a framework for identifying genuine market trends. Its central rule is deceptively simple: before you trust a trend, two averages must agree.
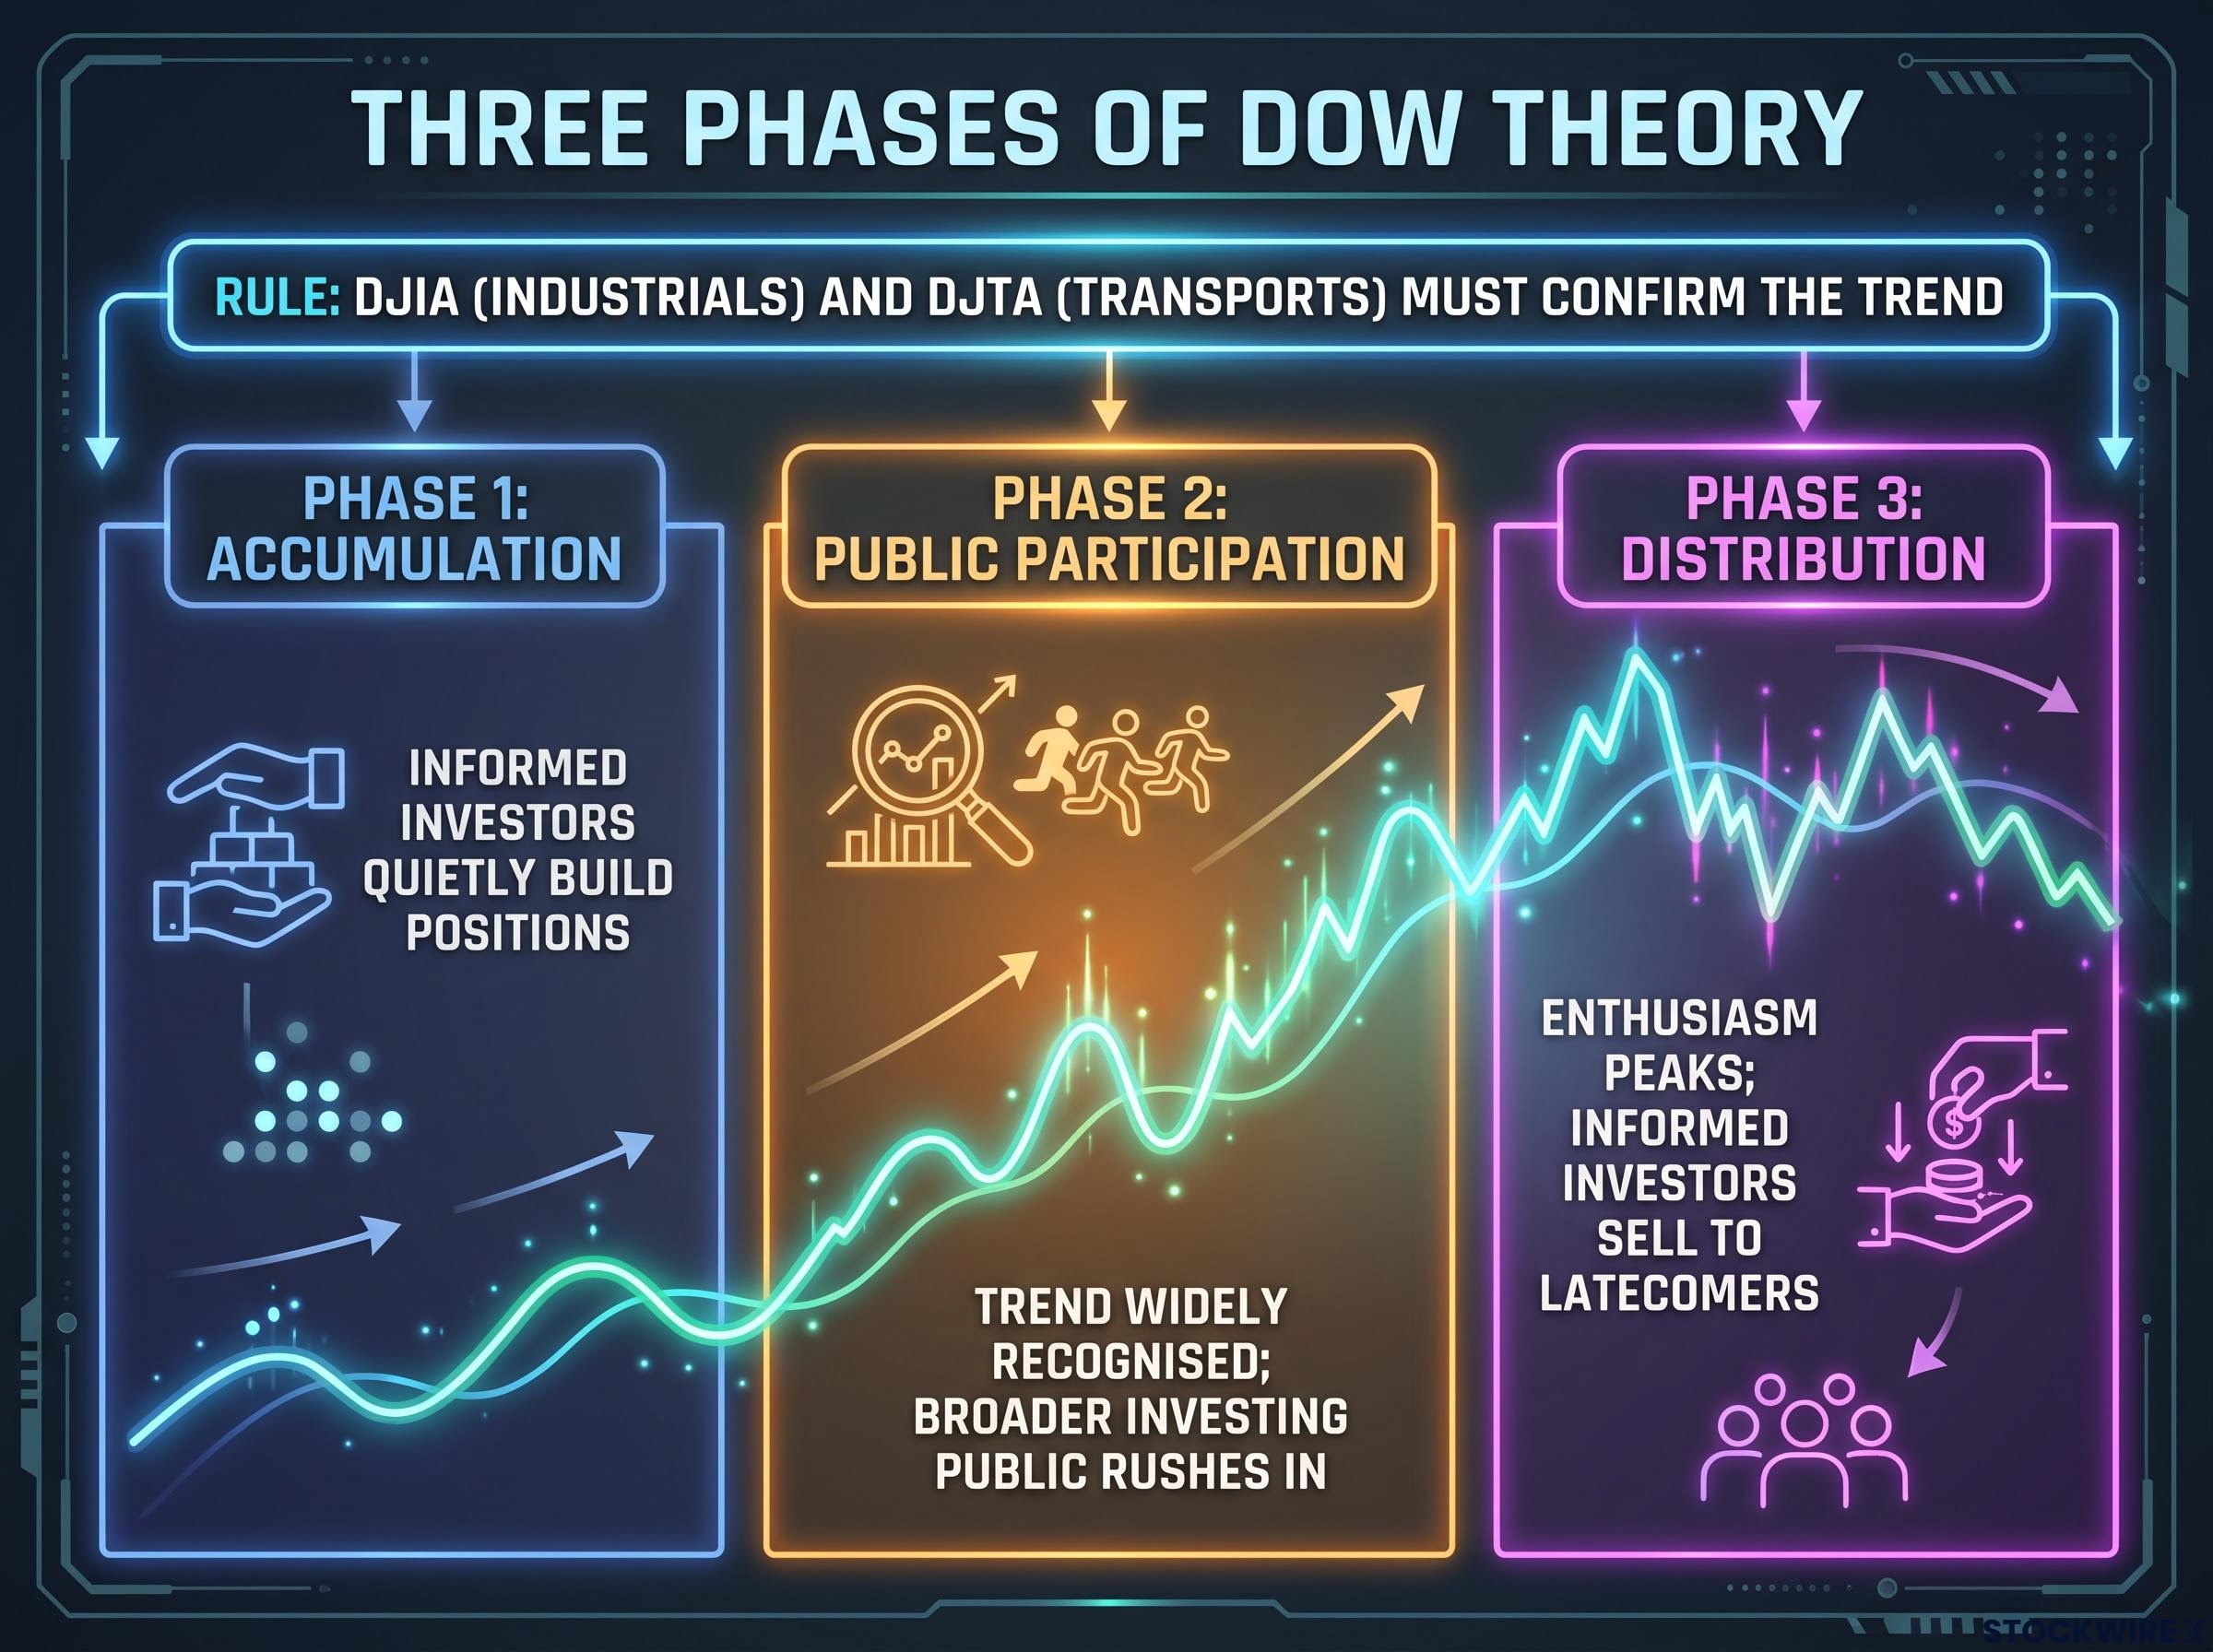
Dow Theory requires confirmation between the DJIA (industrials) and the Dow Jones Transportation Average (DJTA, the transport stocks) before treating a market move as a valid primary trend.
The core logic in one line If the DJIA makes new highs but the transports do not confirm the move, Dow Theory treats the divergence as a warning rather than a trend, because the movement of goods must follow the production of goods for an expansion to be real.
Beneath that confirmation rule sits a human story about how trends actually unfold, told in three phases:
- Accumulation. Informed investors quietly build positions before the news is public. Prices drift with little fanfare, and the smart money is buying while the crowd is still looking away.
- Public participation. The trend becomes widely recognised, and the broader investing public rushes in. This is usually the longest phase, and it is where most of the crowd finally notices what is happening.
- Distribution. Enthusiasm peaks, valuations stretch, and the informed investors who bought early begin quietly selling to the latecomers still piling in.
Volume is the confirmatory tool that ties the phases together. Trading volume should expand in the direction of the primary trend and contract on counter-trend corrections. Volume moving against the price trend is read as a warning that conviction is weakening.
Volume confirmation becomes more interpretively complex in 2026 than in Charles Dow’s original framework: algorithmic trading and derivatives activity mean a surge in reported volume no longer carries the same directional conviction it once did, requiring analysts to weigh the source of volume alongside its raw size.
Dow Theory also separates primary trends from secondary reactions, the sharp counter-trend corrections that can rattle nerves without actually reversing the main direction. That distinction is what keeps a disciplined reader from mistaking a pullback for a reversal.
So when financial media reports that “the Dow hit a new high,” Dow Theory hands you a follow-up question: did the transports confirm it? A new high in industrials alone is not a validated signal of a genuine bull trend, and knowing to ask that question puts you ahead of most of the coverage.
Classic Dow Theory signals in real market history
The theory earns its reputation from three episodes analysts still cite.
In 1929, the DJIA pushed to new highs that the transports failed to consistently confirm, followed by both averages breaking key support. William Peter Hamilton and later Robert Rhea documented this non-confirmation as an early warning of the bear market that culminated in the October crash.
In 1932, the pattern flipped. Rhea recorded a Dow Theory buy signal when both averages formed higher lows and then jointly broke above prior rally peaks, with volume confirming. It marked the start of a primary bull market.
After the 2008 crisis, Jack Schannep and other modern Dow theorists highlighted the March 2009 bottom, where initial lows were later confirmed by both industrials and transports moving above prior reaction highs, generating a buy signal that coincided with the long bull run that followed.
In every case the signal lagged the exact turning point. That is the design, not a defect: Dow Theory aims to capture the bulk of a major trend, not the precise top or bottom. The early-2000s technology bust and the 2015-2016 industrial slowdown offered more recent non-confirmation episodes, each warning of durability problems before both averages finally resolved in the same direction.
How to access the DJIA, and where Dow Theory fits in a modern portfolio approach
Enough theory. Here is how you actually buy the Dow, and what it costs you.
The primary vehicle is the SPDR Dow Jones Industrial Average ETF Trust (ticker DIA), managed by State Street Global Advisors. It carries a 0.16% expense ratio (State Street Global Advisors, September 2026) and holds roughly $46.96 billion in assets under management (MarketBeat, 20 September 2026). That makes it a low-cost, liquid, and genuinely accessible way to own the 30 Dow stocks in one trade.
The primary vehicle is the SPDR Dow Jones Industrial Average ETF Trust (ticker DIA), managed by State Street Global Advisors, and State Street’s official DIA fund page confirms the 0.16% expense ratio and current assets under management, giving you a single authoritative reference point before you trade.
More sophisticated tools exist. The table below lays out the main routes to DJIA exposure:
| Vehicle | Key feature | Who it suits | Primary risk |
|---|---|---|---|
| DIA ETF | Low cost (0.16%), highly liquid, one-trade access | Most retail investors seeking direct exposure | Narrow, price-weighted scope |
| DJIA futures | Leveraged exposure for hedging or speculation | Experienced traders with margin accounts | Leverage magnifies losses; margin calls |
| DJIA options | Defined-cost directional or hedging bets | Advanced investors comfortable with options | Time decay; total premium loss |
Futures and options require margin accounts and carry additional risk, so for most people, DIA is the sensible entry point rather than derivatives.
ETF overlap is a subtler risk than most investors realise: a portfolio that holds DIA alongside several broader equity ETFs can end up paying multiple expense ratios for near-identical baskets, with the unique stock count often 30-40% lower than the headline number of holdings suggests.
Now the honest assessment of Dow Theory. Its conceptual value is real: trend phases, confirmation between averages, and volume analysis give you a disciplined language for reading market structure. But two practical limitations matter enormously:
- Signal lag. Classic buy and sell signals only appear after both averages confirm by breaking prior highs or lows, which means you typically act well after a substantial portion of the move has already happened.
- Binary overconfidence. Treating a confirmation as an all-in or all-out trigger encourages market timing, which the SEC, FINRA, and academic research consistently identify as a leading destroyer of retail investor returns.
The practical takeaway is straightforward. For most investors, Dow Theory works best as an interpretive lens for understanding market commentary and broad cycle positioning, not as a standalone timing system. And on cost, the 0.16% expense ratio means price is no reason to avoid DIA, but the Dow’s narrow, price-weighted design means DIA should almost never be your portfolio’s primary equity holding. It complements broader market exposure; it does not substitute for it.
This article is for informational purposes only and should not be considered financial advice. Investors should conduct their own research and consult with financial professionals before making investment decisions. Past performance does not guarantee future results.
What the DJIA can tell you, and what you should not ask it to
Pull the four threads together and a clear picture emerges. The DJIA is one of the most durable financial instruments in history, but its price-weighting, 30-stock scope, and the built-in lag of Dow Theory signals make it a directional indicator, not a complete map of U.S. equity market health.
Knowing how the Dow works does not diminish its usefulness. It calibrates it. Once you understand price-weighting, component scope, and trend-phase analysis, you can read media coverage more sharply, benchmark your portfolio against something that actually reflects your holdings, and weigh market commentary with the right amount of scepticism.
Here is what to do with all of this:
- Check the current Dow component list and divisor at S&P Dow Jones Indices, the authoritative source, before relying on either.
- Decide whether DIA fits a specific complementary role in your portfolio, sitting alongside broader S&P 500 or total-market exposure rather than replacing it.
- Use Dow Theory’s three phases as a conceptual frame when reading about bull and bear markets, not as a trigger to trade.
- Anchor your long-term performance benchmarking to the S&P 500 or a total-market index that captures the real breadth of U.S. equities.
For readers who have decided the S&P 500 or a total-market index is the right primary benchmark and want a step-by-step path to getting started, our dedicated guide to investing in index funds covers brokerage account setup, dollar-cost averaging schedules, and the three behavioural mistakes that most commonly derail first-time investors.
Treat the Dow as a daily directional pulse on large-cap blue-chip sentiment, and it serves you well. Ask it to represent the whole market, and it will mislead you. It is one instrument in a larger orchestra, and knowing its exact pitch and range makes you a better listener, not a different one.