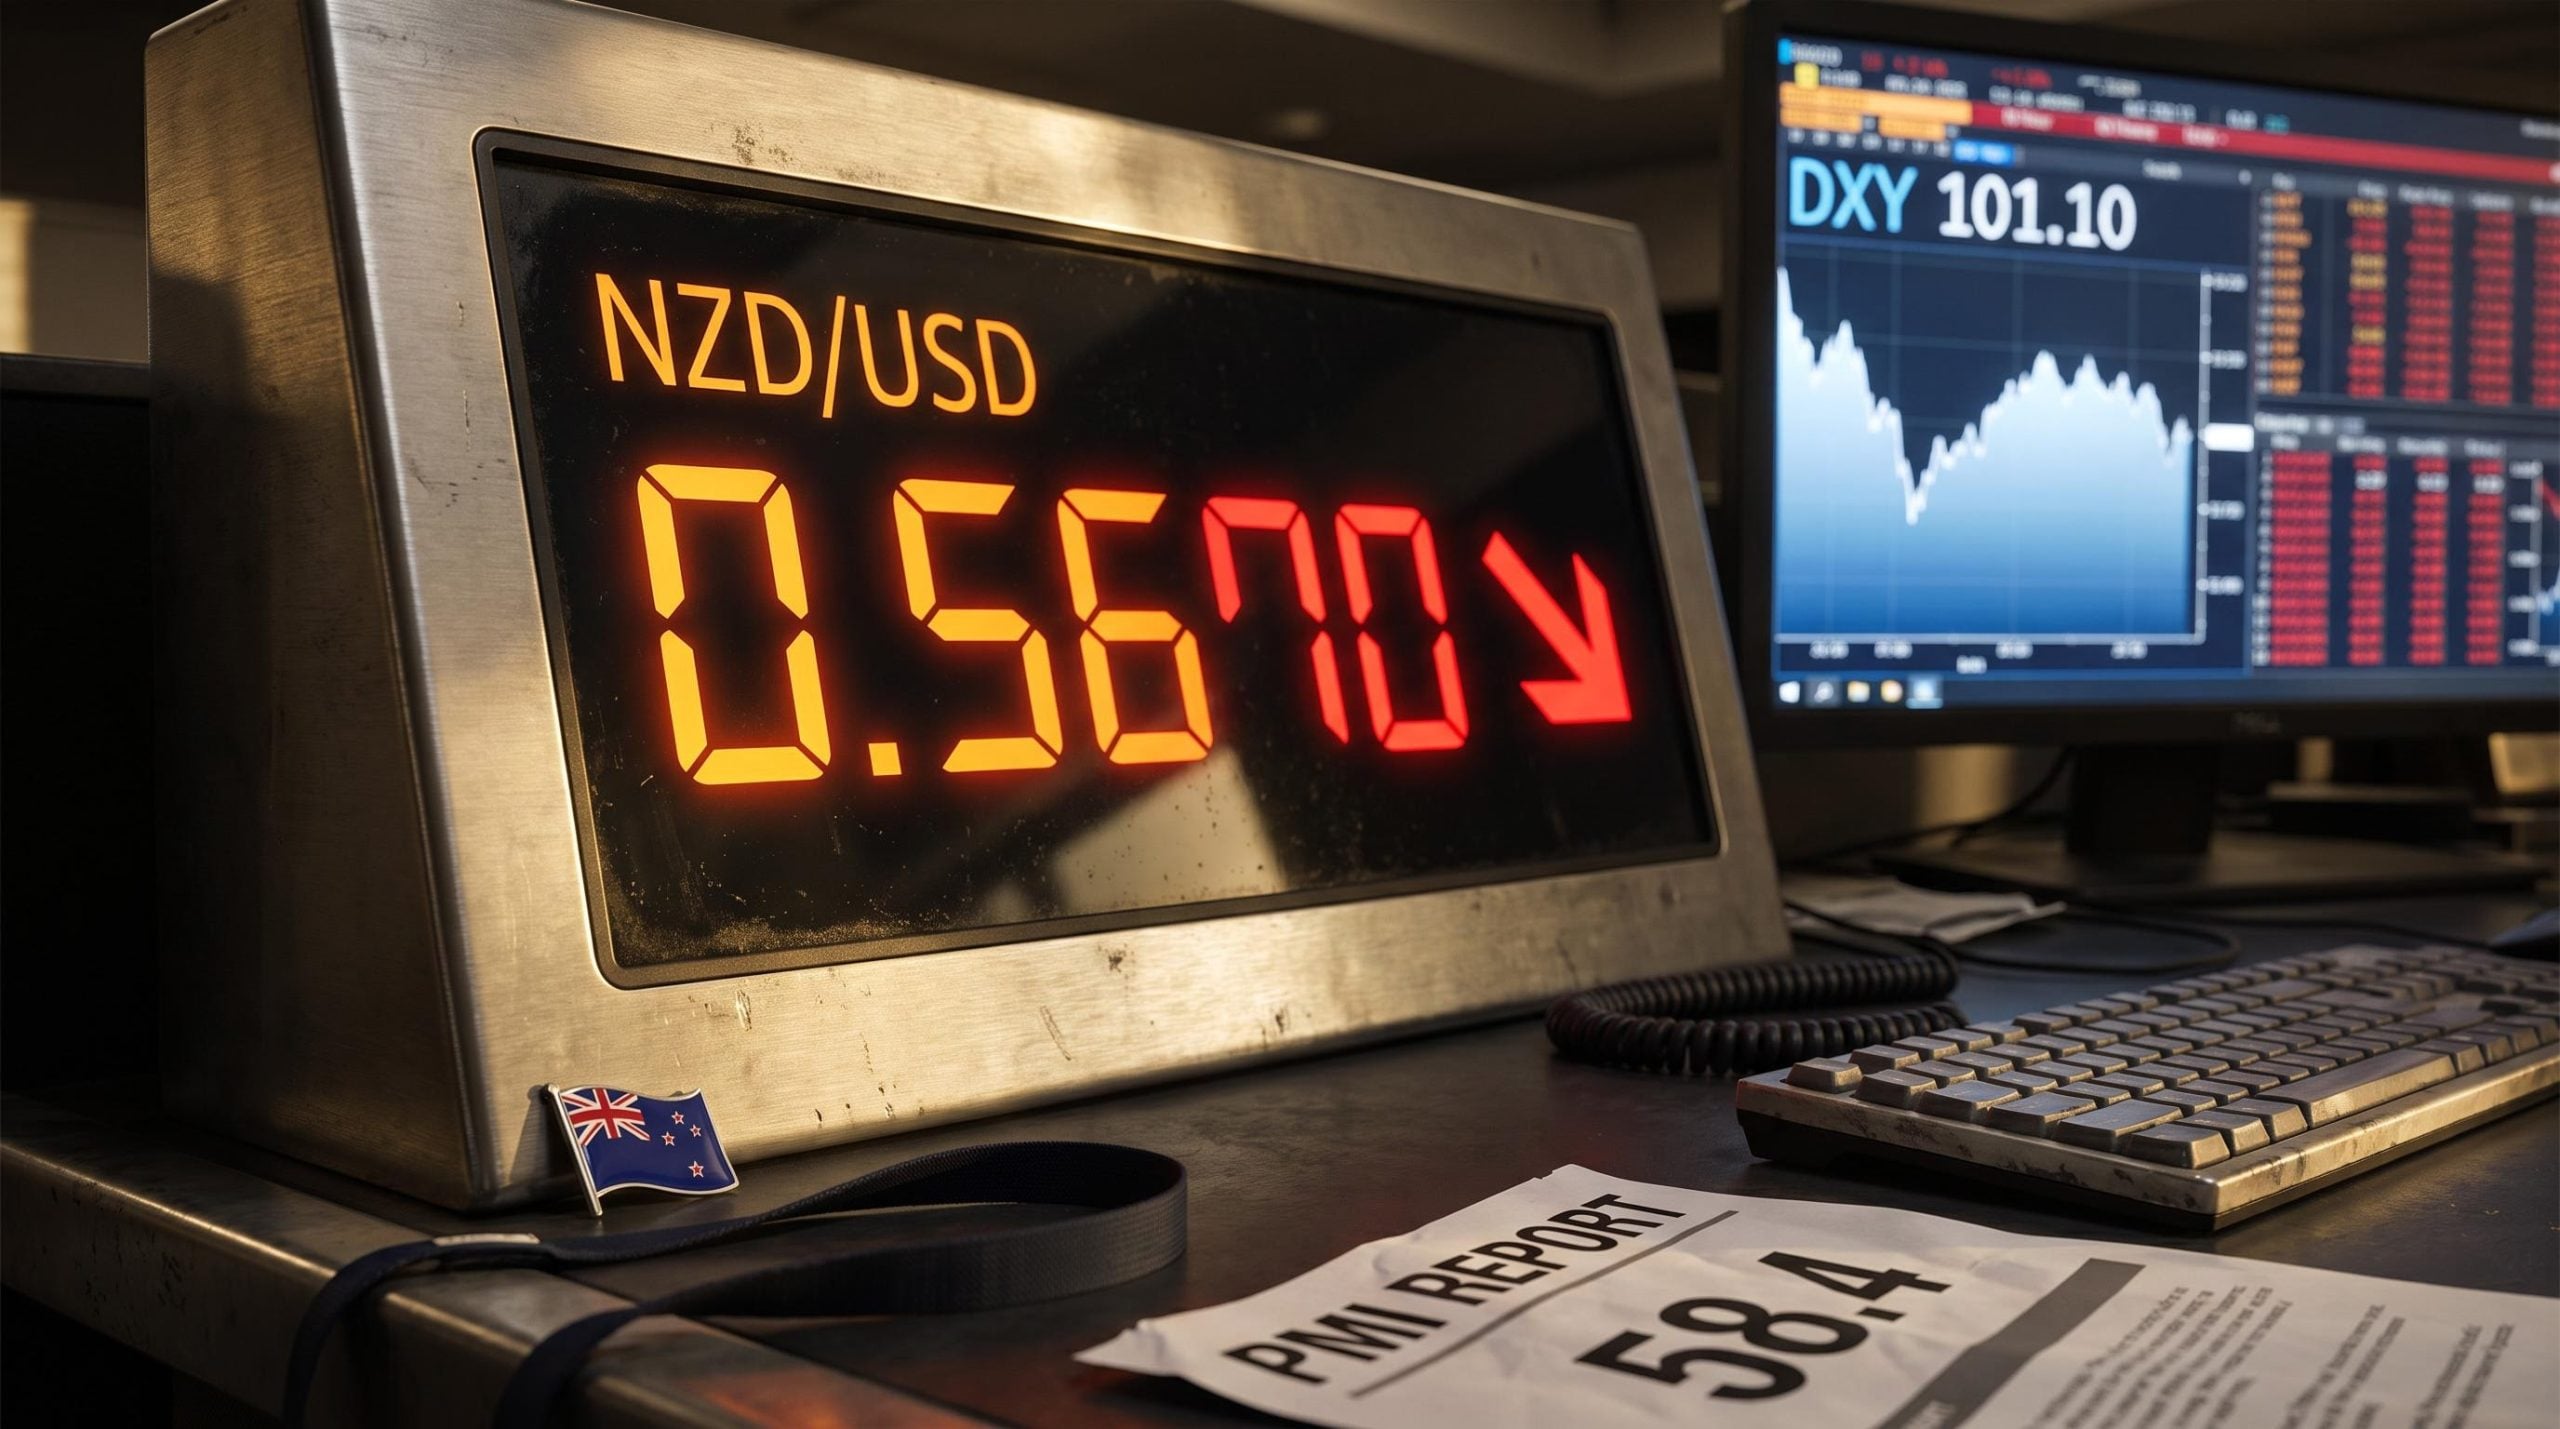
September’s flash US composite PMI printed at 58.4 when markets had been positioned for something closer to 56. Within hours, the New Zealand dollar had shed roughly 1% against the greenback. One data release, one currency pair, one clean sequence.
That sequence is a live demonstration of how a single macroeconomic surprise travels through markets. US business activity landed hot, rate-hike bets repriced, Treasury yields climbed, and the dollar strengthened at the expense of risk-sensitive currencies. NZD/USD is the focal case here because it captures that transmission chain more cleanly than almost any other pair.
By the end of this analysis, you will understand not just what happened on 23 September 2026 but why this particular data type moves currencies the way it does, which ones are most exposed, and how long these moves tend to last. Treat it as a reusable lens for reading the next flash PMI, not a recap of a single session.
September’s PMI numbers and what made them a genuine shock
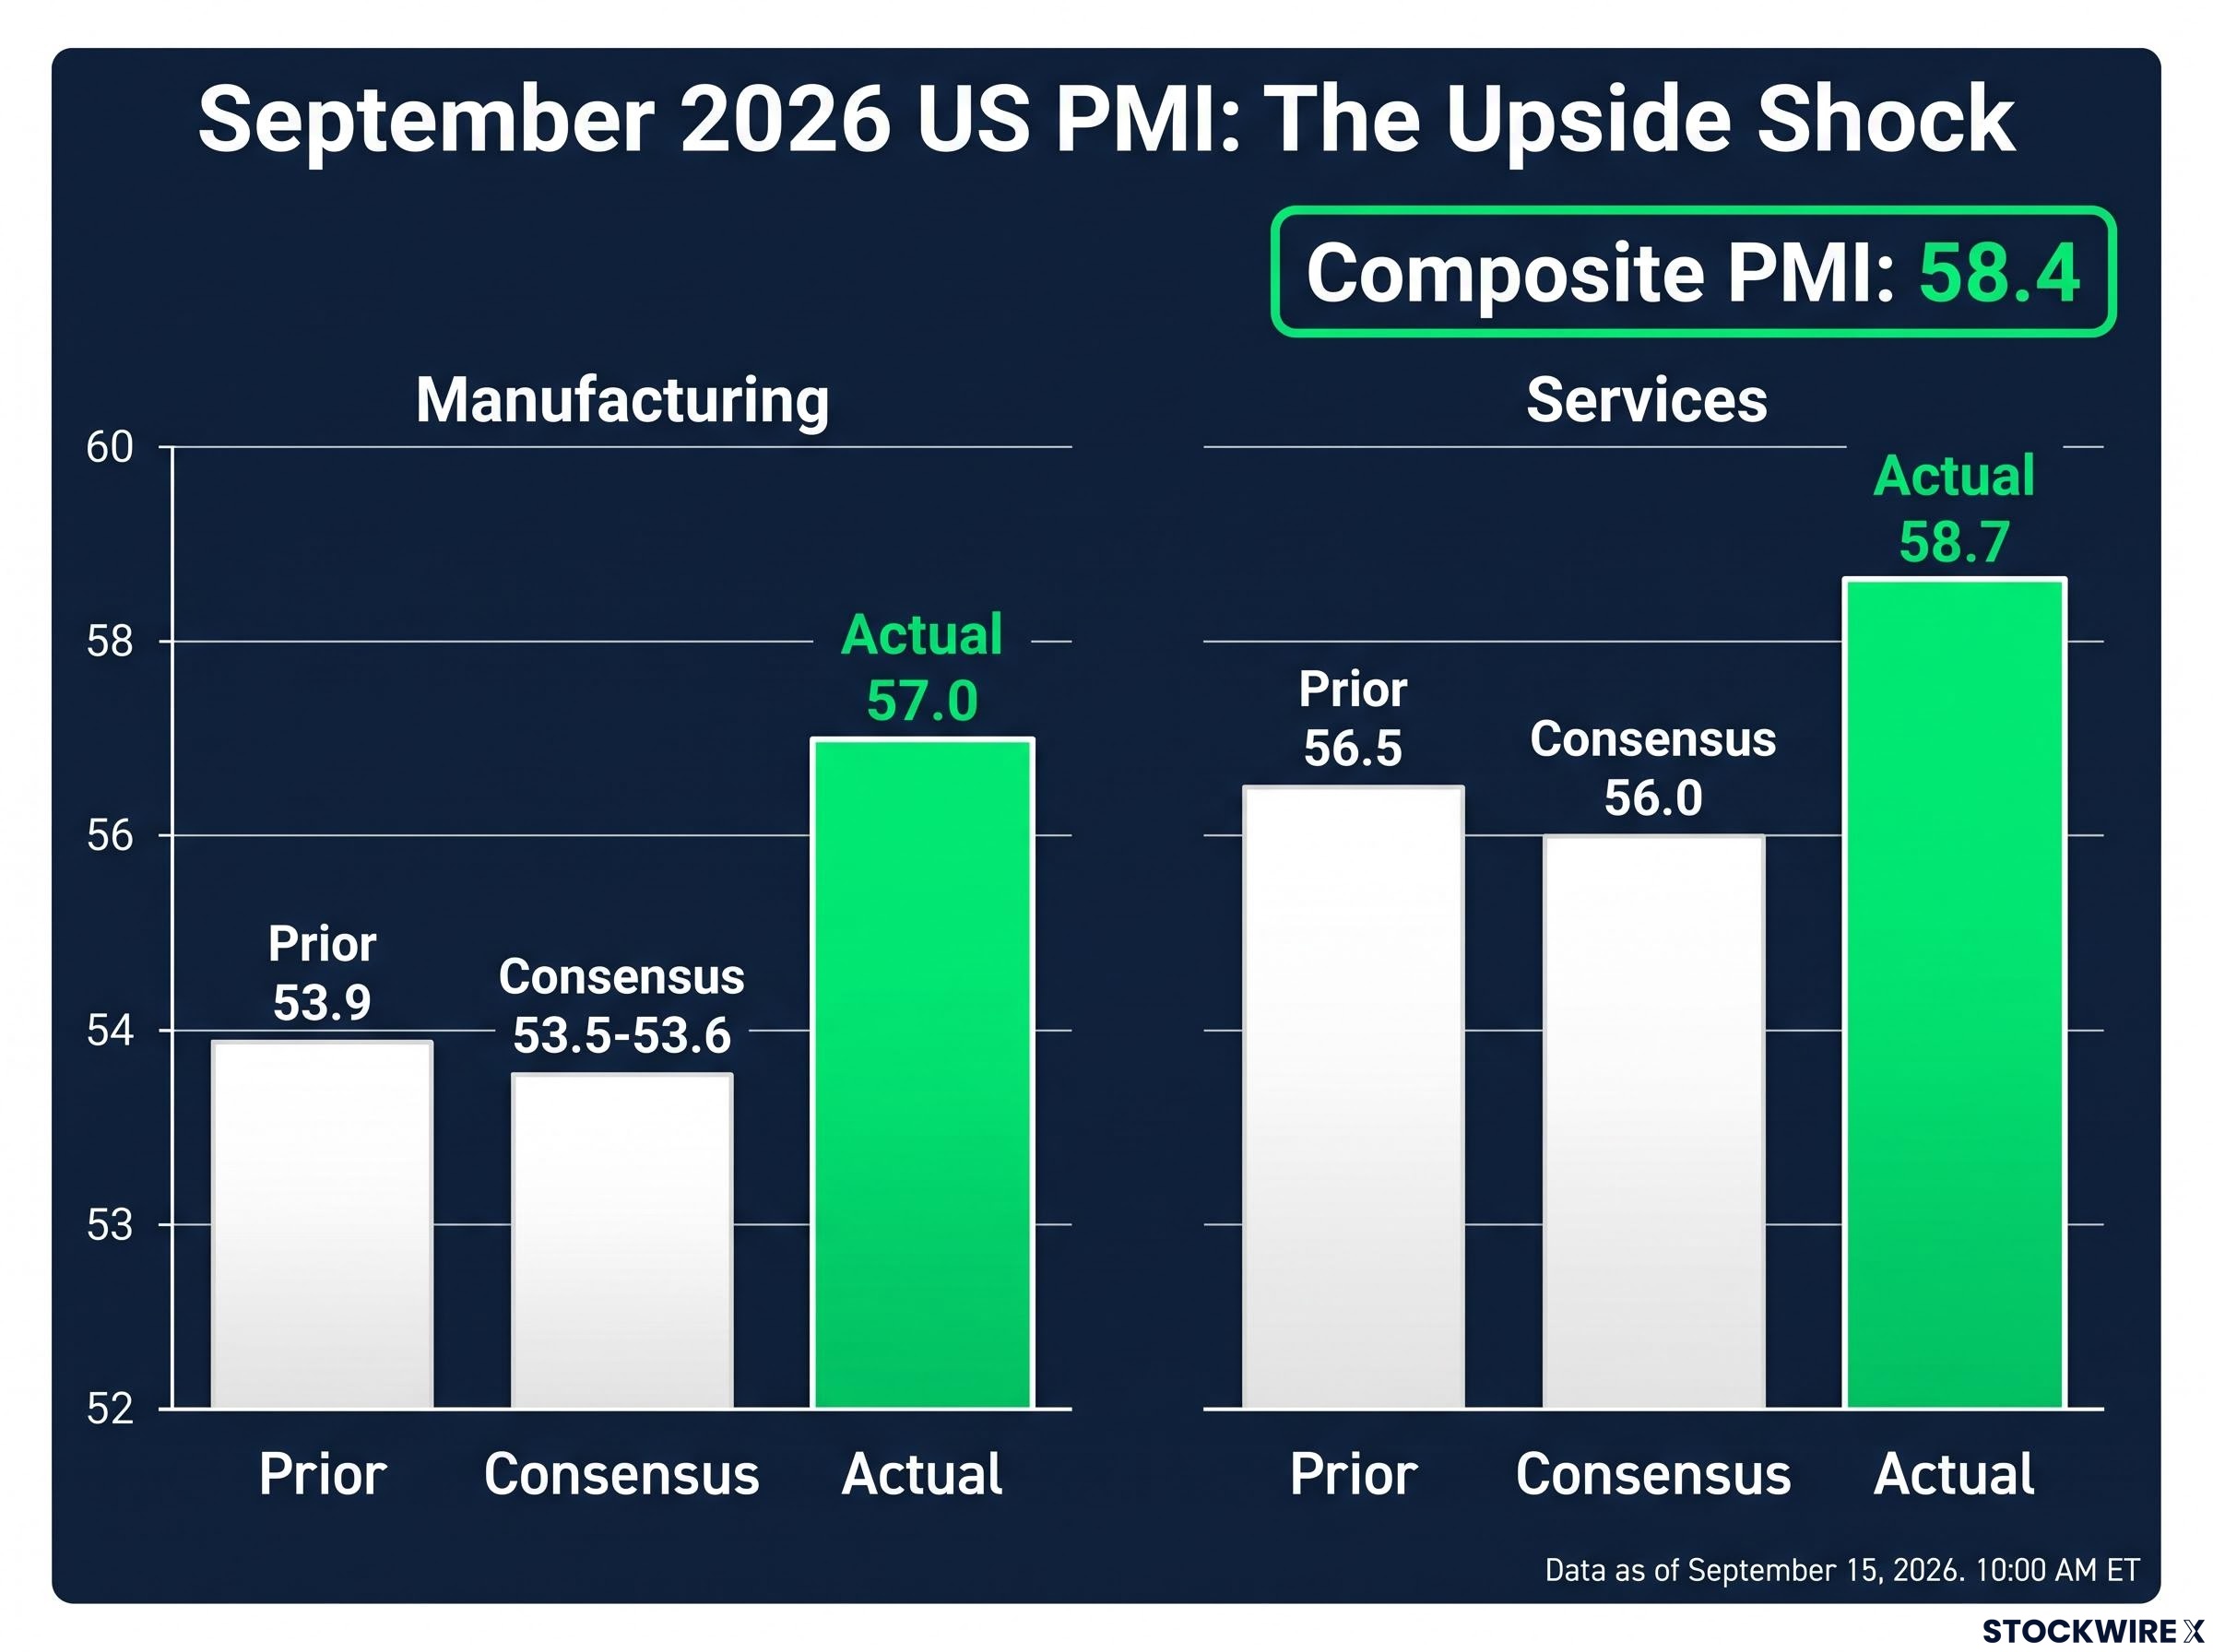
Start with the composite. The flash S&P Global US Composite PMI Output Index came in at 58.4 for September, up from 56.0 in August. That is the strongest reading on private-sector activity since July 2021 and the fourth consecutive month of accelerating growth.
The services component reached 58.7, up from 56.5 and ahead of the 56.0 consensus. Solid, but not the number that jolted markets.
The manufacturing print did that. At 57.0, up sharply from 53.9, it blew past a consensus forecast of 53.5-53.6. This is a sector that had shown signs of softening earlier in the year, and it did not just recover, it accelerated.
| Indicator | Prior | Consensus | Actual |
|---|---|---|---|
| Manufacturing PMI | 53.9 | 53.5-53.6 | 57.0 |
| Services PMI | 56.5 | 56.0 | 58.7 |
| Composite PMI | 56.0 | Not uniformly published | 58.4 |
The scale of the manufacturing beat is the part that matters most for the read. A miss of half a point gets ignored. A miss of more than three points, in the sector markets had been watching for weakness, tells you this was broad-based acceleration rather than a services-sector quirk. That breadth is precisely what gives the Federal Reserve cover to stay hawkish.
Chris Williamson, Chief Business Economist at S&P Global Market Intelligence, characterised US business activity as expanding at its fastest pace in more than five years, with both services and manufacturing driving the upturn.
Why the inflation detail changed the market read
Growth alone is not automatically hawkish. Strong output with soft prices can actually give the Fed room to ease.
What flipped the read here was the pairing. S&P Global’s commentary flagged that inflation pressures were building alongside the activity surge, with strong demand and sharply rising employment.
That combination, fast growth plus firming prices, is what markets priced as a green light for continued tightening. Strong-and-hot is a very different signal to strong-and-cooling, and this print was firmly in the former camp.
When big ASX news breaks, our subscribers know first
How PMI data feeds into the dollar, from survey to spot price
If the survey is a snapshot of business sentiment, how does it end up moving a currency pair? The chain is more direct than it looks, and once you see it, the dollar’s reaction feels almost mechanical.
Here is the sequence:
- A stronger PMI signals faster economic growth
- Faster growth raises the odds the Fed keeps hiking
- Higher rate expectations push Treasury yields up
- Higher yields attract capital into dollar-denominated assets
- Those inflows bid up the US Dollar Index (DXY)
Wednesday’s session traced that path in real time. The DXY advanced 0.54% to trade near 101.10, a fresh two-month high. The 10-year US Treasury yield pushed back above 5%, hovering near 5.06% after the release.
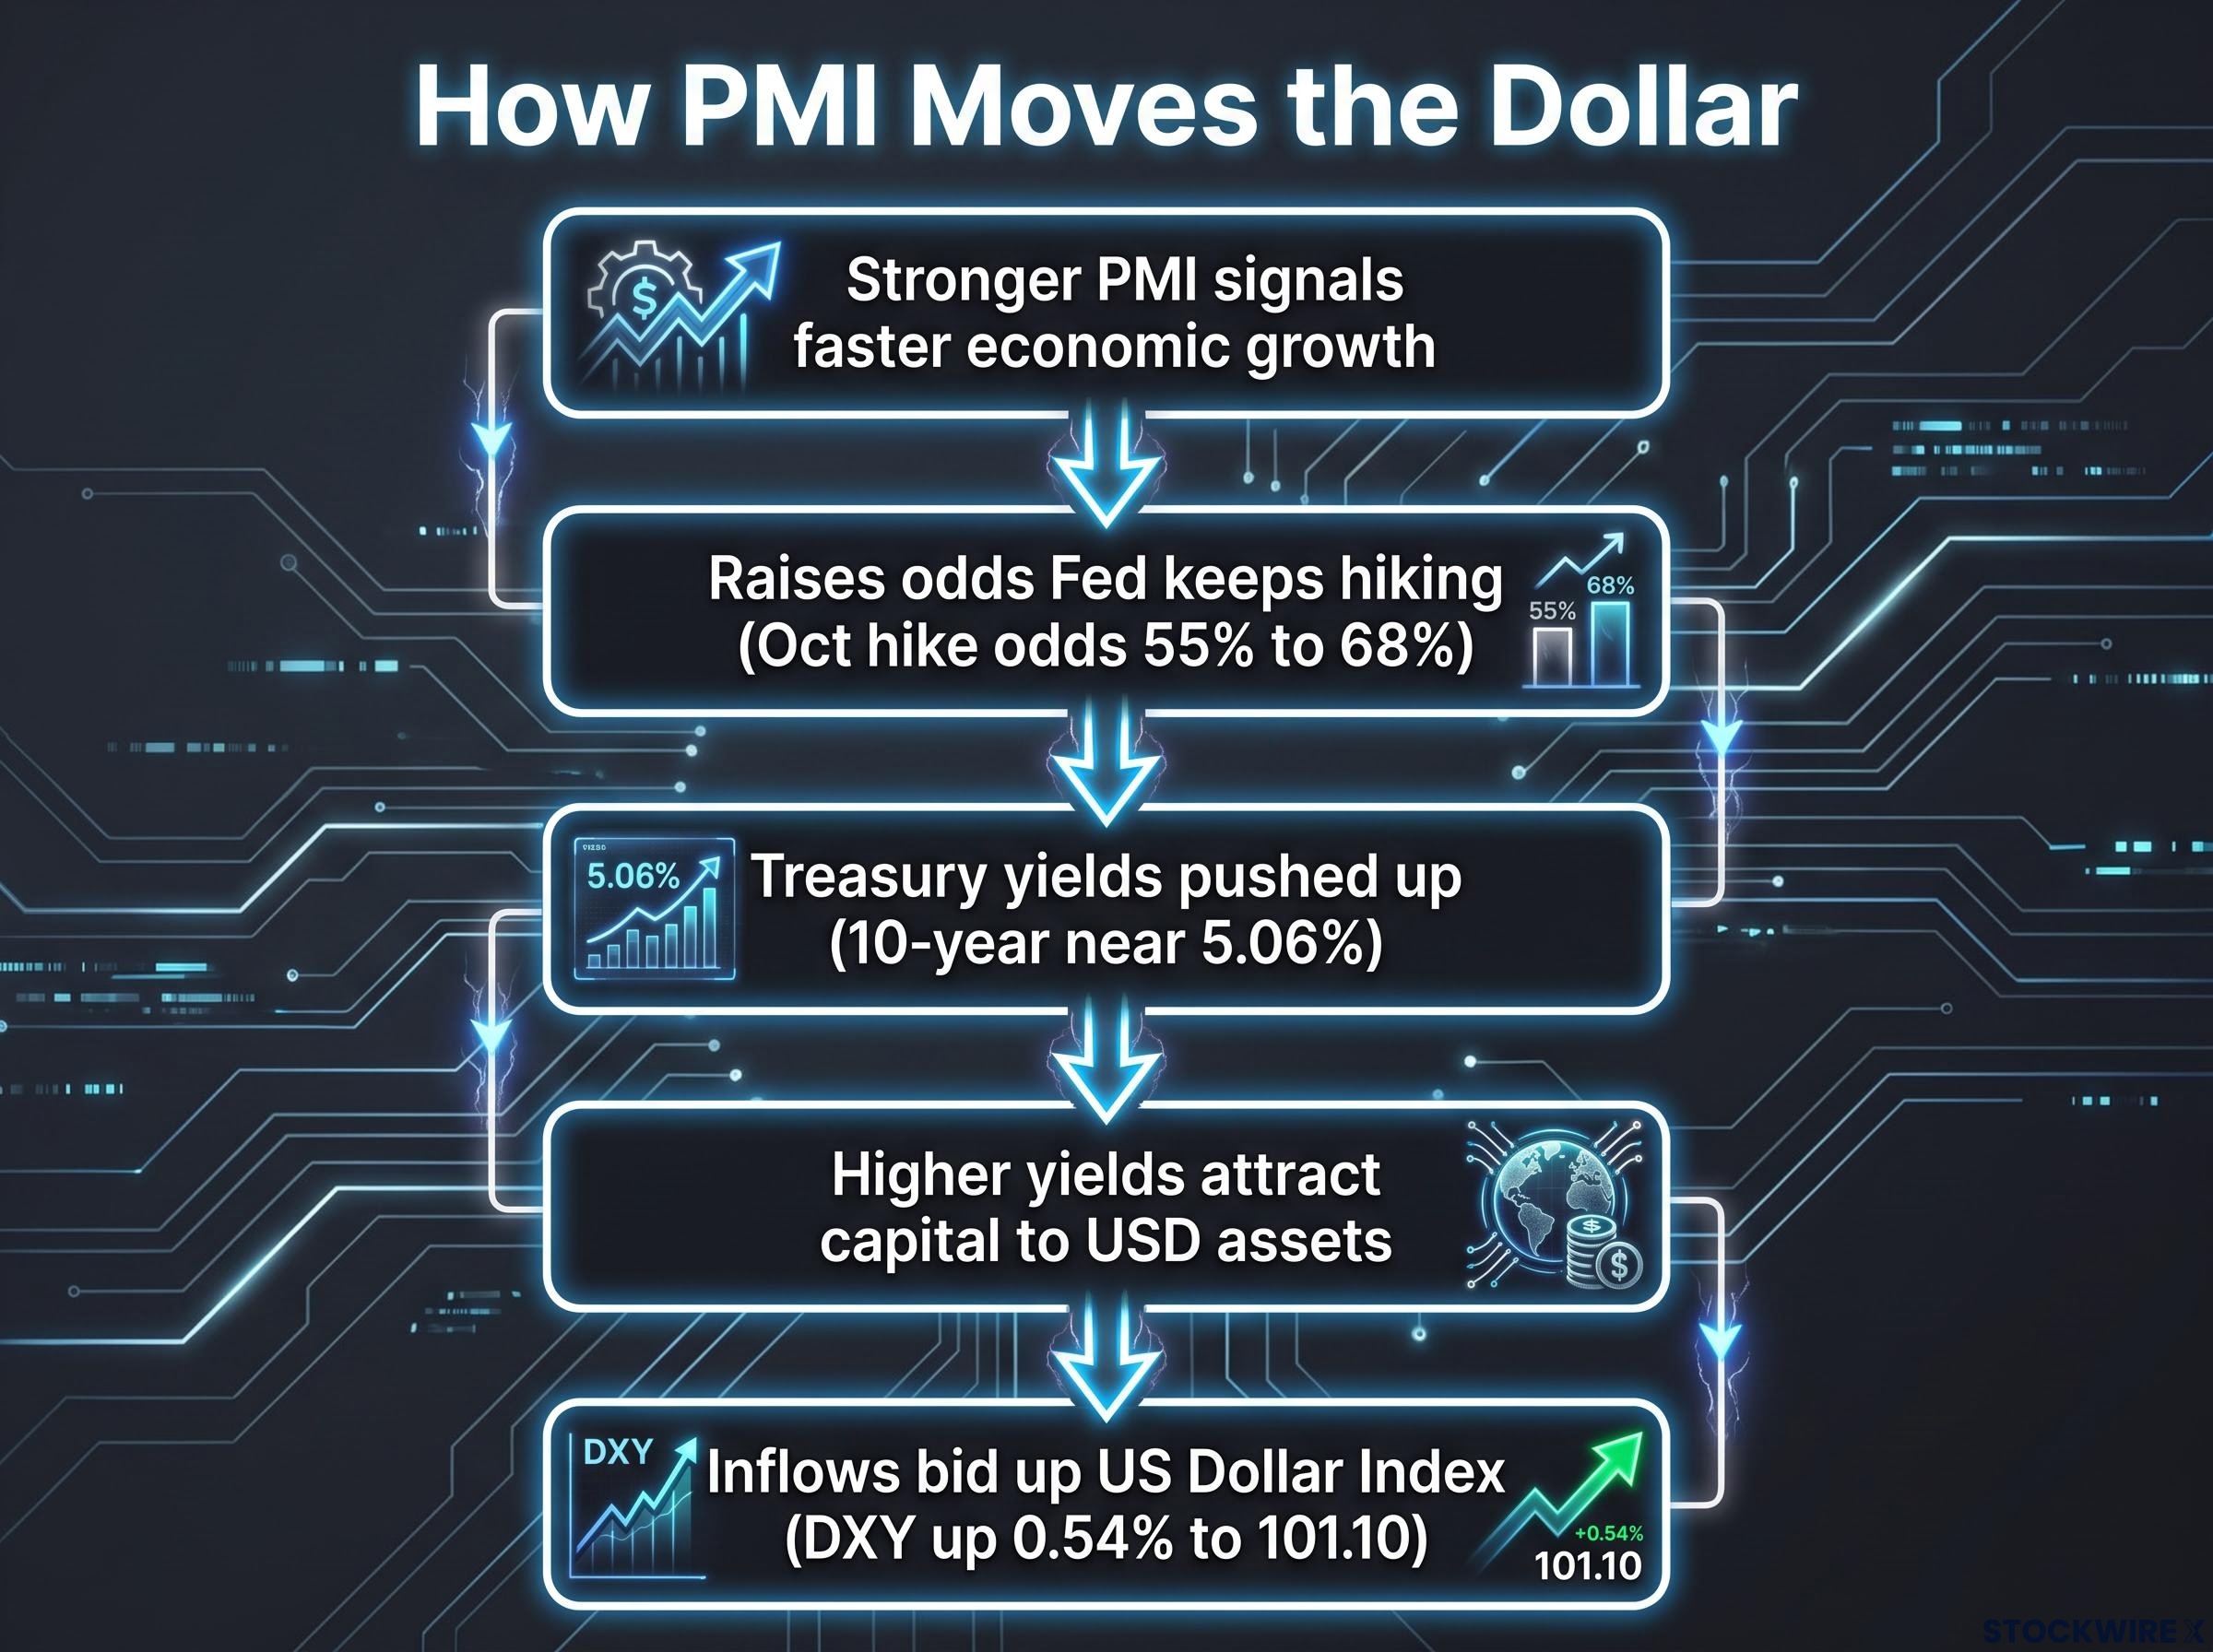
The clearest evidence of repricing came from the options market. According to the CME FedWatch tool, the implied probability of an October rate hike jumped to roughly 68%, up from around 55% the previous day.
A single-session move in October hike odds from 55% to 68% is not a marginal adjustment. It tells you how seriously rate-sensitive markets took this print, repricing more than a coin-flip’s worth of conviction on the back of one survey.
Context matters for reading that shift. The Fed had already raised its benchmark 25 basis points the prior week, setting a target range of 3.75% to 4.00%, and its own projections pointed to at least one further increase within the year. The PMI simply hardened a bias that was already in place.
One caveat on what the survey actually measures. A PMI is a diffusion index, meaning it tracks the share of firms reporting improvement rather than the size of the improvement itself. A reading above 50 tells you more businesses are expanding than contracting, but it does not tell you by how much output actually grew. That distinction becomes important when you ask how durable the move is.
Why the New Zealand dollar took the worst of it
The dollar rose broadly, but NZD/USD took an outsized hit, dropping about 1% to trade near 0.5670-0.5675 after opening the session around 0.5718-0.5728. That was not random. It is structurally predictable, and the same forces will work against the kiwi in any future episode of US rate-hike repricing.
The New Zealand dollar is a high-beta, risk-sensitive currency. FX strategy research from Australasian banks such as ANZ and Westpac has long flagged it as one of the G10 names most tied to global growth sentiment and commodity demand, given New Zealand’s small, open, export-heavy economy. When the dollar is bid on hawkish rate expectations, the kiwi tends to be sold hardest.
Then there is the carry trade. NZD has historically attracted carry positioning, where investors borrow in a low-yielding currency to hold a higher-yielding one. When US real yields rise sharply, the relative appeal of that carry shrinks, and traders unwind long-NZD positions. That unwind amplifies the move well beyond what fundamentals alone would justify.
Layer in the rate-differential picture and you get a double headwind. With the Fed hiking while the Reserve Bank of New Zealand (RBNZ) moves more cautiously, the yield gap shifts against the kiwi at the same time risk appetite sours. Weaker relative yields and softer sentiment hit at once.
What the 1-hour chart says about near-term momentum
The technical picture confirms the bearish read is in the price, not just the narrative. On the one-hour chart, NZD/USD sat near 0.5671, below both the 100-period simple moving average at 0.5720 and the 200-period at 0.5743.
| Level type | Price | Significance |
|---|---|---|
| Resistance | 0.5735 | Horizontal barrier |
| Resistance / 100-SMA | 0.5720 | Supply zone |
| Resistance | 0.5695 | Initial cap |
| Support | 0.5670 | Immediate downside |
| Bearish target | 0.5626 | Next level if 0.5670 breaks |
The 14-period RSI read 29.15, approaching oversold territory. That tells you the move has been fast and sharp, which means a short-term corrective bounce is plausible even if the medium-term direction stays lower. Do not confuse a bounce with a reversal.
Any recovery attempt has work to do. Resistance stacks between 0.5695 and 0.5735, and those levels are likely to cap upside. Break below 0.5670 and the next meaningful target sits at 0.5626. This technical read was produced by Ghiles Guezout of FXStreet, with AI-tool assistance disclosed by the author.
How long does a PMI-driven dollar move actually last?
The signal is real. A broad-based PMI beat of this size genuinely shifts the near-term Fed path, and the dollar’s reaction reflects that. But whether this is the start of a trend or a single-session repricing depends on what comes next, not on the PMI itself.
Return to the methodological point, because it does the heavy lifting here.
A PMI is a diffusion index. It measures how many firms report improvement, not the magnitude of the change in output or prices. That limits how precisely a high print maps onto actual GDP or productivity growth, and it means the survey can overshoot the underlying trend.
Economists at S&P Global, central banks, and in academic work have long cautioned that single-month survey beats are prone to mean reversion. A string of strong months carries far more information than one upside surprise. History across past tightening cycles broadly supports this: PMI-driven dollar rallies have often run for a few sessions to a couple of weeks before consolidating or reversing, depending on whether hard data confirmed the story.
That is the durability test. The move tends to hold when subsequent data corroborate it and fade when they soften or when global risk appetite recovers for unrelated reasons.
Here is what will settle the question over the coming weeks:
- US CPI and PCE inflation prints
- Non-farm payrolls and wages data
- Fed communications following the PMI release
- RBNZ signals on the New Zealand rate path
Fed officials have consistently stressed that policy is set on a broad dashboard of inflation, labour markets, credit conditions, and financial stability, not on one survey. Treat today’s move as a data-driven directional signal, not a confirmed trend change. The signal is genuine, but the life of the trade depends entirely on what the next four to six weeks of hard data reveal.
This article is for informational purposes only and should not be considered financial advice. Investors should conduct their own research and consult with financial professionals before making investment decisions.
What today’s PMI reaction tells you about the next dollar catalyst
Pull the chain together and the model is simple. A PMI beat of this magnitude reprices Fed expectations, which moves yields, which drives the dollar, which hits high-beta currencies like the kiwi hardest and fastest. Understand that sequence and every future flash PMI becomes interpretable through the same lens.
From here, two scenarios frame the outlook:
- Confirmation: CPI, PCE, and payrolls corroborate the growth-and-inflation story, the 68% October hike probability holds or firms, and dollar strength extends.
- Reversal: hard data soften or risk appetite recovers, FedWatch odds erode, and the dollar’s two-month high becomes a near-term ceiling.
The point is not to predict which one lands. It is to recognise that a two-month DXY high and a 68% hike probability are not endpoints. They are the market’s current prior, and every major release between now and the October FOMC is a test of it.
For NZD/USD specifically, the structural read is clear: the pair stays vulnerable whenever US data surprise to the upside, and the technical picture points to limited near-term recovery unless sentiment or data shift materially. If the bearish thesis holds, 0.5626 is the next reference point worth watching.
Past performance does not guarantee future results. Financial projections are subject to market conditions and various risk factors, and these forward-looking scenarios are speculative and subject to change based on incoming data and market developments.