Most investors hear “$600 billion” and assume the hyperscaler capex race is a speculative land grab. The underlying financial data tells a different story: the vast majority of that spending is pre-sold, contracted against multi-year obligations that already sit on balance sheets as legally binding commitments.
Two specific forces produce the number. Cloud revenues across Amazon, Alphabet, Microsoft, and Oracle are growing at 27-60% annually, generating the operating cash flow that funds reinvestment without external financing. Behind that revenue sits more than $2.3 trillion in contracted but undelivered obligations, a backlog so large it reframes the entire capex question from “will demand materialise?” to “can they build fast enough?”
Here is a structured framework for evaluating whether the AI infrastructure investment thesis holds at the provider level, built on the specific financial mechanics rather than headline figures or aggregate sentiment.
The $600 billion figure in context: where it comes from and who is counting
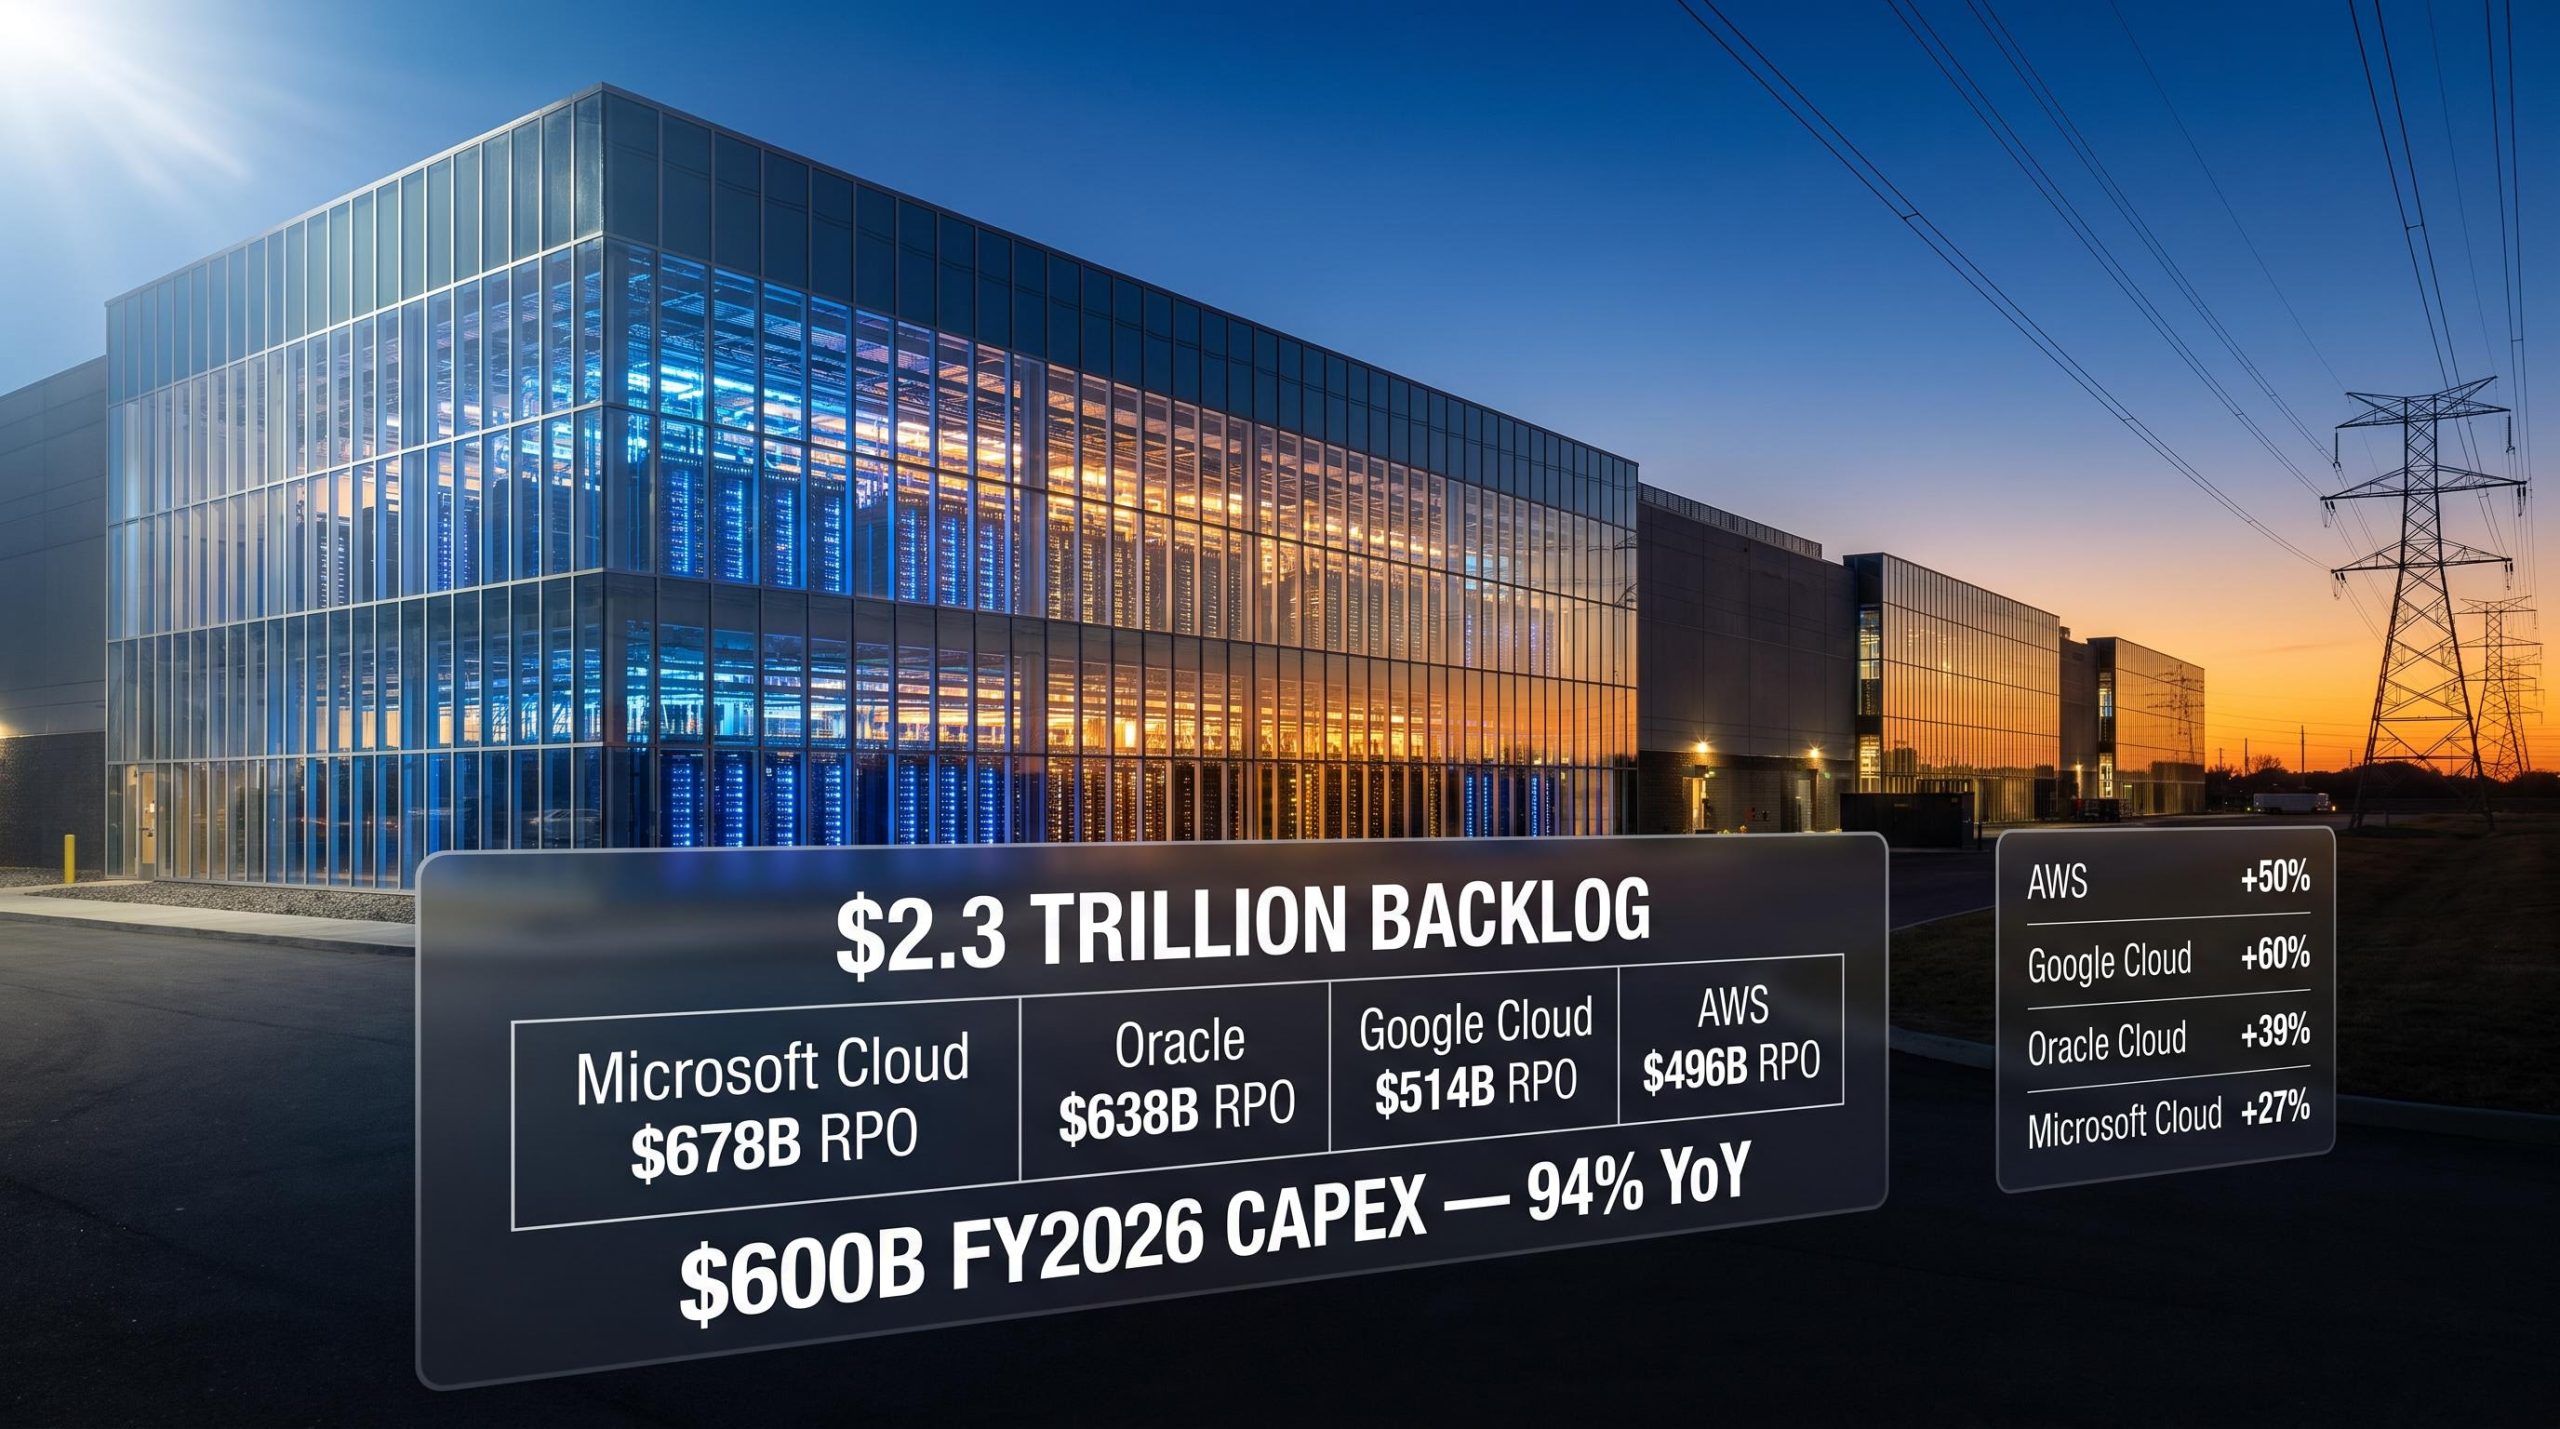
The number itself is less stable than it appears. Yardeni Research calculates that FY2026 capex guidance across the four-company group of Amazon, Alphabet, Microsoft, and Oracle reaches approximately $600 billion, nearly doubling the $309 billion those same companies spent in FY2025, an increase of approximately 94% year on year.
Broaden the set to include Meta, and the figures shift materially. CreditSights projects approximately $602 billion for its five-company grouping, while Futurum Group estimates $660-690 billion. Other syntheses push the range above $725 billion.
The FY2025 baseline moves too. The four-company figure is $309 billion; five-company groupings produce a $380-443 billion range depending on fiscal year alignment. If you are comparing capex across sources and not pinning each figure to a specific company set and fiscal period, you may be comparing genuinely different things, and any return-on-investment calculation built on an inconsistent denominator will produce misleading results.
Prior technology investment peaks, including the dot-com era at approximately 4.2% of GDP and the cloud buildout at 3.8%, provide the only available historical frame for assessing whether current AI capex intensity is unprecedented in scope or simply the latest in a recurring pattern of infrastructure-led cycles.
| Company set | FY2025 actuals | FY2026 guidance | Approximate YoY change |
|---|---|---|---|
| Four-company (excl. Meta) | ~$309 billion | ~$600 billion | ~94% |
| Five-company (incl. Meta) | ~$380-443 billion | $602-725+ billion | ~58-77% |
The four-company doubling: From $309 billion in FY2025 to approximately $600 billion in FY2026, the four hyperscalers tracked by Yardeni Research are guiding for a near-doubling of capital expenditure in a single fiscal year.
When big ASX news breaks, our subscribers know first
Cloud revenues at 27-60% growth: the cash flow engine making this bet executable
The capex is not being funded by debt issuance or speculative wagers on future demand. It is being funded by some of the fastest-growing large businesses on the planet.
Microsoft Cloud turned in FY2026 revenue of $214.3 billion, a 27% year-on-year increase that, while the slowest in the group, still represents more than $45 billion in incremental annual revenue. AWS generated $134.7 billion over the four quarters ending June 2026, a 50% advance. Google Cloud recorded $77.7 billion for the year, up 60%. Oracle Cloud came in at $34.0 billion, reflecting 39% growth.
| Provider | FY2026 cloud revenue | YoY growth | FY2026 RPO/backlog |
|---|---|---|---|
| Microsoft Cloud | $214.3 billion | 27% | $678 billion |
| AWS | $134.7 billion | 50% | $364-496 billion |
| Google Cloud | $77.7 billion | 60% | $460-514 billion |
| Oracle Cloud | $34.0 billion | 39% | $638 billion |
Revenue at scale versus revenue growing at pace: why both matter
The distinction between Microsoft’s scale and Google Cloud’s growth rate matters for how each provider justifies its capex programme. Microsoft’s $214.3 billion base generates the largest absolute cash flow available for reinvestment, meaning it can absorb the highest dollar capex without straining its financial structure. Google Cloud’s 60% growth rate means its revenue base is compounding fastest, narrowing the gap against which future capex will be measured.
For investors evaluating whether this level of spend is self-funding, the question is whether operating cash flow at these growth rates can absorb $600 billion in reinvestment without requiring external capital. These revenue figures are the starting point for that test. Watching for deceleration in these rates is a more useful early warning signal than tracking headline capex announcements.
Debt-funded capex sustainability introduces a structural risk that operating cash flow figures alone do not capture: hyperscalers issued $121 billion in debt in 2025, roughly four times the five-year average, with another $100 billion projected in 2026, which shifts the capital structure question from revenue coverage to balance sheet durability.
What $2.3 trillion in contracted backlog actually signals
Most investors track reported revenue and capex announcements. Fewer track remaining performance obligations, or RPOs, which represent signed customer commitments for services not yet rendered. These are legally signed multi-year commitments from cloud and AI service customers. They appear as liabilities on the provider’s balance sheet (the provider owes future service) but represent high-visibility future cash flows.
RPOs are governed by ASC 606 revenue recognition standards, which require companies to disclose the aggregate transaction price allocated to performance obligations that are unsatisfied or partially unsatisfied, giving these backlog figures their legal and accounting precision as forward-looking demand indicators.
RPOs matter more than reported revenue for assessing a long-duration infrastructure bet because they capture demand that has been committed but not yet built for. When backlog grows faster than current revenue, demand is being placed faster than capacity can be delivered. That is precisely the dynamic characterising the 2025-2026 hyperscaler market.
Combined across the four providers, contracted backlog exceeds $2.3 trillion in FY2026, with the two largest positions held by Microsoft and Oracle:
- Microsoft: $678 billion (pre-verified, Yardeni Research)
- Oracle: $638 billion (pre-verified, Yardeni Research)
- Google Cloud: $460-514 billion (research layer, analyst synthesis range)
- AWS: $364-496 billion (research layer, analyst synthesis range)
The Oracle ratio: Oracle’s RPO of $638 billion sits at approximately 18.8 times its FY2026 cloud revenue of $34 billion, reflecting very long-duration contract commitments and a rapidly growing AI workload pipeline. According to Yardeni Research data, this is the most extreme backlog-to-revenue ratio in the group.
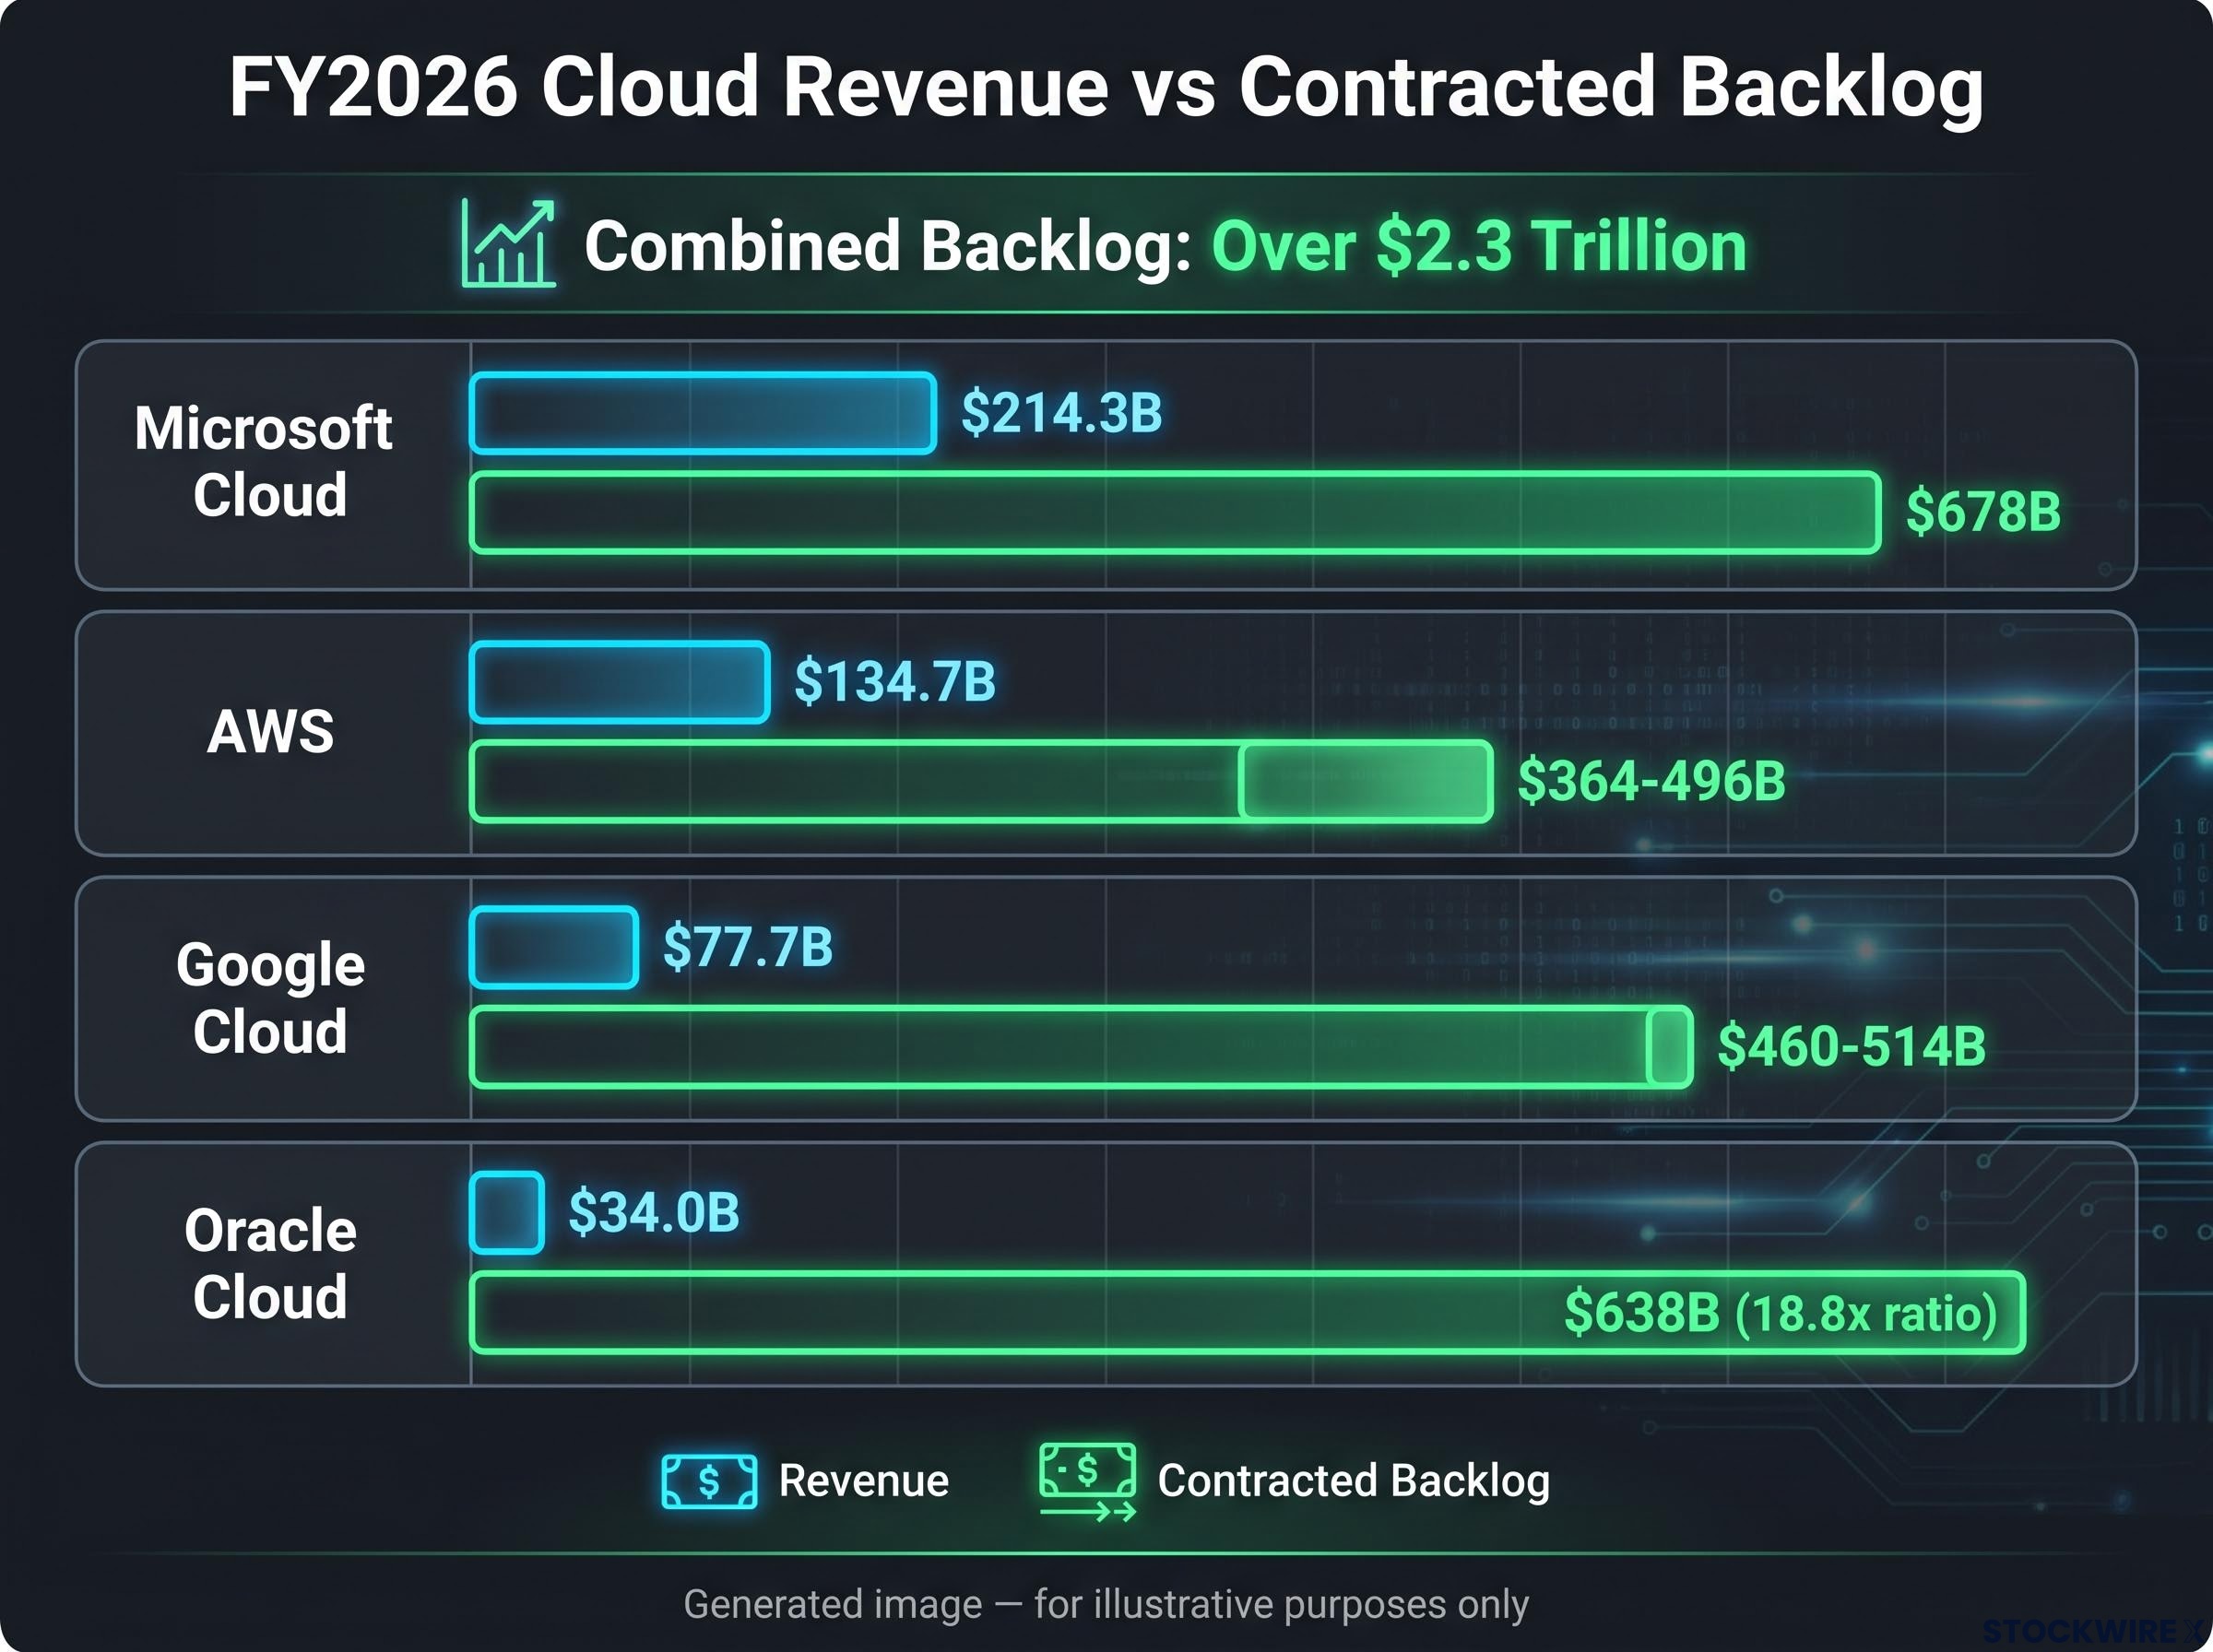
Set the $2.3 trillion in combined backlog against $600 billion in planned capex and the framing shifts. The build-out is being justified against contracted demand already on the books, not against forecast models. What this tells you as an investor is that the risk question is no longer “will demand materialise?” It is “will they build fast enough to deliver what they have already sold?”
This article is for informational purposes only and should not be considered financial advice. Investors should conduct their own research and consult with financial professionals before making investment decisions.
Why AI workloads require fundamentally more capital than traditional cloud
This is not a story about buying more servers. AI training and inference infrastructure requires a step-change in capital density per unit of compute, driven by three specific engineering factors:
- GPU and accelerator density: AI-optimised data centres require dense clusters of GPUs and custom accelerators, consuming far more power and physical space per compute unit than traditional cloud workloads.
- Interconnect bandwidth requirements: Training large models demands very high-bandwidth networking between nodes, requiring specialised infrastructure that traditional data centres were not designed to support.
- Power and grid infrastructure: AI facilities operate at power density levels that exceed conventional data centre specifications, requiring new campuses, grid upgrades, and long-lead equipment procurement including transformers and switchgear.
The 75% AI-specific share as an analytical filter
According to CreditSights and MUFG analyses, approximately 75% of FY2026 hyperscaler capex, roughly $450 billion, targets AI-specific infrastructure rather than traditional cloud maintenance or refresh. That distinction matters for return analysis: the AI-specific spend is forward-looking and tied to growing backlog, while maintenance capex is necessary but not a growth driver. The $450 billion figure is directional rather than precise, drawn from research layer estimates rather than direct company disclosure, but it provides a more analytically useful numerator than the raw $600 billion for anyone assessing forward-looking returns.
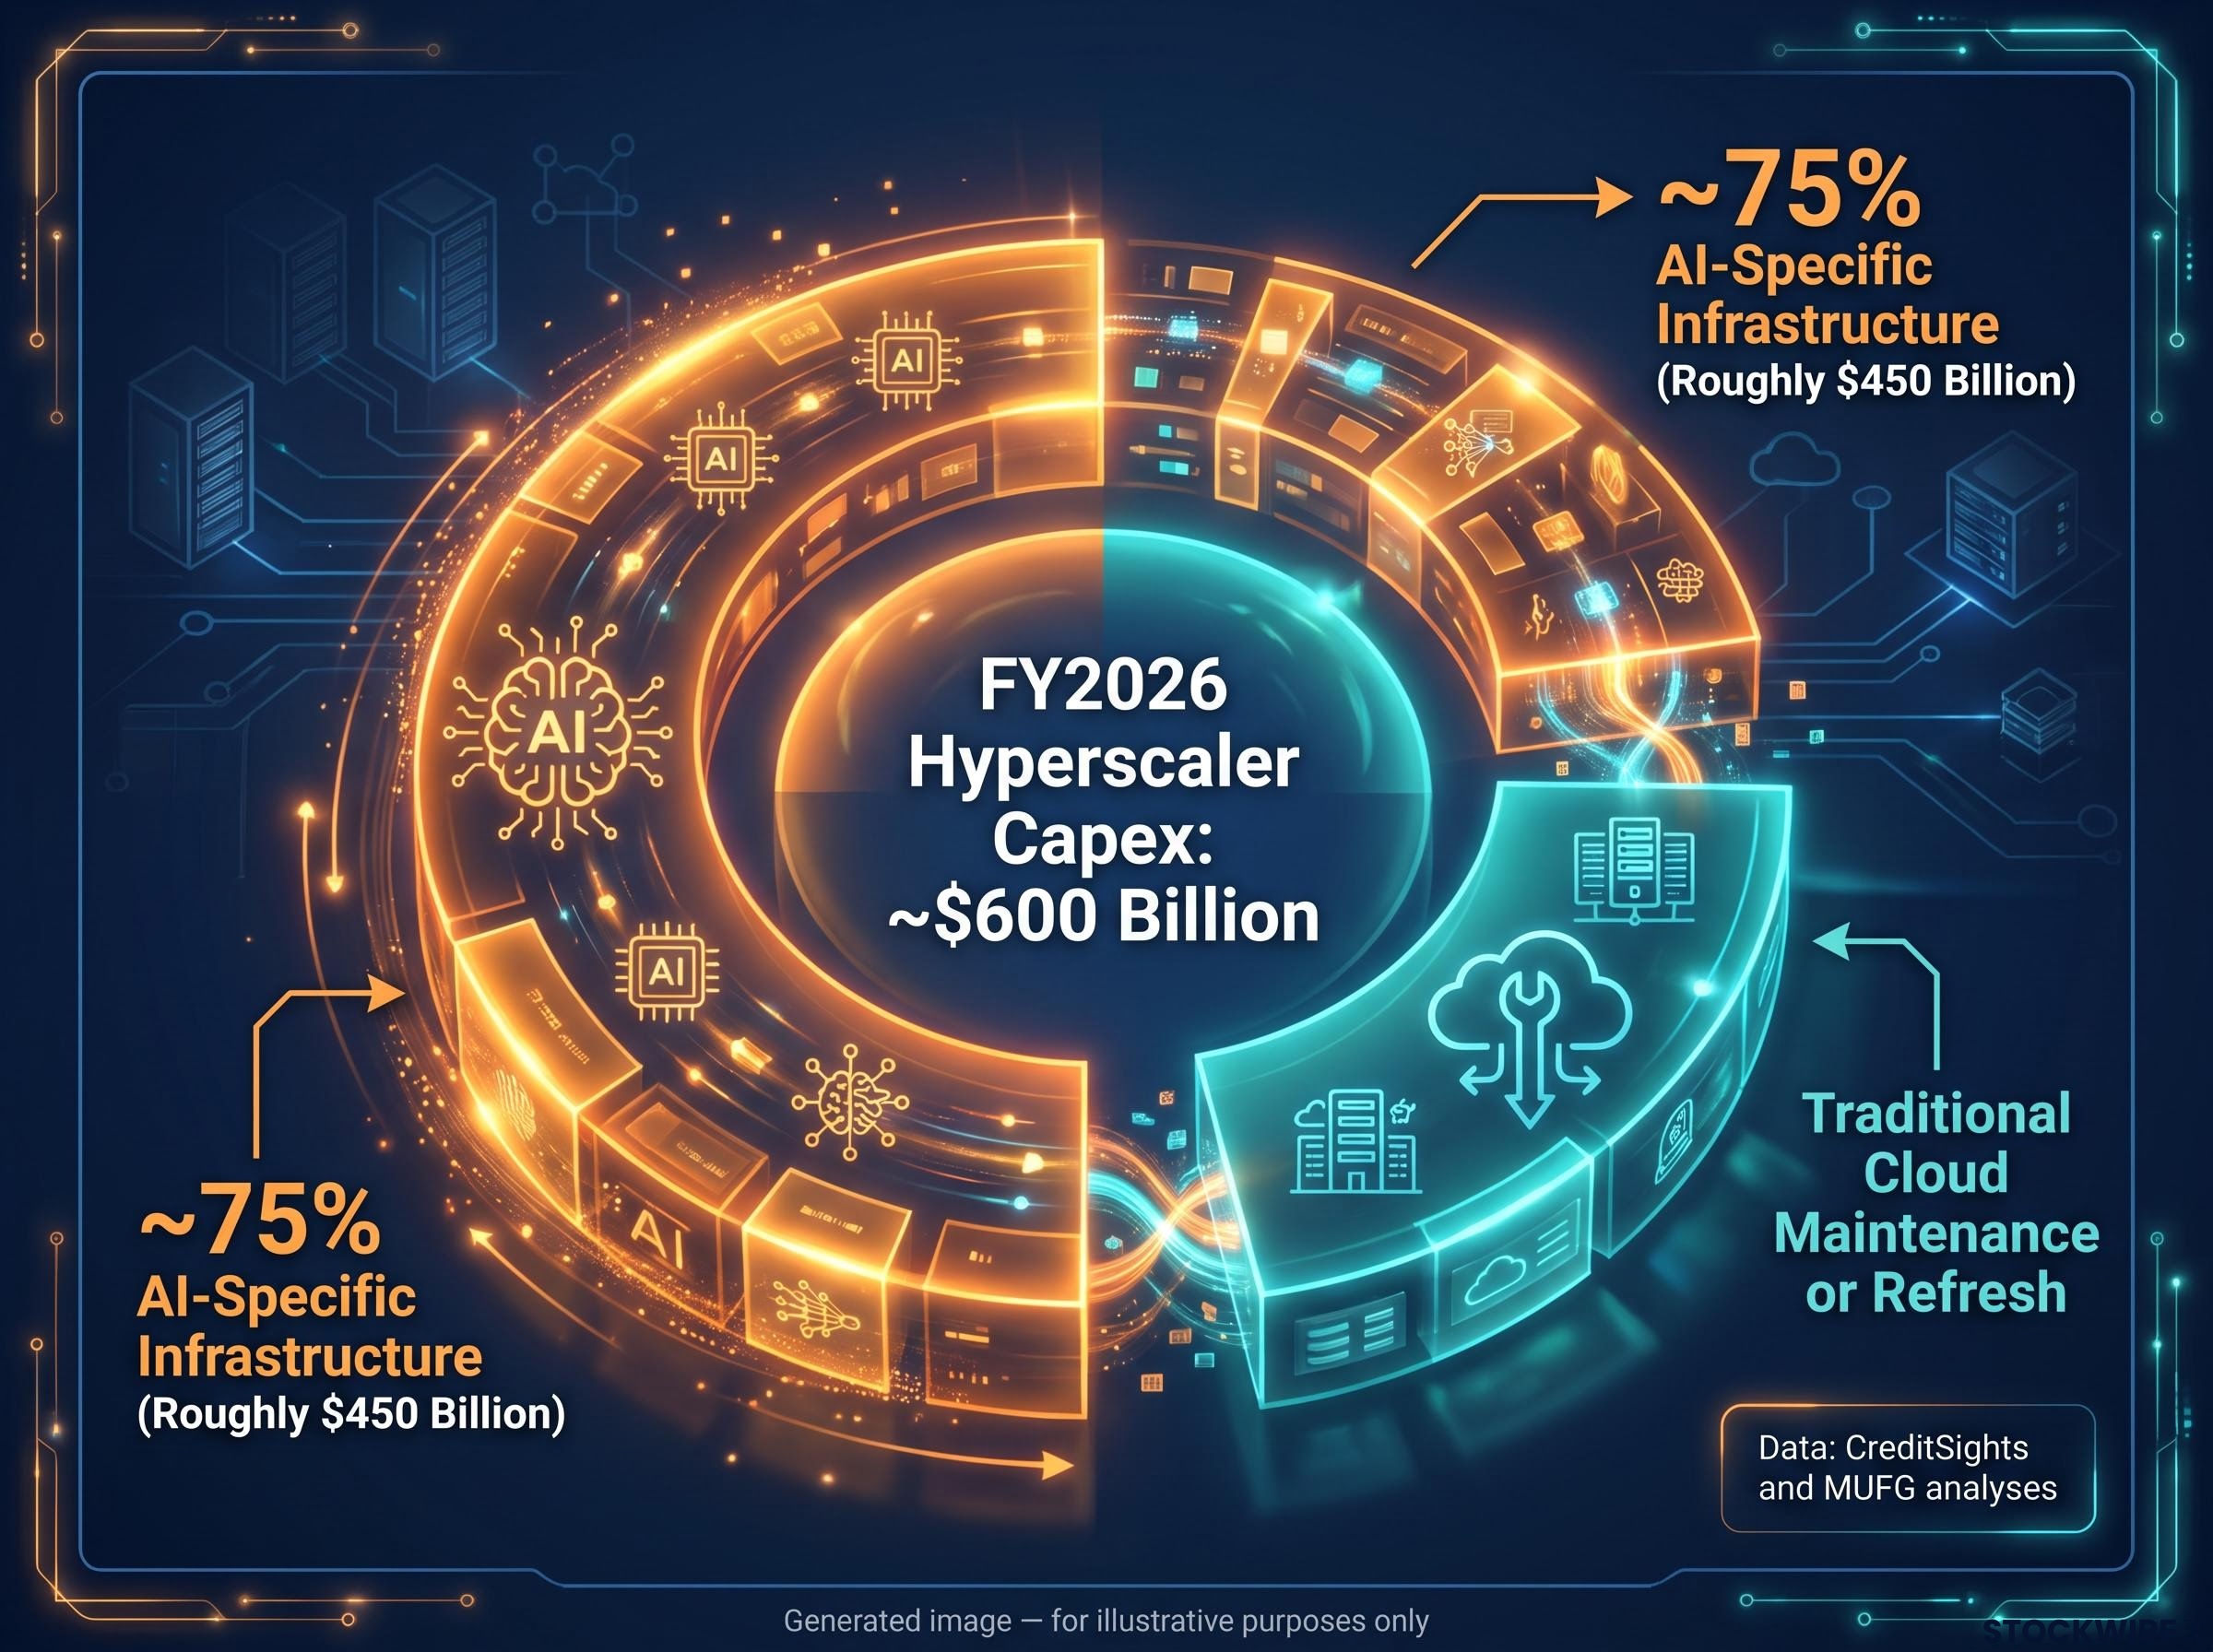
For investors comparing this cycle to prior cloud buildouts, the 75% AI-specific share signals that historical cloud capex return-on-investment benchmarks are not directly transferable. A large portion of this spend is creating genuinely new infrastructure categories, which changes both the depreciation timeline and the competitive moat analysis.
Delays into 2027: how to read postponement versus retreat
Capacity expansion timelines are extending into 2027 and beyond. According to Yardeni Research, the build-out is experiencing delays rather than cancellations, with the firm characterising the dynamic as a deferral of planned capacity rather than any withdrawal from it. The holdups fall into three categories of physical constraint:
- Power availability and grid connections: the primary bottleneck across most jurisdictions
- Long-lead equipment procurement: transformers, switchgear, and similar infrastructure items with multi-year lead times
- Regulatory and permitting friction: pushing planned projects into later years even as demand remains strong
The question for investors is whether these delays signal softening demand or simply physical limits on how fast infrastructure can be built. Independent data provides a concrete answer.
Sightline Climate’s tracking of large-scale data centre development shows that out of 777 projects monitored, just nine have been cancelled, a ratio that points firmly toward physical execution constraints rather than any meaningful pullback in commitment.
That ratio, nine out of 777, is the most concrete available evidence that delays are about physical constraints, not demand erosion. The implications differ by investment time horizon:
- Long-duration investors face primarily a duration and internal rate of return question. Cash flows arrive later, but the underlying thesis (large contracted backlog, high growth rates) remains intact.
- Short-term, EPS-focused investors face greater quarterly modelling volatility, as the exact cadence of capex-to-capacity-to-revenue conversion becomes harder to predict.
Conflating postponement with retreat will produce the wrong directional call. The evidence currently points toward the former.
Past performance does not guarantee future results. Financial projections are subject to market conditions and various risk factors.
What the data actually supports: a framework for evaluating the bet at the provider level
The “$600 billion bet” label obscures four meaningfully different risk-reward profiles. Microsoft brings scale and the largest absolute RPO. AWS combines rapid growth with the broadest existing infrastructure footprint. Google Cloud has the fastest growth rate and is compounding its base most aggressively. Oracle carries the most extreme backlog-to-revenue ratio, reflecting very long-duration commitments.
| Provider | FY2026 cloud revenue | YoY growth | FY2026 RPO/backlog | Backlog-to-revenue |
|---|---|---|---|---|
| Microsoft Cloud | $214.3 billion | 27% | $678 billion | ~3.2x |
| AWS | $134.7 billion | 50% | $364-496 billion | ~2.7-3.7x |
| Google Cloud | $77.7 billion | 60% | $460-514 billion | ~5.9-6.6x |
| Oracle Cloud | $34.0 billion | 39% | $638 billion | ~18.8x |
Provider-level disaggregation is the step most analysis skips. The aggregate figure is useful for macroeconomic sizing; it is not useful for individual security evaluation. A practical framework for assessing each provider requires four questions:
- Is backlog growth keeping pace with or exceeding capex growth, confirming demand-driven rather than speculative investment?
- What share of capex is AI-specific growth spend versus maintenance, and is the growth share increasing or stabilising?
- What does independent project cancellation data show about execution commitment, and is the cancellation rate rising?
- How does the provider’s backlog-to-revenue ratio compare to peers, and what does it imply about contract duration and revenue visibility?
The current evidence, large contracted backlogs, high growth rates, and a very low project cancellation rate, points in one direction. Timing risk, the conversion of backlog to delivered revenue, is the primary unresolved variable. Each investor needs to assess that against their own time horizon.
The capex-to-revenue conversion timeline is where the investment thesis most frequently breaks down: PIMCO estimates hyperscaler capex now absorbs 93-94% of operating cash flow, up from 33-40% in 2022-2023, compressing the financial flexibility that historically distinguished strong from marginal infrastructure cycles.
Beyond the headline: three variables that will determine whether this cycle justifies itself
The preceding analysis converges on three specific, observable variables that will resolve the timing question over the next 12-18 months. These are the metrics worth tracking quarterly, not the capex headline number, which is a commitment figure rather than a delivery or return signal.
- Backlog growth rate relative to capex growth. If RPO growth decelerates below capex growth, demand is no longer outpacing the build-out. The current baseline is over $2.3 trillion in combined backlog against $600 billion in planned capex. A narrowing ratio is the earliest demand-softening signal.
- AI-specific share of new capex commitments. If the 75% AI-specific allocation begins shifting toward maintenance or traditional cloud refresh, the forward-looking growth thesis weakens. A declining AI share suggests the investment is becoming defensive rather than expansionary.
- Independent project cancellation rate. Sightline Climate’s dataset currently records nine project cancellations across 777 developments under observation. A rising cancellation rate, particularly if concentrated among specific providers or geographies, would indicate that physical constraints are becoming structural rather than temporary.
RPO figures and capex guidance evolve quarterly, and the figures in this analysis reflect disclosures through mid-2026. These variables are directly trackable through quarterly earnings filings and independent datasets such as Sightline Climate. Monitoring them gives you a practical early-warning system for distinguishing a thesis that is playing out on a delayed schedule from one that is breaking down.
The AI capital cycle, when read layer by layer from semiconductor supply through hyperscaler infrastructure to enterprise application adoption, reveals that infrastructure adjacencies including utilities, data centre REITs, and contracted-revenue providers offer exposure to the same demand growth with more predictable cash flow profiles than direct hyperscaler positions at current valuations.
These statements are speculative and subject to change based on market developments and company performance.