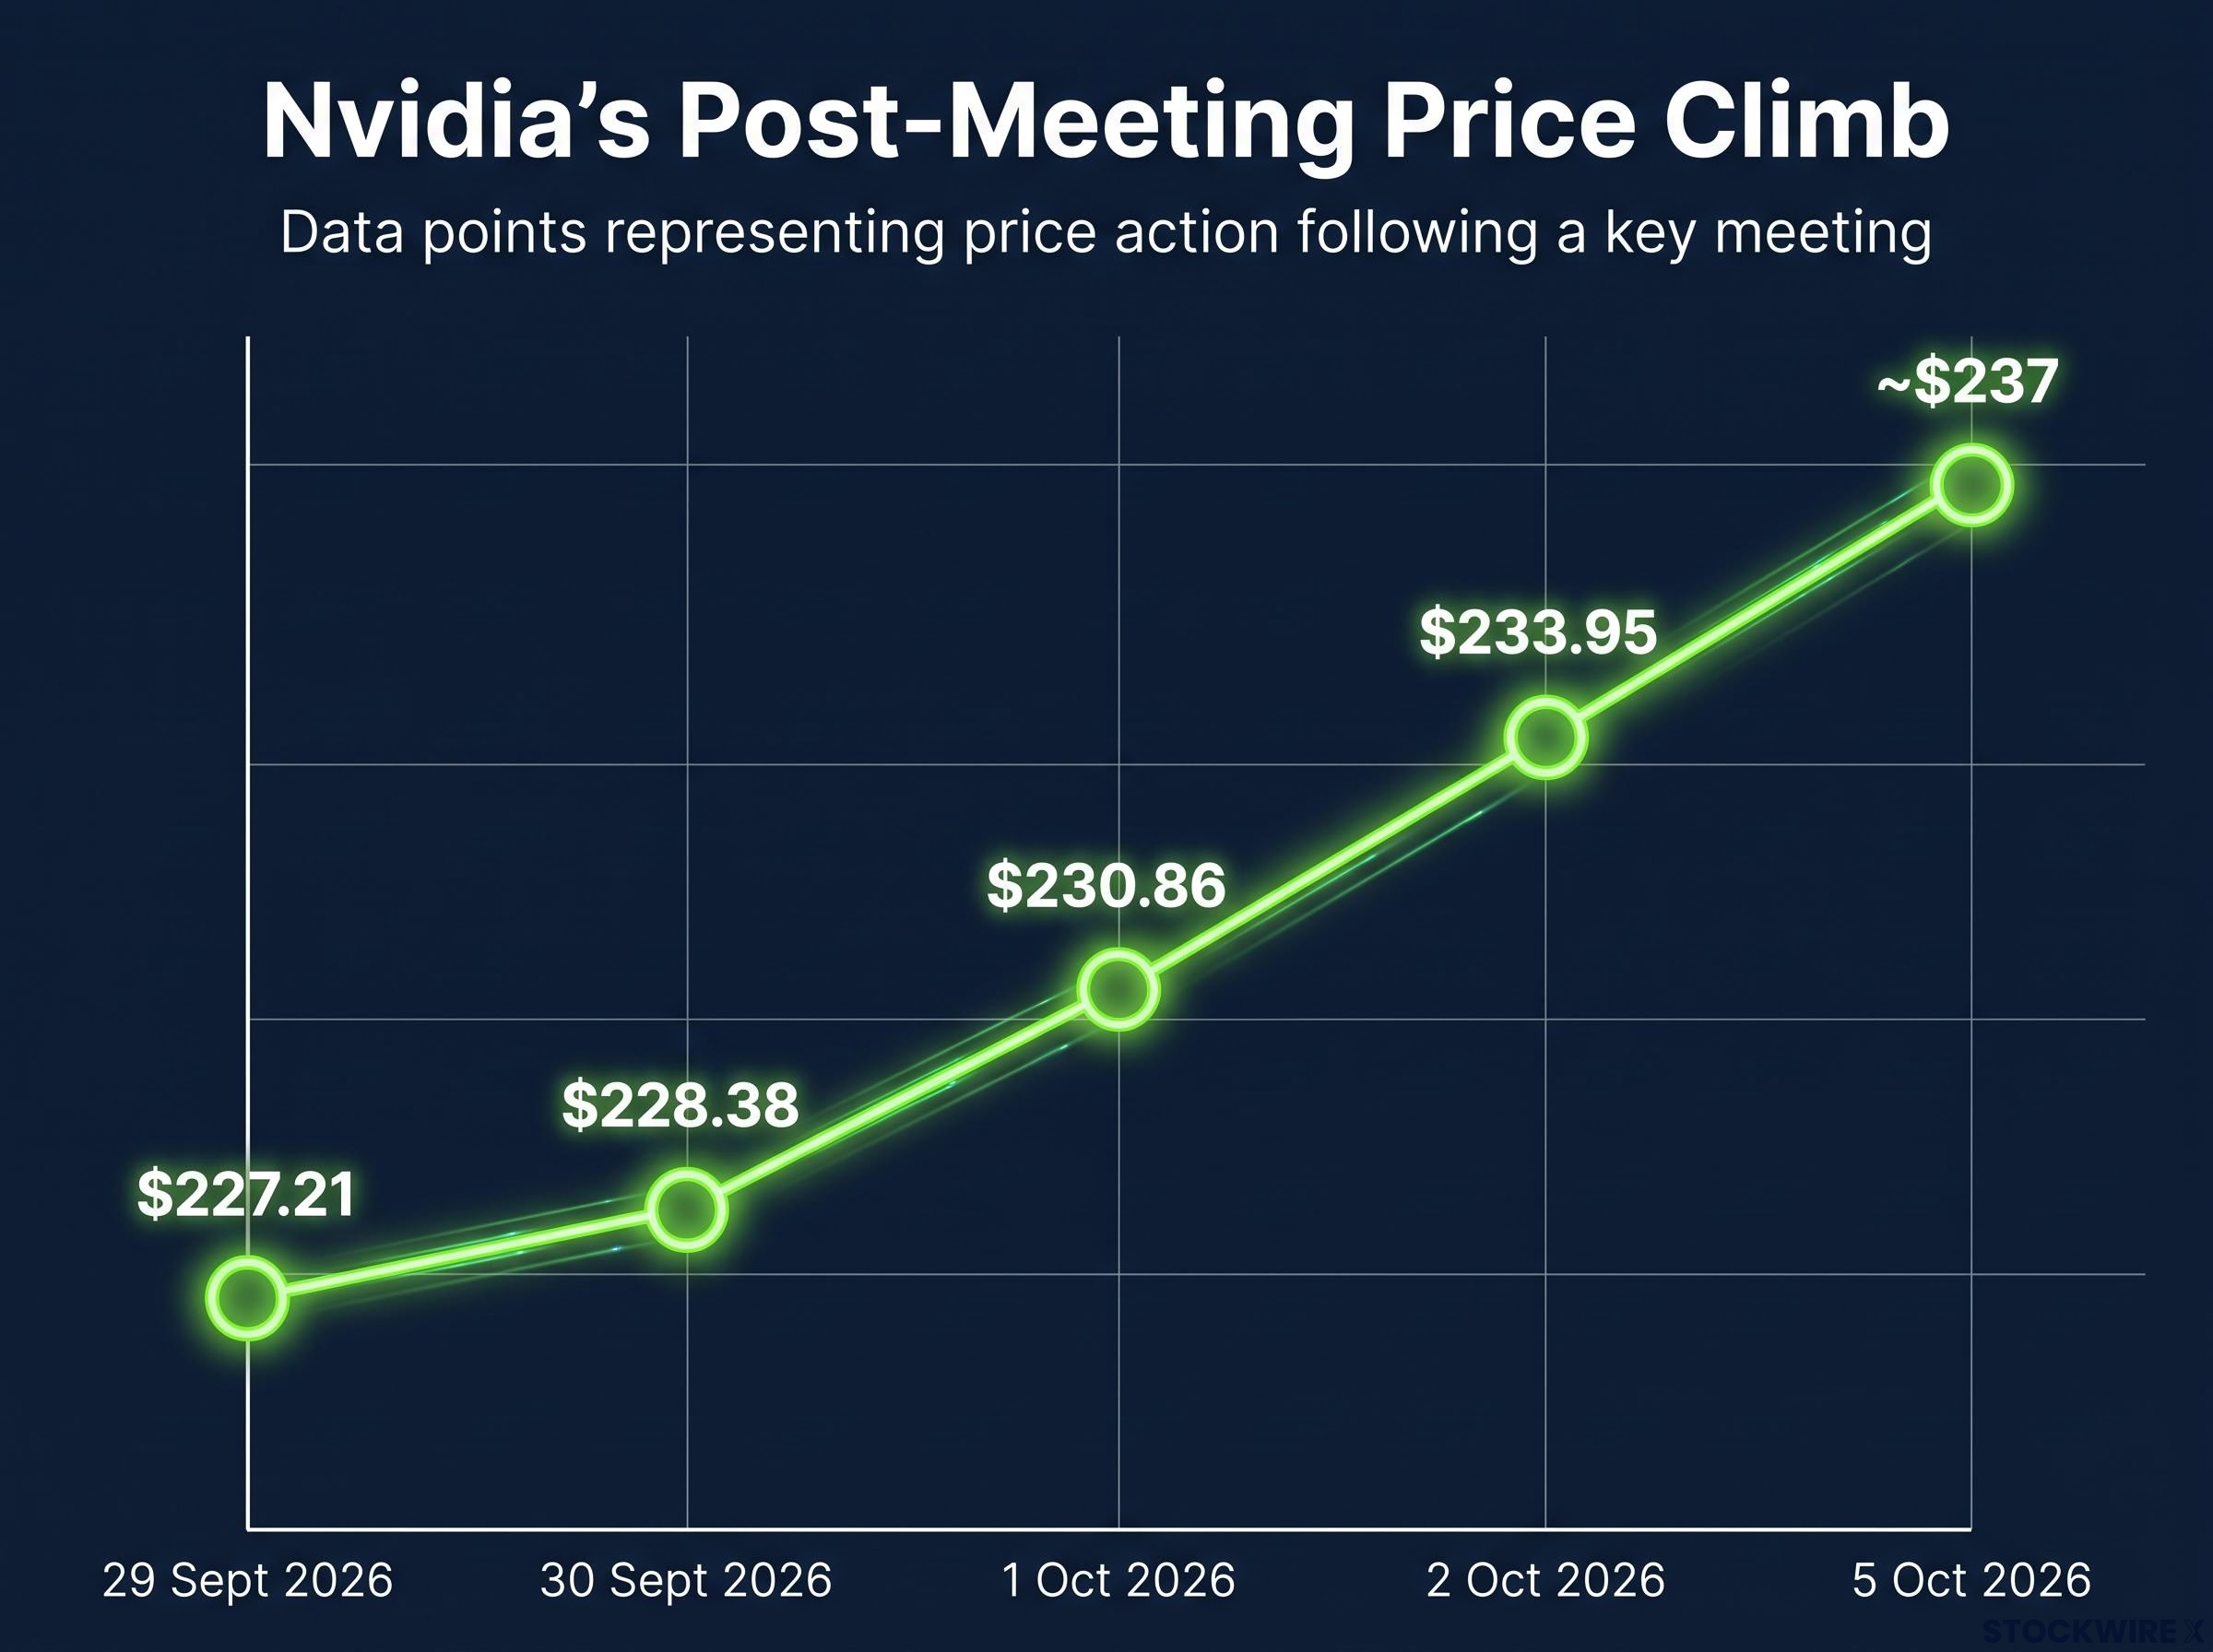
Nvidia has climbed from $227.21 on 29 September to roughly $237 by 5 October, yet no analyst has tied the move to the White House AI meeting held that day. So can chart levels tell you anything about AI stocks when the cause of the rally is unproven?
Chief executives from Nvidia, Microsoft, Palantir and Meta attended, and names linked to Apple and SpaceX have drawn fresh chart attention too. One independent analyst, Nick Valdez of Verified Investing, has published specific price targets for them.
For a U.S. investor, the question is whether to trust, ignore or learn from calls like these.
Here is a clear way to read resistance zones and measured-move targets, plus an honest view of where AI stocks technical analysis fails.
What actually moved AI stocks after the White House meeting?
The story is easy to tell. On 29 September 2026, President Donald Trump and House Speaker Mike Johnson hosted tech leaders in the East Room, including Jensen Huang, Mark Zuckerberg, Satya Nadella, Alex Karp, Sundar Pichai and Elon Musk. Shares then climbed.
The event produced the voluntary “White House Accord on Superintelligence,” which committed signatories to four steps, according to CNN Business and CNBC:
- Establish internal monitoring of powerful AI models for cybersecurity and other risks.
- Create an internal team to confirm controls and detection systems work as intended.
- Partner with outside auditors to independently assess models and safeguards.
- Designate an independent board committee to receive reports and ensure problems are addressed.
Trump called the accord “morally binding.” Johnson described it as a voluntary “statement of principles,” and CNBC and CNN both stress that it leaves leading AI companies largely self-regulating rather than under binding federal rules.
Nvidia’s closes show the climb:
| Date | Nvidia close |
|---|---|
| 29 September 2026 | **$227.21** |
| 30 September 2026 | **$228.38** |
| 1 October 2026 | **$230.86** |
| 2 October 2026 | **$233.95** |
| 5 October 2026 | About **$237** |
The rally is real in Nvidia’s data. The cause is not. Market data puts Nvidia’s market capitalisation near $5.65 trillion, while Valdez cited $5.69 trillion, a gap likely reflecting different price points. Microsoft is up about 2.8% from its 29 September level, and the basis for Valdez’s “6% pump” is unclear.
Markets appear to have treated the voluntary self-regulation accord as a valuation positive, since it carried no binding enforcement, though attendance overlap with the day’s top gainers is not proof of cause.
Independent price data for Palantir, Meta, Apple and SpaceX could not be located. SpaceX carries a further flag: Valdez’s source reports a June 2026 listing under SPCX, while other checks found no public listing. That conflict is unresolved and should be verified before you act on any SpaceX level.
Plausible drivers include AI infrastructure demand, hyperscaler spending plans and sentiment, but none is proven to stem from this meeting. What that tells you is that the meeting is a backdrop, not a thesis.
Faded versus durable policy rallies
History offers two contrasting precedents. The 2018-2019 U.S.-China trade-truce rallies faded when talks stalled or tariffs returned.
The 2020 policy-backed tech run persisted because funding and earnings followed. Durability tracked fundamentals, which is the test any post-meeting rally still has to pass.
When big ASX news breaks, our subscribers know first
How to read resistance zones, trend lines and measured-move targets
On a chart, a resistance level is a horizontal line where price has stalled before. Traders watch it because sellers have previously outweighed buyers there, so a close above it, on heavy volume and across several timeframes, is treated as a sign the pattern may be changing.
Each tool is a different way of drawing that idea, and each breaks in its own way:
| Tool | What it shows | Common failure mode |
|---|---|---|
| Resistance zone | Area where selling has previously overcome buying | False breakouts |
| Trend line | Line joining higher lows or lower highs | Subjective anchor points |
| Pivot high | Local swing high flanked by lower highs | Minor pivots are noise |
| Fibonacci retracement | Pullback levels at 23.6%, 38.2%, 50%, 61.8% and 78.6% | Often no better than other evenly spaced levels |
| Inverse head and shoulders | Bullish reversal: two shoulders around a deeper low | Breakout fails to hold; neckline retests |
The 38.2% and 61.8% Fibonacci levels draw the most attention. Their pull can be partly self-fulfilling, but failure rates remain high.
The measured-move method turns an inverse head and shoulders into a target:
- Find the head low, the deepest point of the pattern.
- Measure the distance from that low to the neckline, the line joining the peaks between the shoulders.
- Project that distance upward from the point where price breaks above the neckline.
The result is a guideline, not a promise. Breakouts frequently retest the neckline before moving on, and many fail outright.
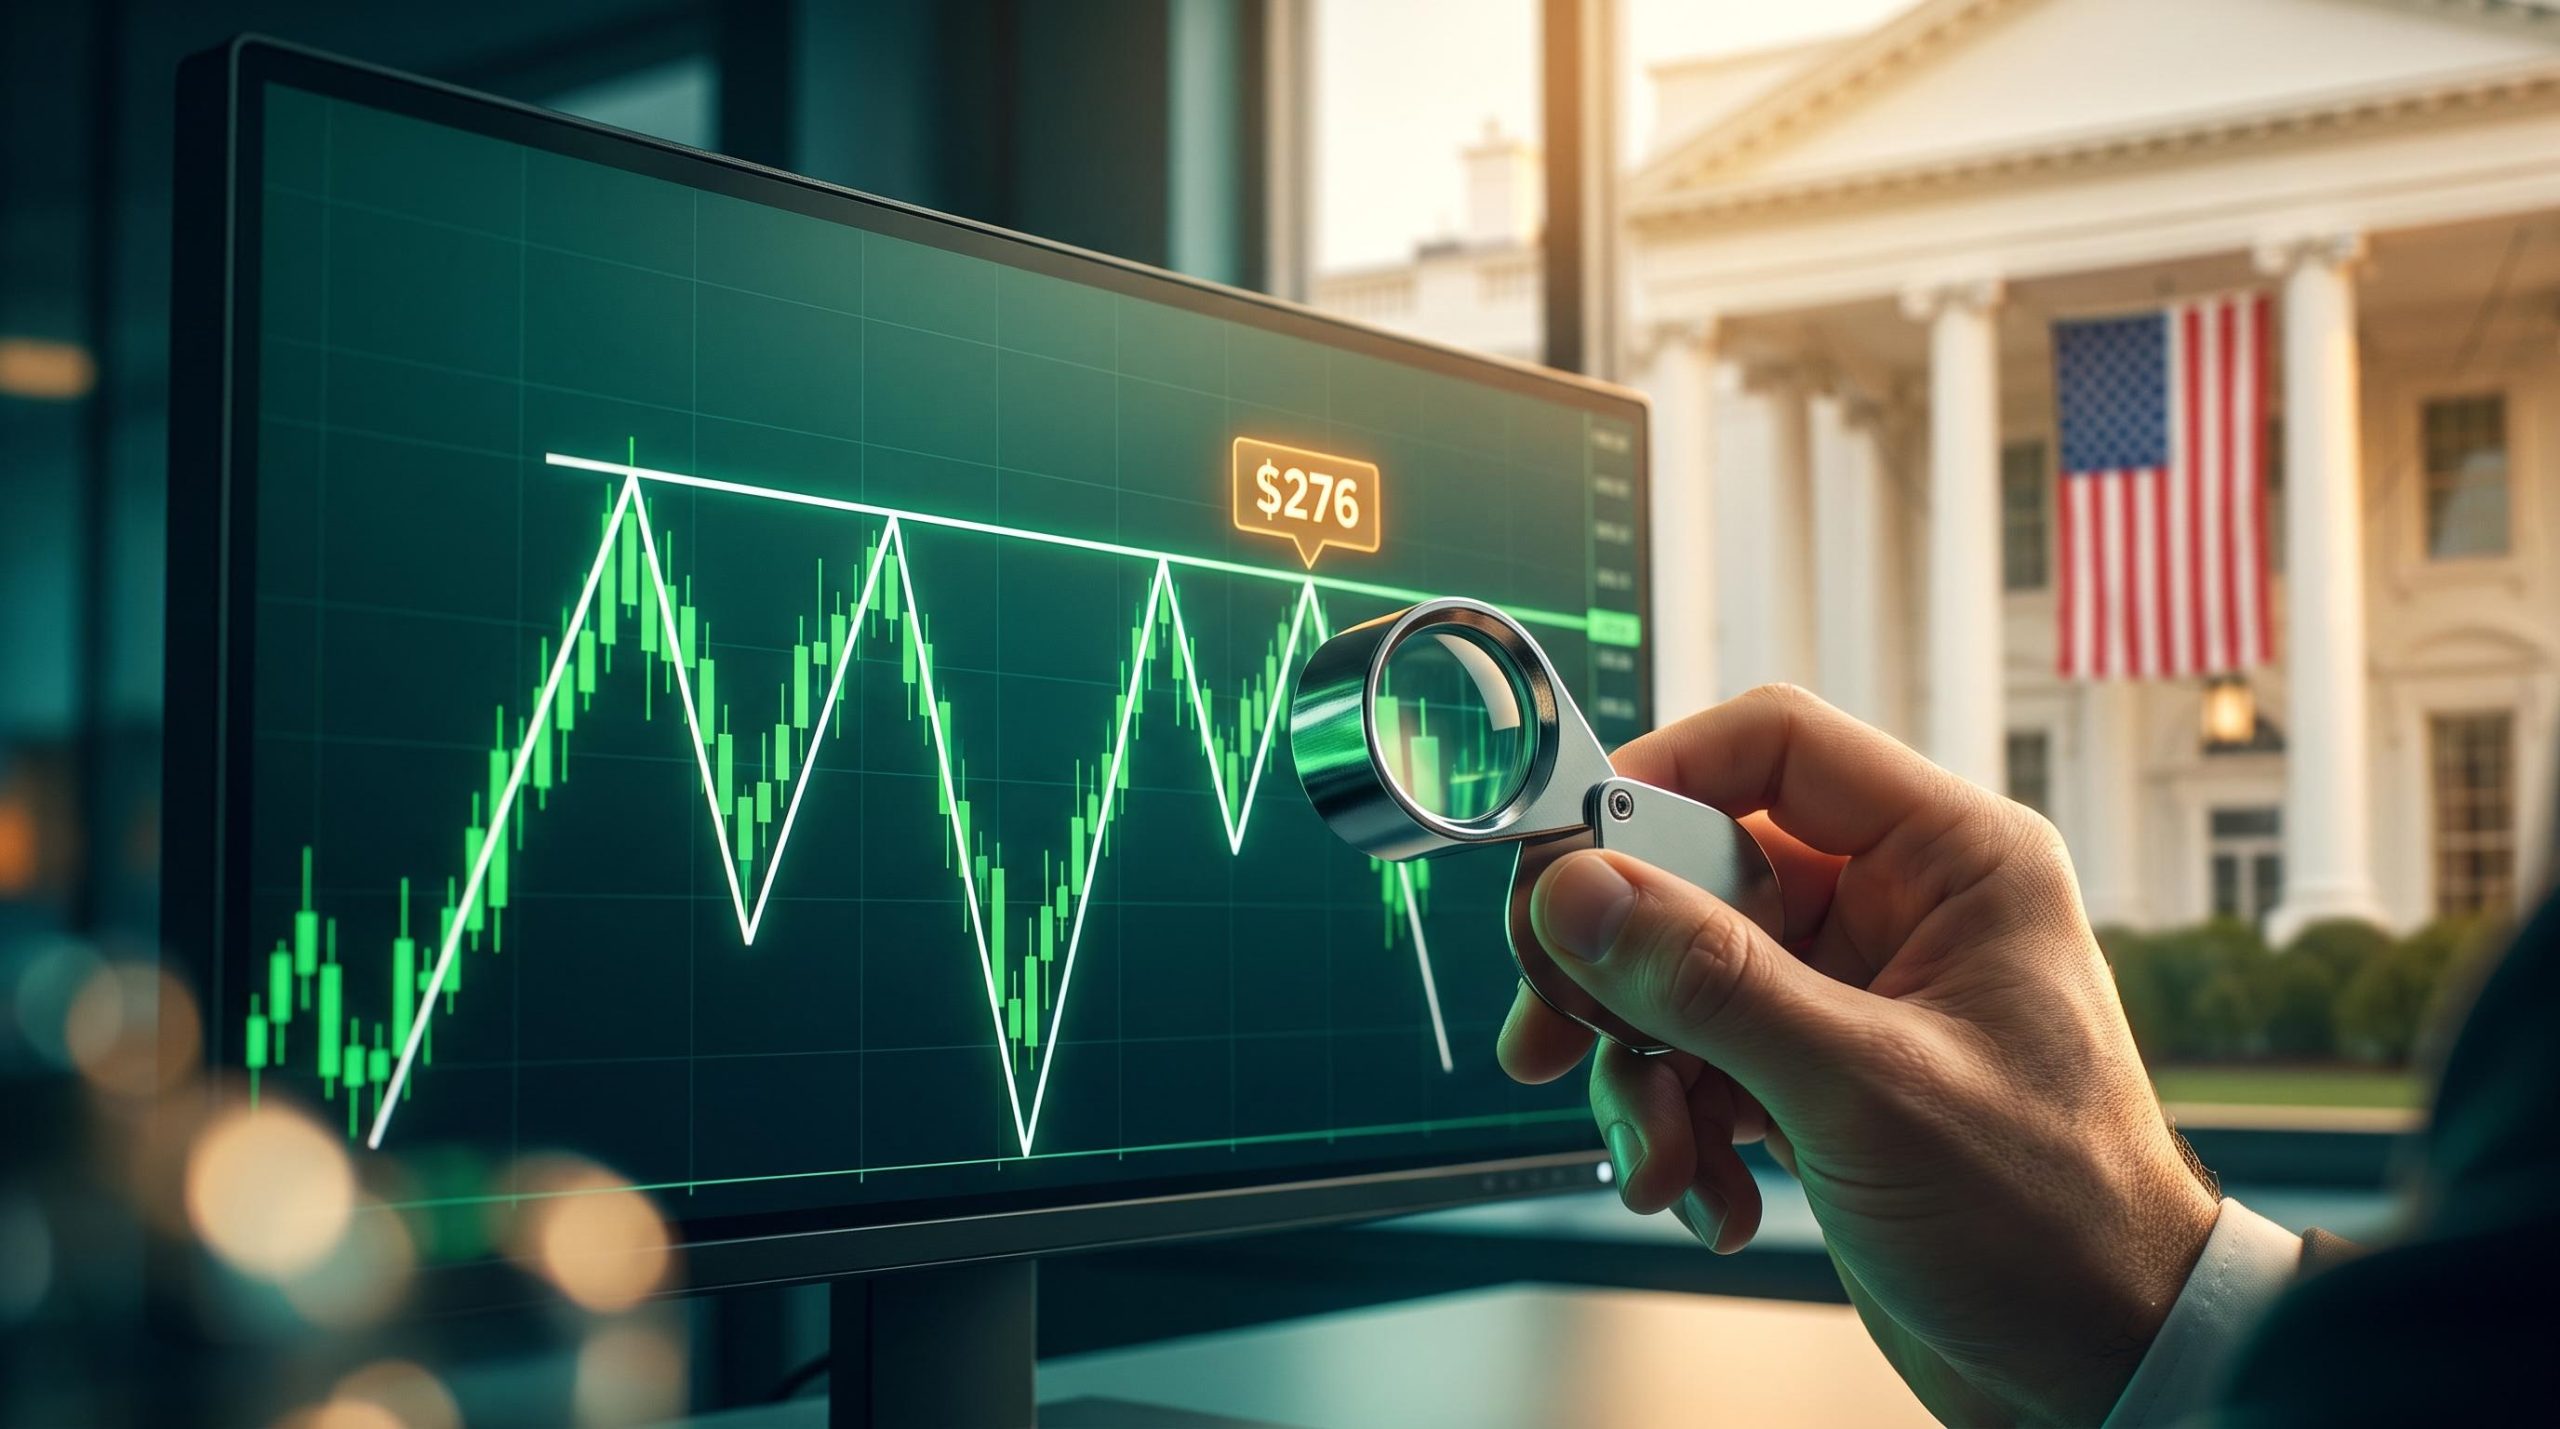
Bulkowski’s Head and Shoulders statistics put full measured-move completion at only 51% across more than 2,800 patterns, a useful reality check when a target such as Nvidia’s $276 is presented as a likely destination.
Investor education caution The SEC and FINRA both warn that technical analysis and chart patterns do not guarantee investment performance.
Academic work by Andrew Lo and Craig MacKinlay finds limited and inconsistent out-of-sample predictive power once costs and data-snooping are counted. Because patterns are probabilistic, use these levels to plan entries, exits and risk, never as forecasts.
The analyst’s levels for Nvidia, Microsoft, Palantir, Meta, Apple and SpaceX
The levels below are Valdez’s views, from his early-October follow-up, and were not independently verified. His source also labels its timeframe as 2025, though the context points to 2026.
| Stock | Key level | Pattern or tool | Analyst’s view |
|---|---|---|---|
| Apple | About **$347**-**$350** | Resistance | Possible profit-taking zone |
| Microsoft | Near **541** | Descending trend line from July 2025 | Next resistance |
| Meta | About **796**, then **$800** | Pivot top, Fibonacci rejection | Psychological level may be tested |
| Palantir | About **$263-$264** | Inverse head and shoulders | Next target after earlier 195 target was reached |
| Nvidia | About **$276** | Pivot, less clean inverse head and shoulders | A 20% move not to be discounted |
| SpaceX | About **172** | Pivot high set 30 June | Pushing toward it (listing unverified) |
Mega-cap resistance: Apple, Microsoft, Meta
Apple is the simplest case: Valdez sees resistance near $347, possibly creeping toward $350, where holders might take profits. Microsoft faces a descending trend line drawn from its July 2025 near double top, near 541.
Meta’s pivot top sits near 796, with the round $800 potentially tested soon. The fundamental storyline is Muse, a personal AI agent launched on 8 September with a free tier and $20 and $100 monthly plans, available in the U.S. only.
Breakout and pattern targets: Palantir, Nvidia, SpaceX
Palantir has already reached Valdez’s earlier 195 target. He now points to roughly $263-$264 from an inverse head and shoulders, and expects breakouts to retest before a larger rise.
Nvidia is the stretch call.
Target gap Nvidia traded around $233-$237 in early October, so the $276 target implies a move of roughly 17-18% from there.
SpaceX sits past a long-held pivot, but its listing status is unresolved. Treat all of these as reference points to monitor, not instructions to trade.
Where chart-based calls break down
Clean targets feel reassuring. The structural risks are less tidy:
- Valuation and bubble risk: AI leaders trade on high earnings and sales multiples, and the dot-com, 3D printing and blockchain themes all suffered severe resets.
- Regulatory risk: voluntary accords can foreshadow binding rules, and shifts in administration, Congress or the EU and UK regimes could affect business models.
- Concentration: AI indexes and ETFs lean on Nvidia, Microsoft, Alphabet, Meta, Amazon and Apple, so one shock spreads widely.
- Limits of chart tools: the SEC, FINRA and academic work all caution against treating patterns as reliable predictors.
- Behavioural risk: precise targets encourage overconfidence, oversized positions and leverage.
Edge decay Patterns lose their edge once widely known, and data-snooping can make past results look better than they were.
A precise number can make a speculative call feel certain. Size positions and set exits for the case where the level fails, and weigh fundamentals above any single line. This is educational analysis, not personalised advice.
Readers interested in the valuation question can read our deep-dive into AI stock bubble risk, which compares today’s multiples with the dot-com peak.
What the levels can and cannot tell you from here
Nvidia’s rally is documented, its cause is unproven, and the analyst’s levels work best as monitoring tools rather than predictions.
Before drawing conclusions at any named level, look for confirmation: closes beyond it, supporting volume and a successful retest. The variables that will matter more are upcoming earnings, AI capital spending plans and any move from voluntary accord to binding rules.
Past performance does not guarantee future results, and these statements are speculative and subject to change based on market developments. This article is for informational purposes only and should not be considered financial advice. Investors should conduct their own research and consult with financial professionals before making investment decisions.