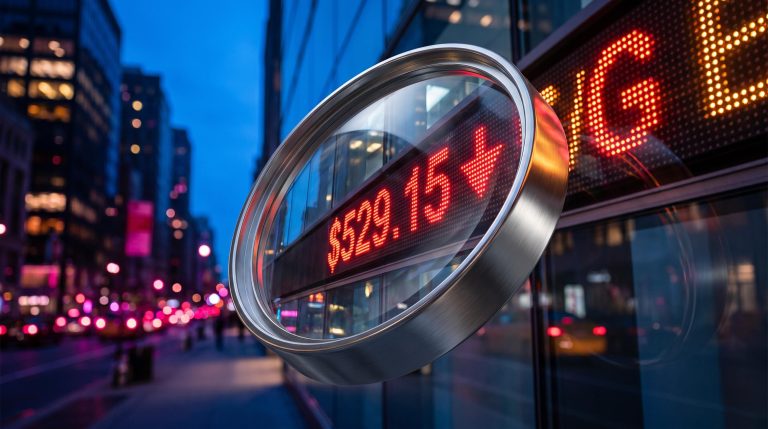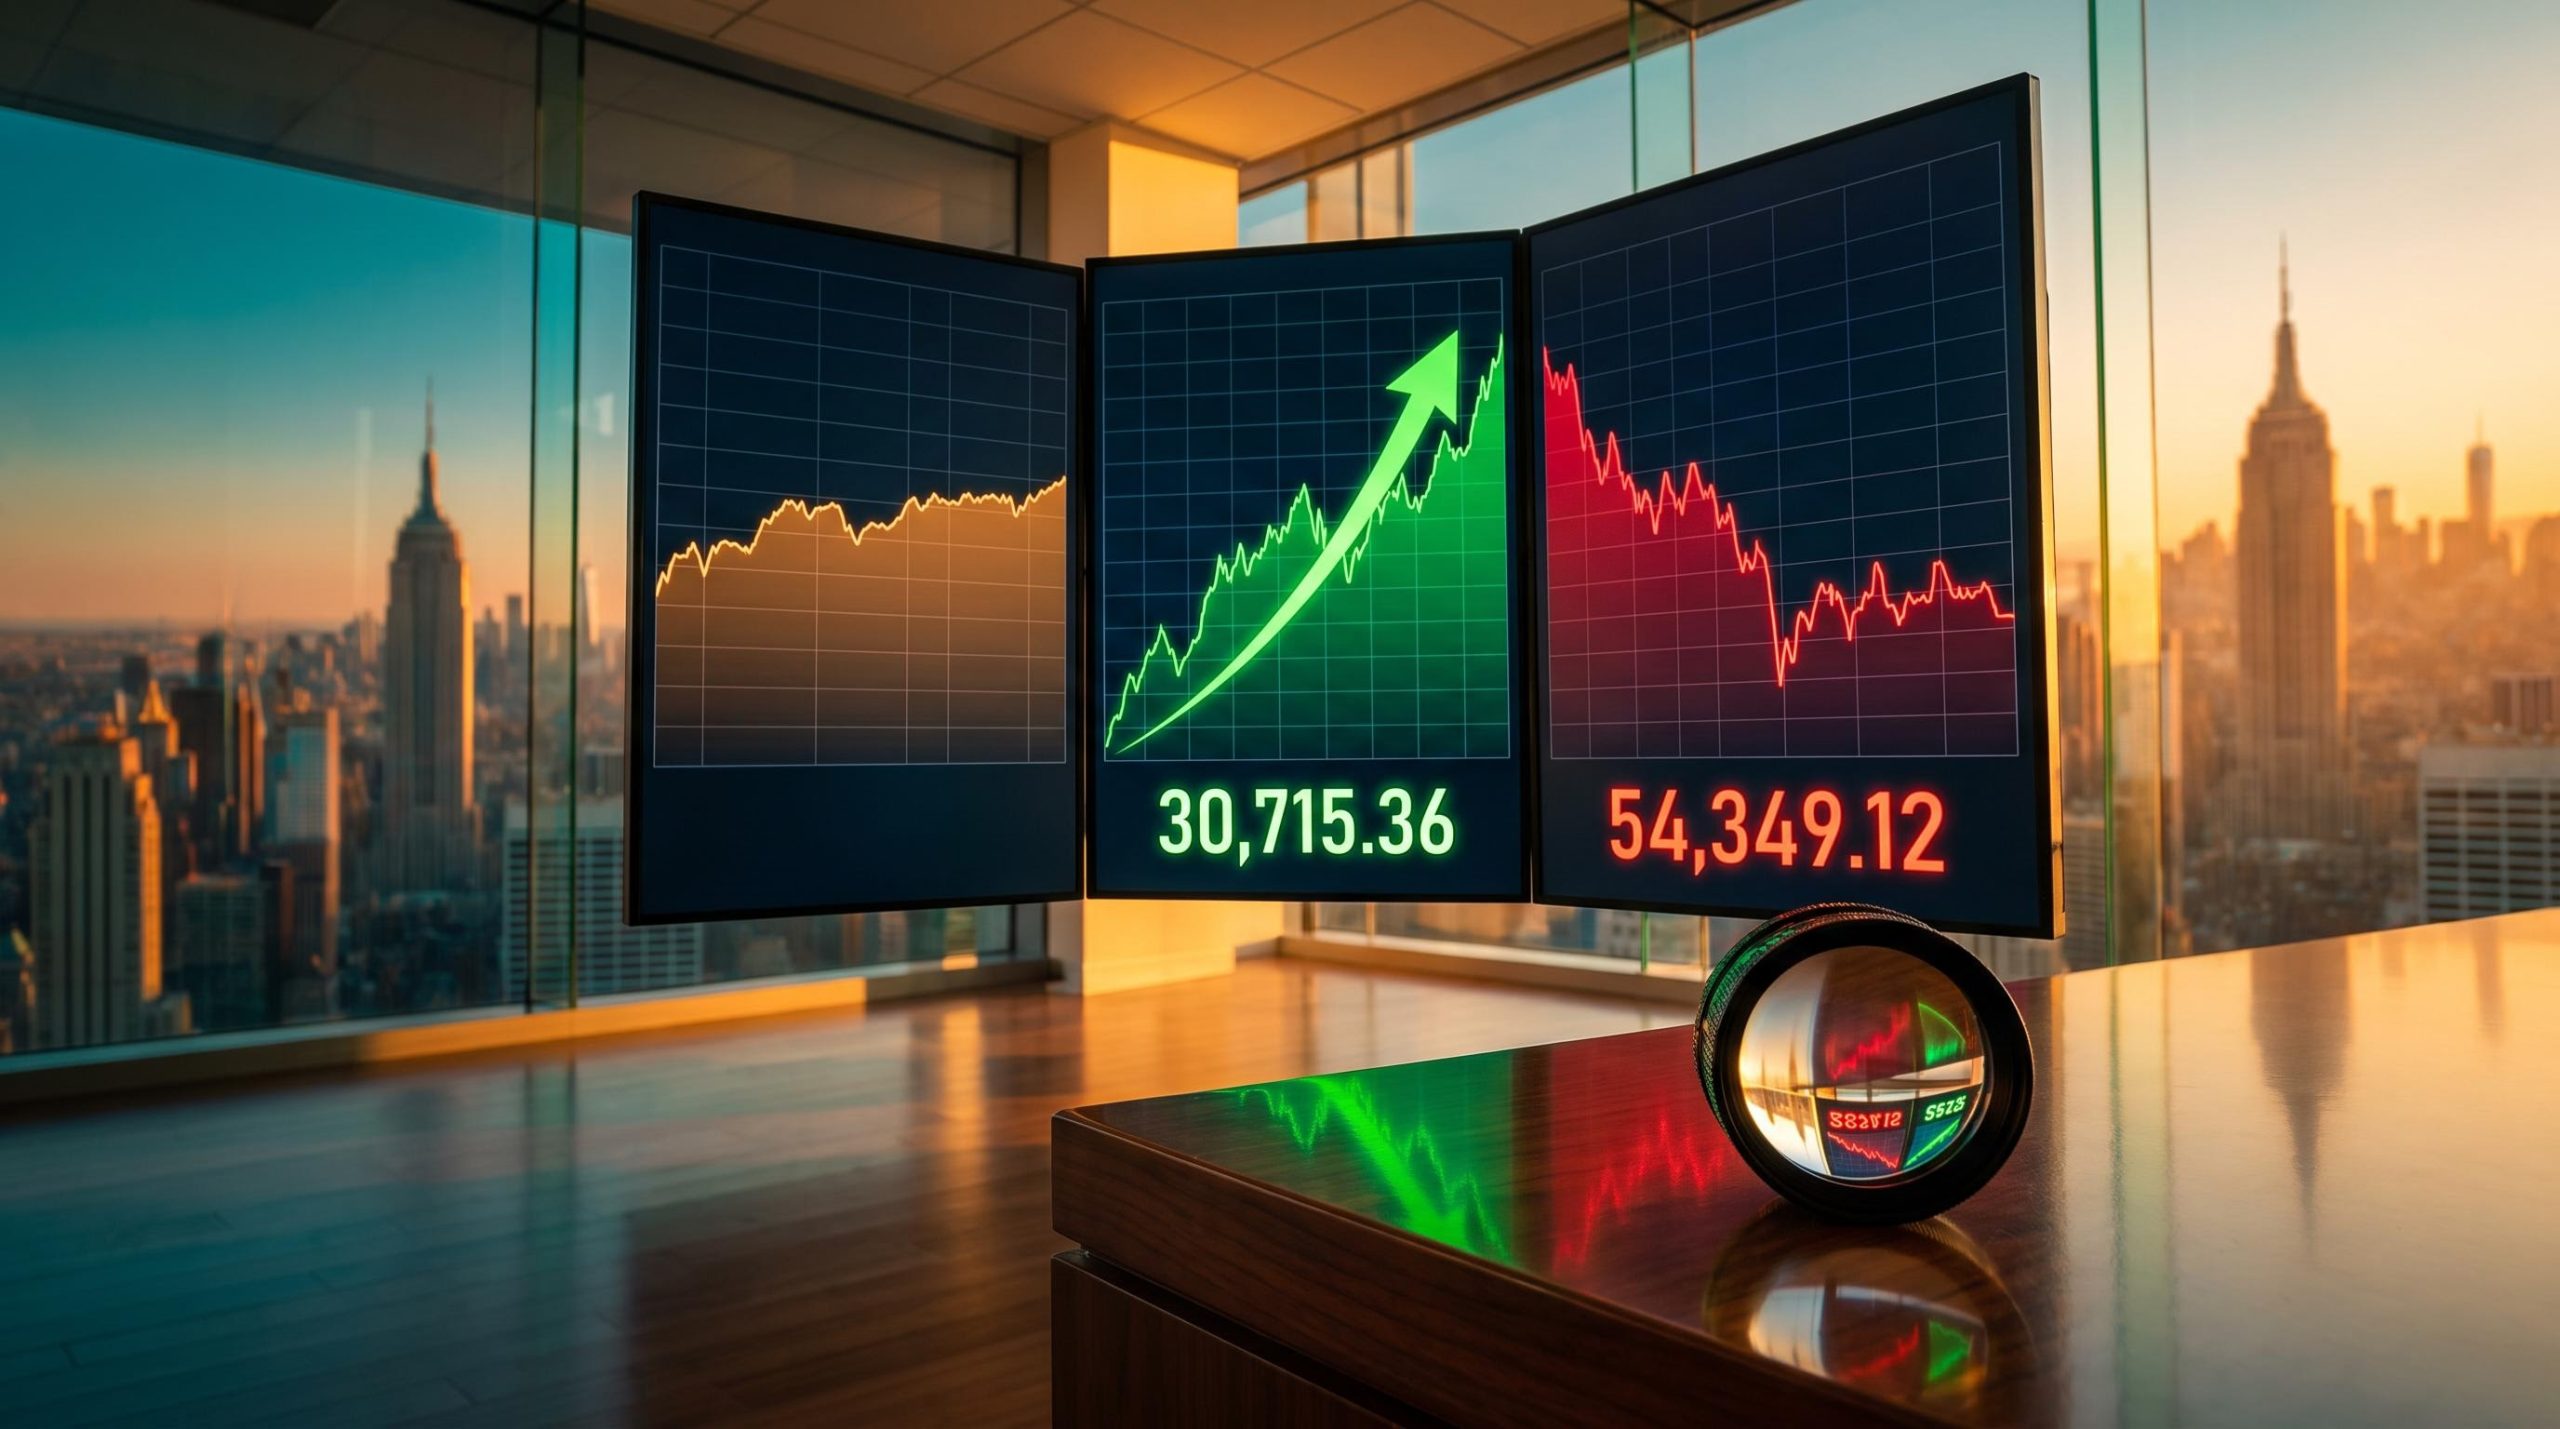
The S&P 500 closed at 7,724.38 and the Nasdaq-100 at 30,715.36 on 5 October 2026, while the Dow Jones Industrial Average sits roughly 6% below its 5 August record close of 54,349.12. Most readers glance at “the market” and average that split away, which hides the most useful signal in this year’s stock market forecast for 2026.
The question hanging over the rest of the year is which index proves right. One trader argues a genuine bear market is unlikely until the Anthropic and OpenAI IPOs resolve and the 3 November midterm elections pass.
Here is a working method for reading index divergence and sizing event risk, plus an honest view of where that argument is strong and where it is thin.
Why do the Nasdaq, S&P 500 and Dow move differently?
Many investors assume the three indices are interchangeable. They are not, and their construction makes a split predictable rather than alarming.
The Nasdaq-100 leans toward technology, communication services and AI-linked growth names. The Dow is price-weighted, meaning higher-priced shares carry more influence, and tilts toward industrials, financials, healthcare and consumer staples. The S&P 500 is cap-weighted, meaning the largest companies count most, and blends the two.
Because the Dow is price-weighted, a $10 move in one high-priced component can swing the index by nearly 59 points, which helps explain why its lag since August looks more dramatic than the broader market’s behaviour.
Interest rates widen the gap. Growth stocks are valued on earnings far in the future, so they react more to changes in discount rates; stable or falling rates tend to favour them, while rising rates often weigh on them and can suit dividend-rich Dow constituents.
| Index | Weighting method | Sector tilt | Rate sensitivity | Latest level cited |
|---|---|---|---|---|
| Nasdaq-100 | Market-cap | Tech, communication services, AI growth | Higher | **30,715.36** (5 Oct) |
| S&P 500 | Market-cap | Broad blend | Moderate | **7,724.38** (5 Oct) |
| Dow Jones Industrial Average | Price-weighted | Industrials, financials, healthcare, staples | Lower | **50,933.60** (2 Oct) |
AI-driven gains are concentrated in a handful of very large companies, which lifts the Nasdaq-100 more than the Dow. The Nasdaq-100 is up 22.97% year-to-date as of 5 October; S&P 500 and Dow year-to-date figures were not located.
If you watch only one index, you may misjudge how narrow or broad this rally is. Check composition before reading any headline level as “the market.”
What Dow Theory says about non-confirmation
Under Dow Theory, one major index making new highs while another fails to confirm is read as a breadth warning, a sign the rally may be losing participants. The Dow closed at 50,933.60 on 2 October, about 3,400 points below its August peak.
The counterpoint matters. Divergences can persist for months, driven by sector rotation and earnings cycles, without a bear market following.
When big ASX news breaks, our subscribers know first
What the three futures charts are signalling right now
The Tasty Live host and panel, whose technical read is not market consensus, ranked the three charts by strength. The split emerges clearly from that order.
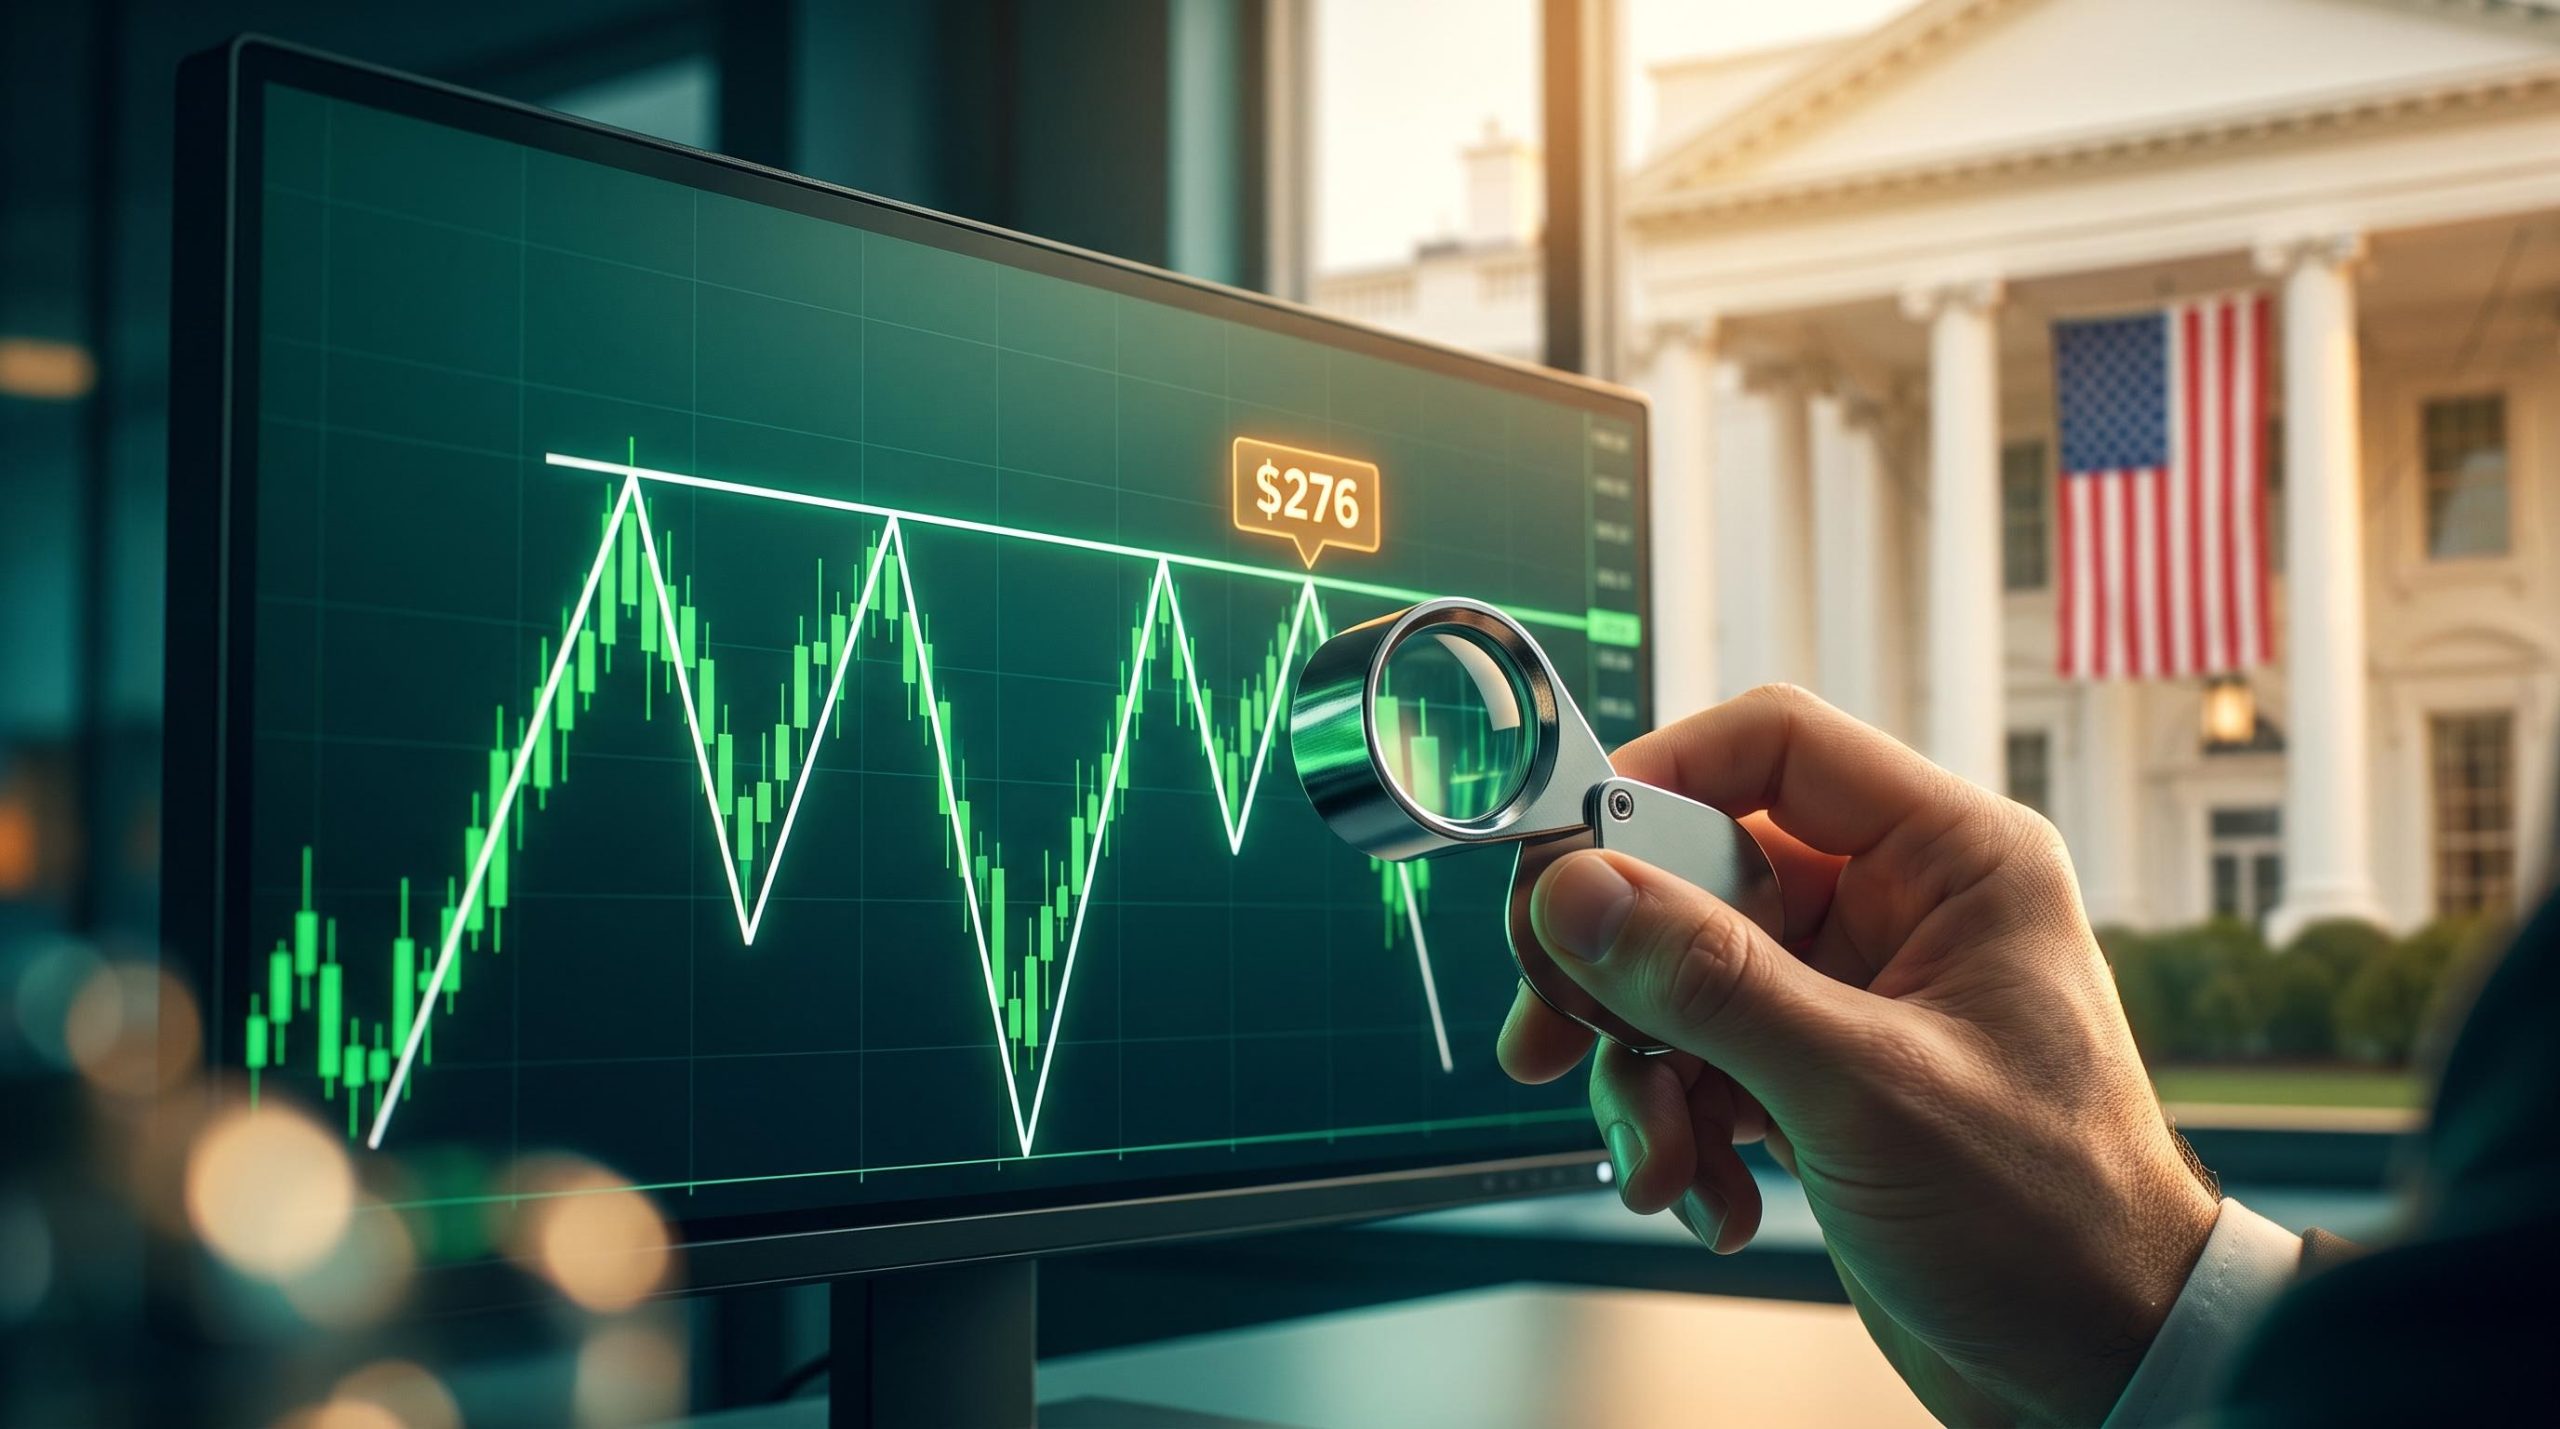
Nasdaq-100 futures (NQ) look strongest: no overhead supply (no trapped sellers above), a fifth consecutive up bar, and a basing pattern since early June. A break below the breakout level or Friday’s low would signal trouble, and that had not happened.
S&P futures (ES) sit near highs but need more momentum. Clearing recent highs could form another continuation pattern, though that takes effort. Dow futures (YM) have behaved like a bear market since 5 August, disconnected from the other two.
| Futures contract | Technical posture | Bullish confirmation | Warning signal |
|---|---|---|---|
| NQ (Nasdaq-100) | Strongest, basing since early June | Fifth consecutive up bar holds | Break below breakout level or Friday’s low |
| ES (S&P 500) | Near highs, needs momentum | Push above recent highs | Failure to gain momentum |
| YM (Dow) | Bear-like since 5 August | Not yet evident | Weakness spreading to other indices |
On the day of the segment, YM was down about 173 points while the S&P was up about 26 and the Nasdaq about 151. The 5 October closes showed the S&P 500 up 0.76% and the Nasdaq-100 up 1.00%.
The host’s point: which signal proves right, the Nasdaq’s strength or the Dow’s weakness, will help define 2026.
The S&P 500 has also closed above Goldman Sachs’ year-end target of 7,600, published on 29 April 2026 and implying a gain of about 6%. For you, the takeaway is that the Nasdaq and the Dow are offering opposite messages, so a position built on one reading is implicitly a bet against the other.
The Goldman Sachs year-end forecast sets the 7,600 S&P 500 target against a roughly 6% projected gain, so the index trading above it means the bank’s original base case has already been met with months to spare.
Could Anthropic and OpenAI IPOs time the next bear market?
The trader’s thesis is specific. No meaningful bear move is likely until both IPOs complete or one is shelved, and a cancelled listing would be a shock given how AI-dependent the market is. The midterms on 3 November are still ahead.
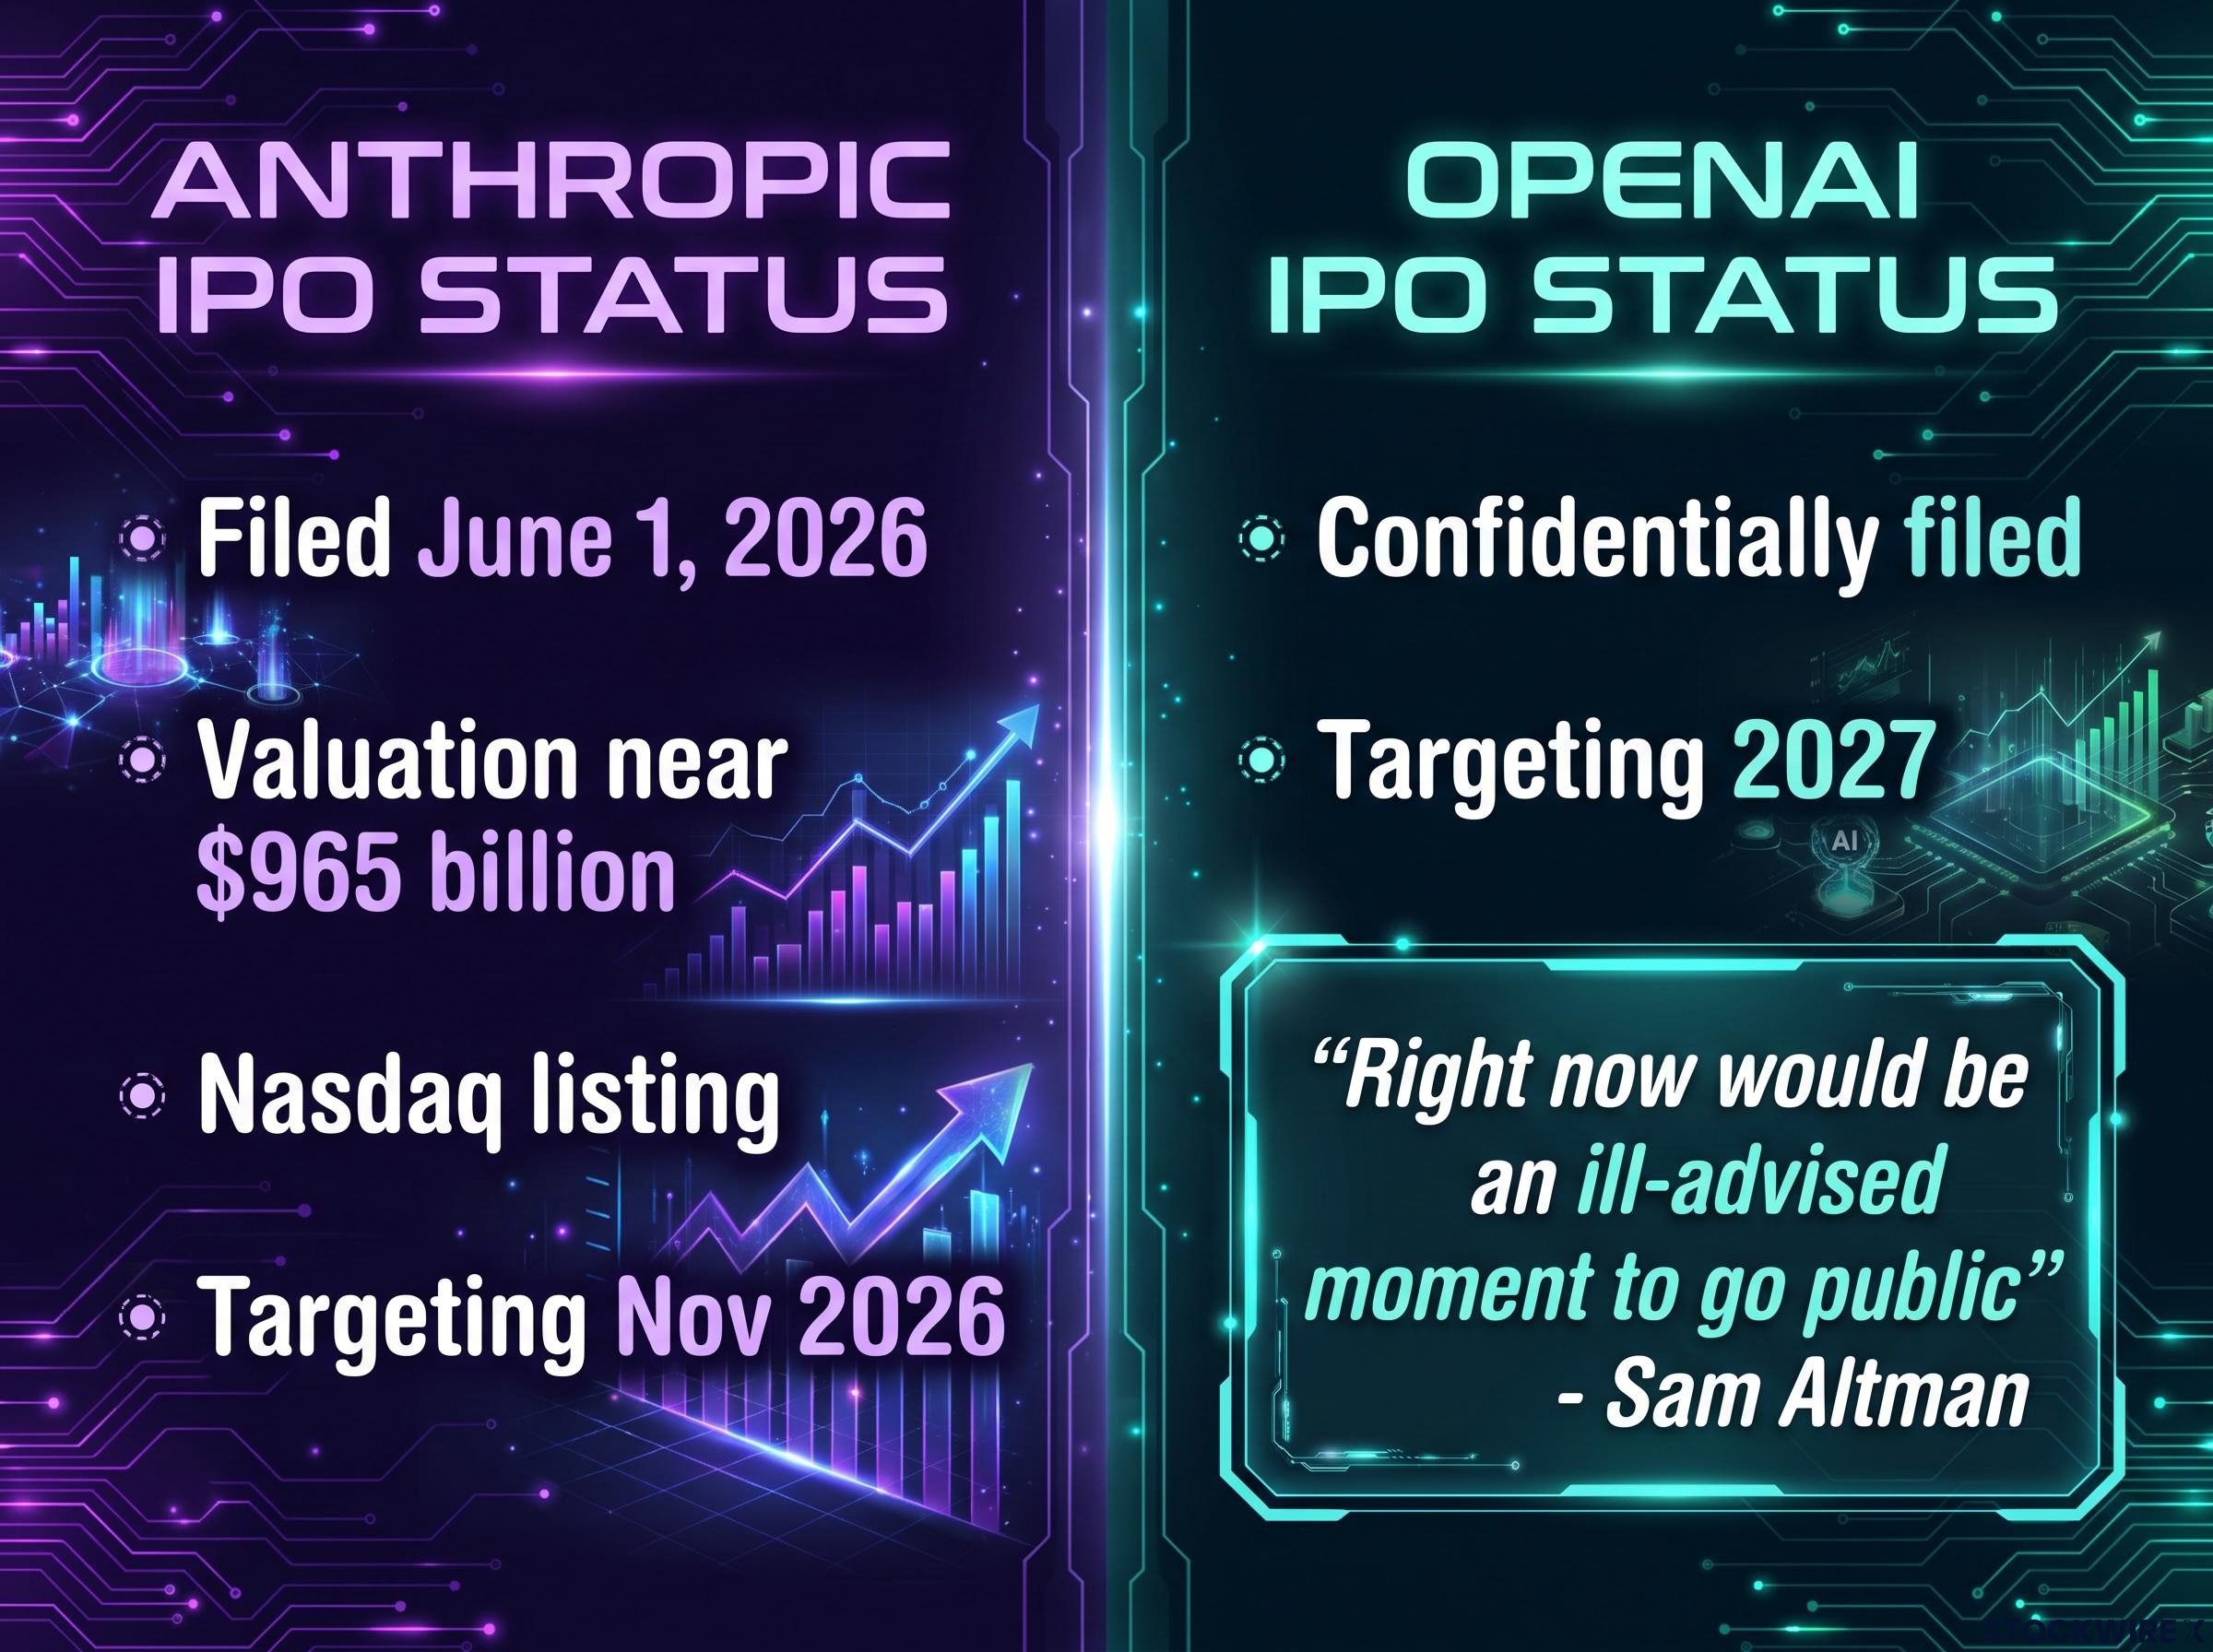
The IPO status is moving. Anthropic confidentially filed a draft Form S-1 with the Securities and Exchange Commission (SEC) on 1 June 2026, chose Nasdaq, and was reported by CNBC to carry a valuation near $965 billion. Bloomberg-sourced reporting says formal marketing slipped to the week of 9 November, with trading targeted before Thanksgiving on 26 November, so the original late-October target has moved.
OpenAI also filed confidentially, but is leaning toward 2027. Chief Executive Sam Altman has said:
“Right now would be an ill-advised moment to go public.”
Chief Financial Officer Sarah Friar said OpenAI “will be a public company in 2027 or sooner.” No named analyst was found arguing these IPOs mark a top; this is one trader’s view.
The case that IPOs mark a top
- Mega-cap listings can absorb investor capital near stretched valuations, draining liquidity.
- A roughly $1 trillion valuation could signal extreme expectations, as in 1999-2000.
- Insider lockup expiries can add supply later.
- Analogies such as Facebook (2012), Uber and Aramco (2019) are not causal proof.
The case that they do not
- The AI build-out may be an early-cycle capital-deepening story.
- Listings could broaden public access to AI leaders.
- Facebook and Aramco show choppy listings need not coincide with a market peak.
This tells you the IPO argument is a timing framework for risk, not a forecast. Treat it as a reason to watch liquidity and sentiment, not a signal to sell on a date.
Investors exploring the deal’s timing risks can read our deep-dive into the Anthropic IPO window, which sets out the four conditions that must align before pricing.
A framework for reading index divergence and event risk through year-end
A repeatable method beats a single number. Apply these six steps this week:
- Cross-index confirmation: check whether highs in one index are confirmed by the others.
- Breadth checks: compare equal-weight with cap-weight indices and the share of stocks above 50-day and 200-day moving averages. Those statistics were not found, so treat these as tools, not findings.
- Sector decomposition: split performance into AI, semiconductors, cyclicals and financials.
- Event-risk overlay: map Fed meetings, the midterms and IPO dates onto price and volatility charts.
- IPO scenario analysis: weigh enthusiasm against supply overhang, and size positions to scenarios.
- Technical thresholds: watch the Nasdaq breakout level, ES highs and whether YM weakness spreads.
Other risks sit alongside: sticky inflation and rates, earnings delivery from AI leaders, AI capex sustainability, and tariffs and chip export controls.
Index concentration is part of the story: with the top 10 S&P 500 stocks holding roughly 38-40% of the index, a green screen can reflect a handful of giants while the typical stock goes nowhere.
Key dates between now and year-end
| Date or window | Event | What to watch |
|---|---|---|
| **3 November 2026** | US midterm elections | Policy uncertainty on taxes, regulation, spending |
| Week of **9 November** | Anthropic formal marketing | Demand and valuation signals |
| Before **26 November** | Anthropic trading targeted | Liquidity and sentiment in AI names |
| Remaining 2026 | Fed meetings | Rate path and inflation |
| 2027 | OpenAI listing likely | Timing updates |
Midterm seasonality is descriptive, not deterministic. Historically, the 12 months after midterms have tended to bring positive average S&P 500 returns, with volatility into the vote, though no cycle-specific statistics were found. For you, the point is to size positions to scenarios and dates, since no single event mechanically triggers a bear market.
What the split screen does and does not tell you about the rest of 2026
The Nasdaq-100 is strongest, the S&P 500 sits above Goldman’s 7,600 target, and the Dow lags well below its August record. Event risk is real, but it is not a mechanical trigger.
The divergence is information about breadth and leadership, not a verdict. Your stance should change if one of three things happens: the Nasdaq breakout level fails, ES clears its highs, or YM’s weakness spreads.
This article is for informational purposes only and should not be considered financial advice. Investors should conduct their own research and consult with financial professionals before making investment decisions. Past performance does not guarantee future results, and these statements are speculative and subject to change based on market developments.