
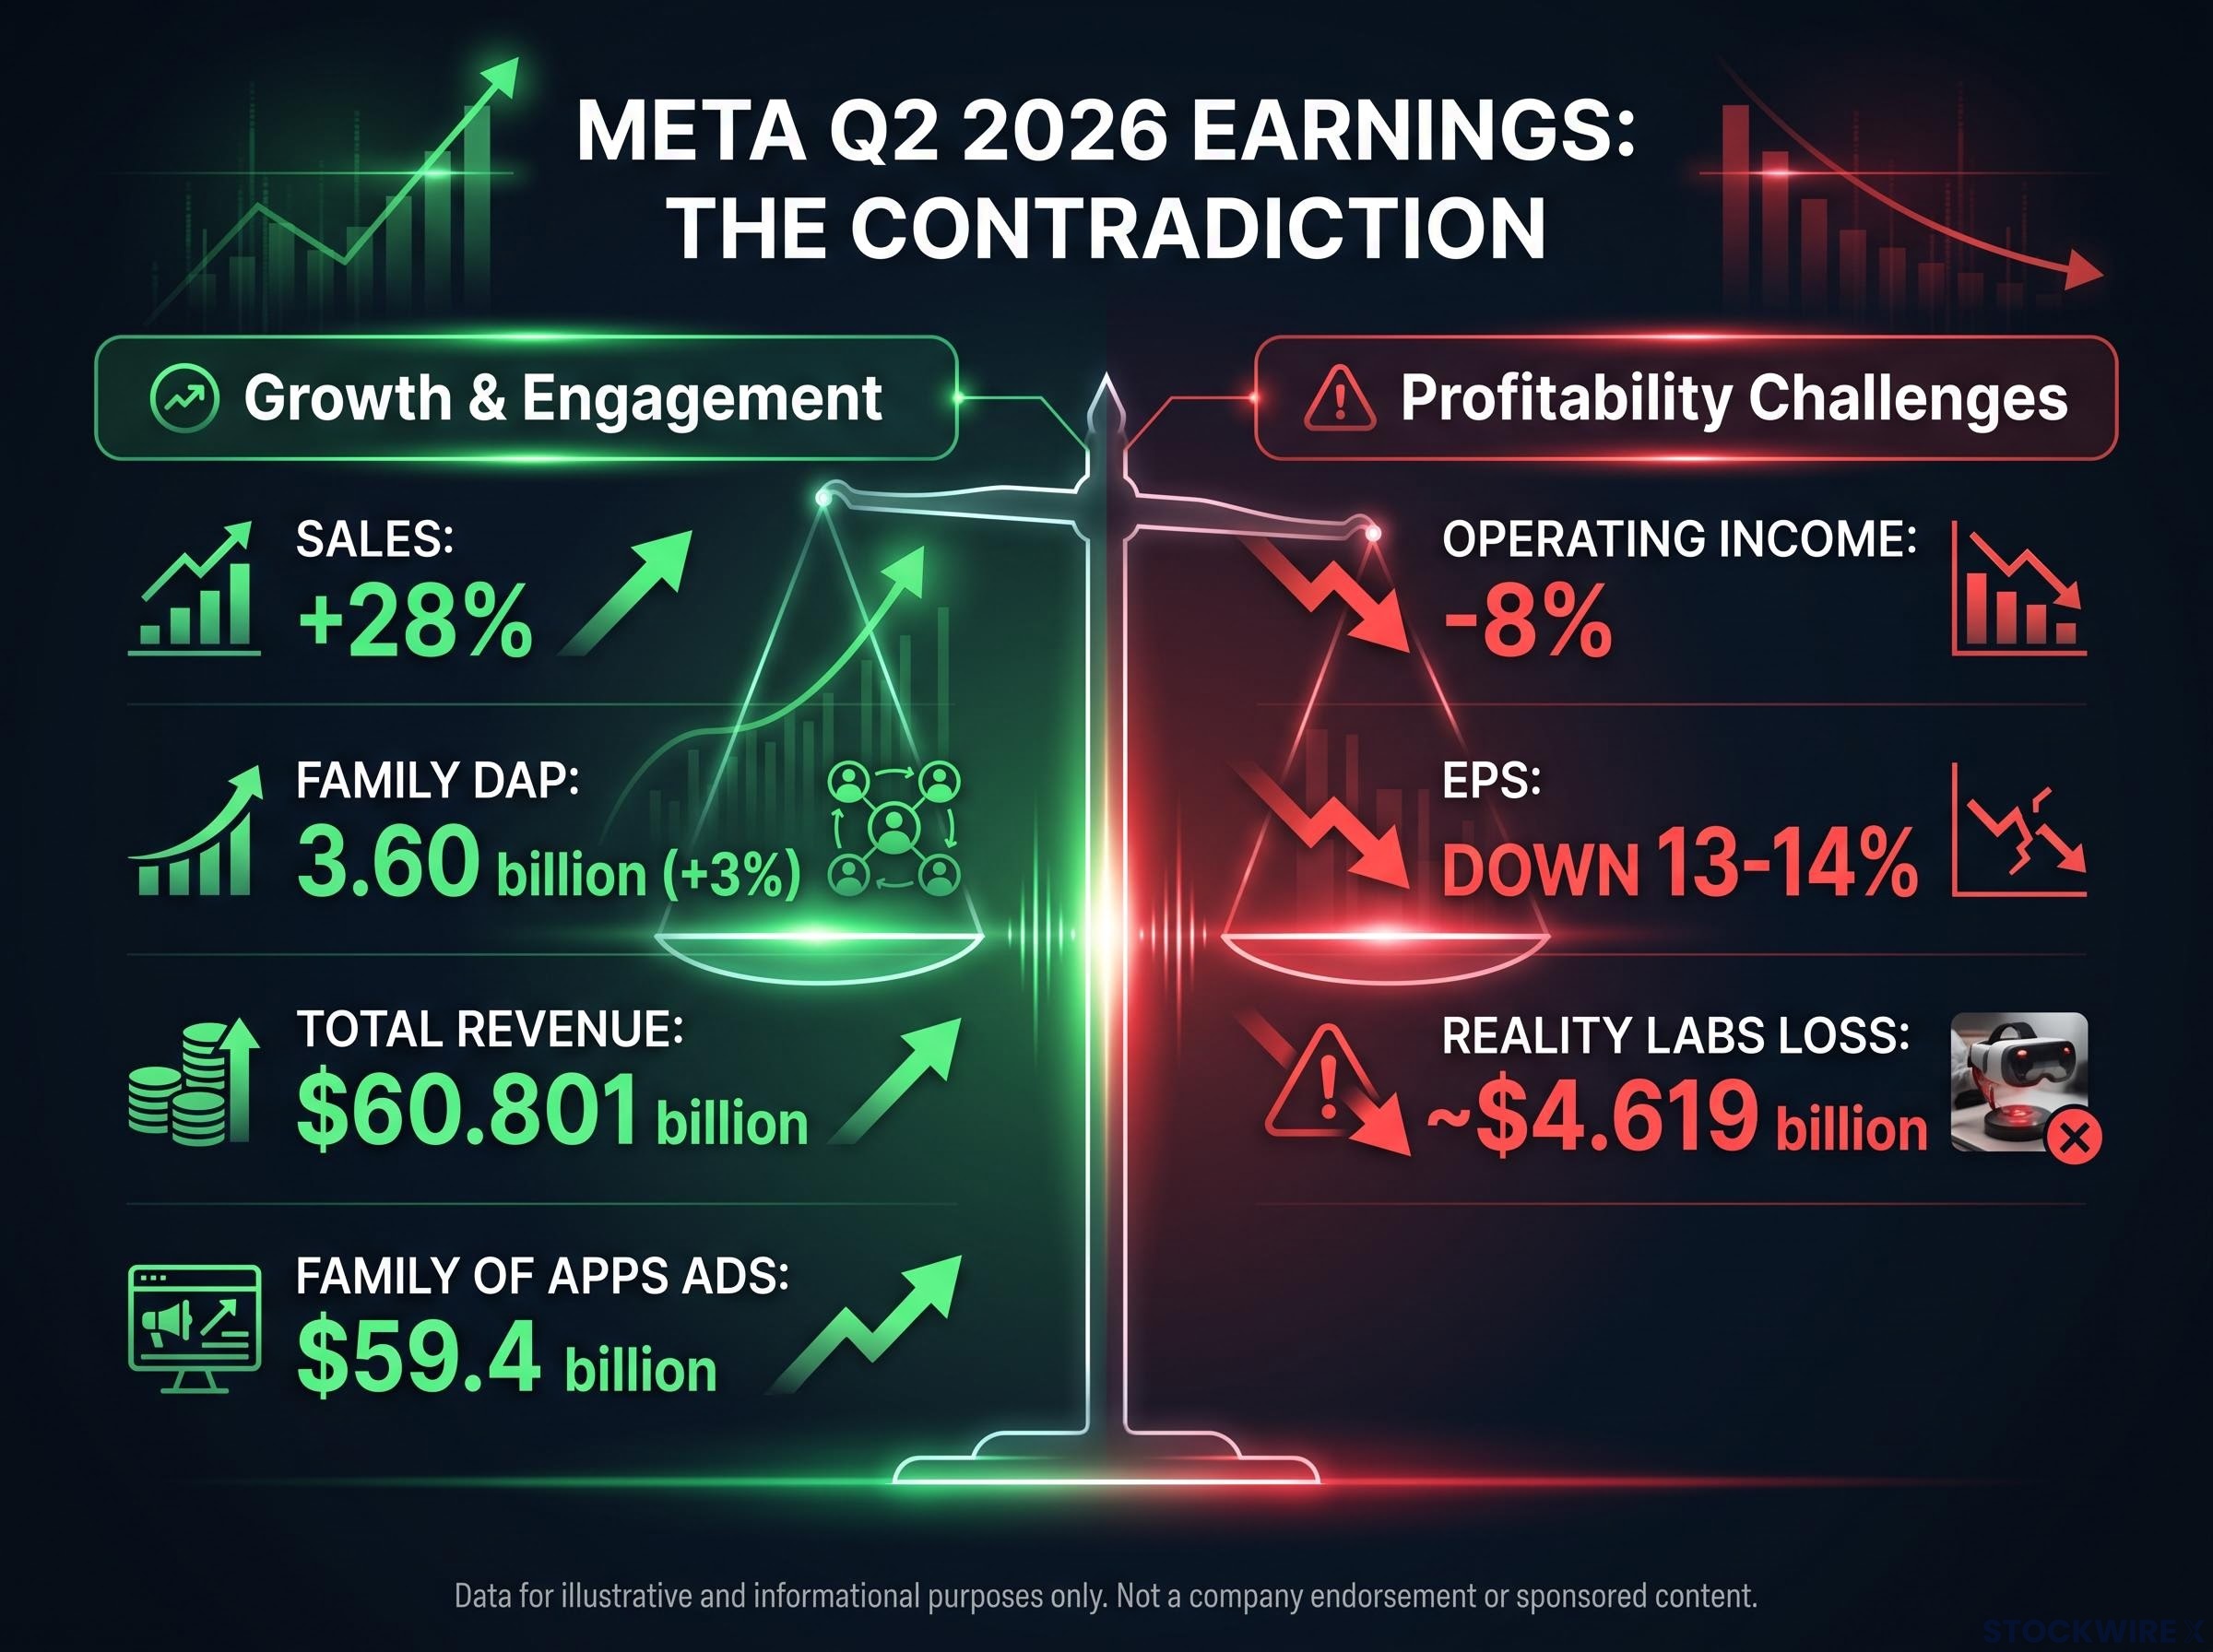
Meta’s second quarter looked like an easy call on revenue: sales rose 28%. Yet operating income fell 8%, earnings per share (EPS) dropped roughly 13-14%, and the shares slid about 9.6% after hours to $529.15. That contradiction is why any Meta Platforms investment decision deserves more than a glance at the headline.
About 43% of the world uses at least one Meta app, yet investors can see almost nothing at the app level. Family daily active people (DAP), the count of unique people using at least one app each day, reached 3.60 billion, up just 3%. With audience growth slowing, the case rests on earning more from each user.
This piece gives you a framework for weighing Meta’s ad levers, its disclosure gaps, WhatsApp’s unproven revenue and the Muse AI agent against the current valuation. Muse and valuation figures are as of early October 2026 and may be dated.
How does Meta actually make money, and what can investors not see?
The engine is simple. Nearly all revenue is advertising, targeted using extensive personal data, and reported in two segments: Family of Apps and Reality Labs. In Q2 2026, revenue hit $60.801 billion, with Family of Apps ad revenue at $59.4 billion and a Reality Labs operating loss of about $4.619 billion.
Then the inspection begins, and it runs out quickly. Meta gives no per-app metrics, no user counts by region and no time-spent data, so the company works like a black box. WhatsApp sits inside an “other” revenue category.
Geography makes this costly. Ads aimed at developed markets are worth far more than those in places like India, yet Meta shows revenue by region without showing users by region.
- Disclosed: total revenue, segment results, aggregate DAP, impressions and average ad price growth.
- Not disclosed: per-app users, regional user splits, time spent, and revenue or capital intensity by app.
| Metric | Disclosed? | Why it matters |
|---|---|---|
| Family DAP | Yes, aggregate only | Hides which apps drive growth |
| Users by region | No | Ad values differ sharply by market |
| Time spent per user | No | Engagement drives impressions |
| WhatsApp revenue | No | Monetisation cannot be modelled |
Because you cannot separate feed, Reels and messaging economics, any confident valuation embeds assumptions you cannot verify. Demand a larger margin of safety.
The 2022 stall as a stress test
In 2022, revenue stalled for the first time since the company listed. Apple’s tracking changes, TikTok’s pull on users, macroeconomic pressure, currency effects and the loss of Russian business all landed together.
The episode showed how exposed Meta is to advertiser budgets, a dependence that remains today.
A peer-reviewed Management Science study quantified how Apple’s App Tracking Transparency changes cut click-through rates on Meta ads, which shows why the 2022 stall exposed such a heavy dependence on targeting data.
When big ASX news breaks, our subscribers know first
With user growth slowing, which ad levers are left?
Growth comes from three levers: more users, more ads, or a higher price per ad. Start with users. DAP rose only 3%, and new users likely come from lower-value emerging markets.
Impressions are next. They rose 14% in Q2 2026, but there is a likely ceiling before the user experience suffers.
That leaves price, up 12%. Asia-Pacific prices are not rising because supply is outpacing advertisers’ willingness to pay, so AI relevance has to lift conversion. A Facebook case study cited a return of $4 per $1 of ad spend, the kind of result that justifies higher prices.
| Lever | Q2 2026 signal | Constraint |
|---|---|---|
| Users | DAP +3% | Growth skews to lower-value markets |
| Impressions | +14% | Likely ceiling before user experience suffers |
| Price per ad | +12% | Asia-Pacific supply outpaces demand |
Strategic conclusion Meta needs to raise the value of each impression, not simply the number of impressions.
Impressions grew faster than users, and price rose on top. That tells you growth now leans on ad-ranking machinery rather than audience expansion, so AI spending is part of the revenue case, not just a cost. Management guided Q3 revenue to $61-64 billion while raising expense guidance.
Margin pressure is not new for Meta shares: the capex guidance repricing after Q1 showed the market will sell strong revenue growth when spending guidance rises faster than expected free cash flow.
WhatsApp has 3 billion users but barely any revenue: how big is the gap?
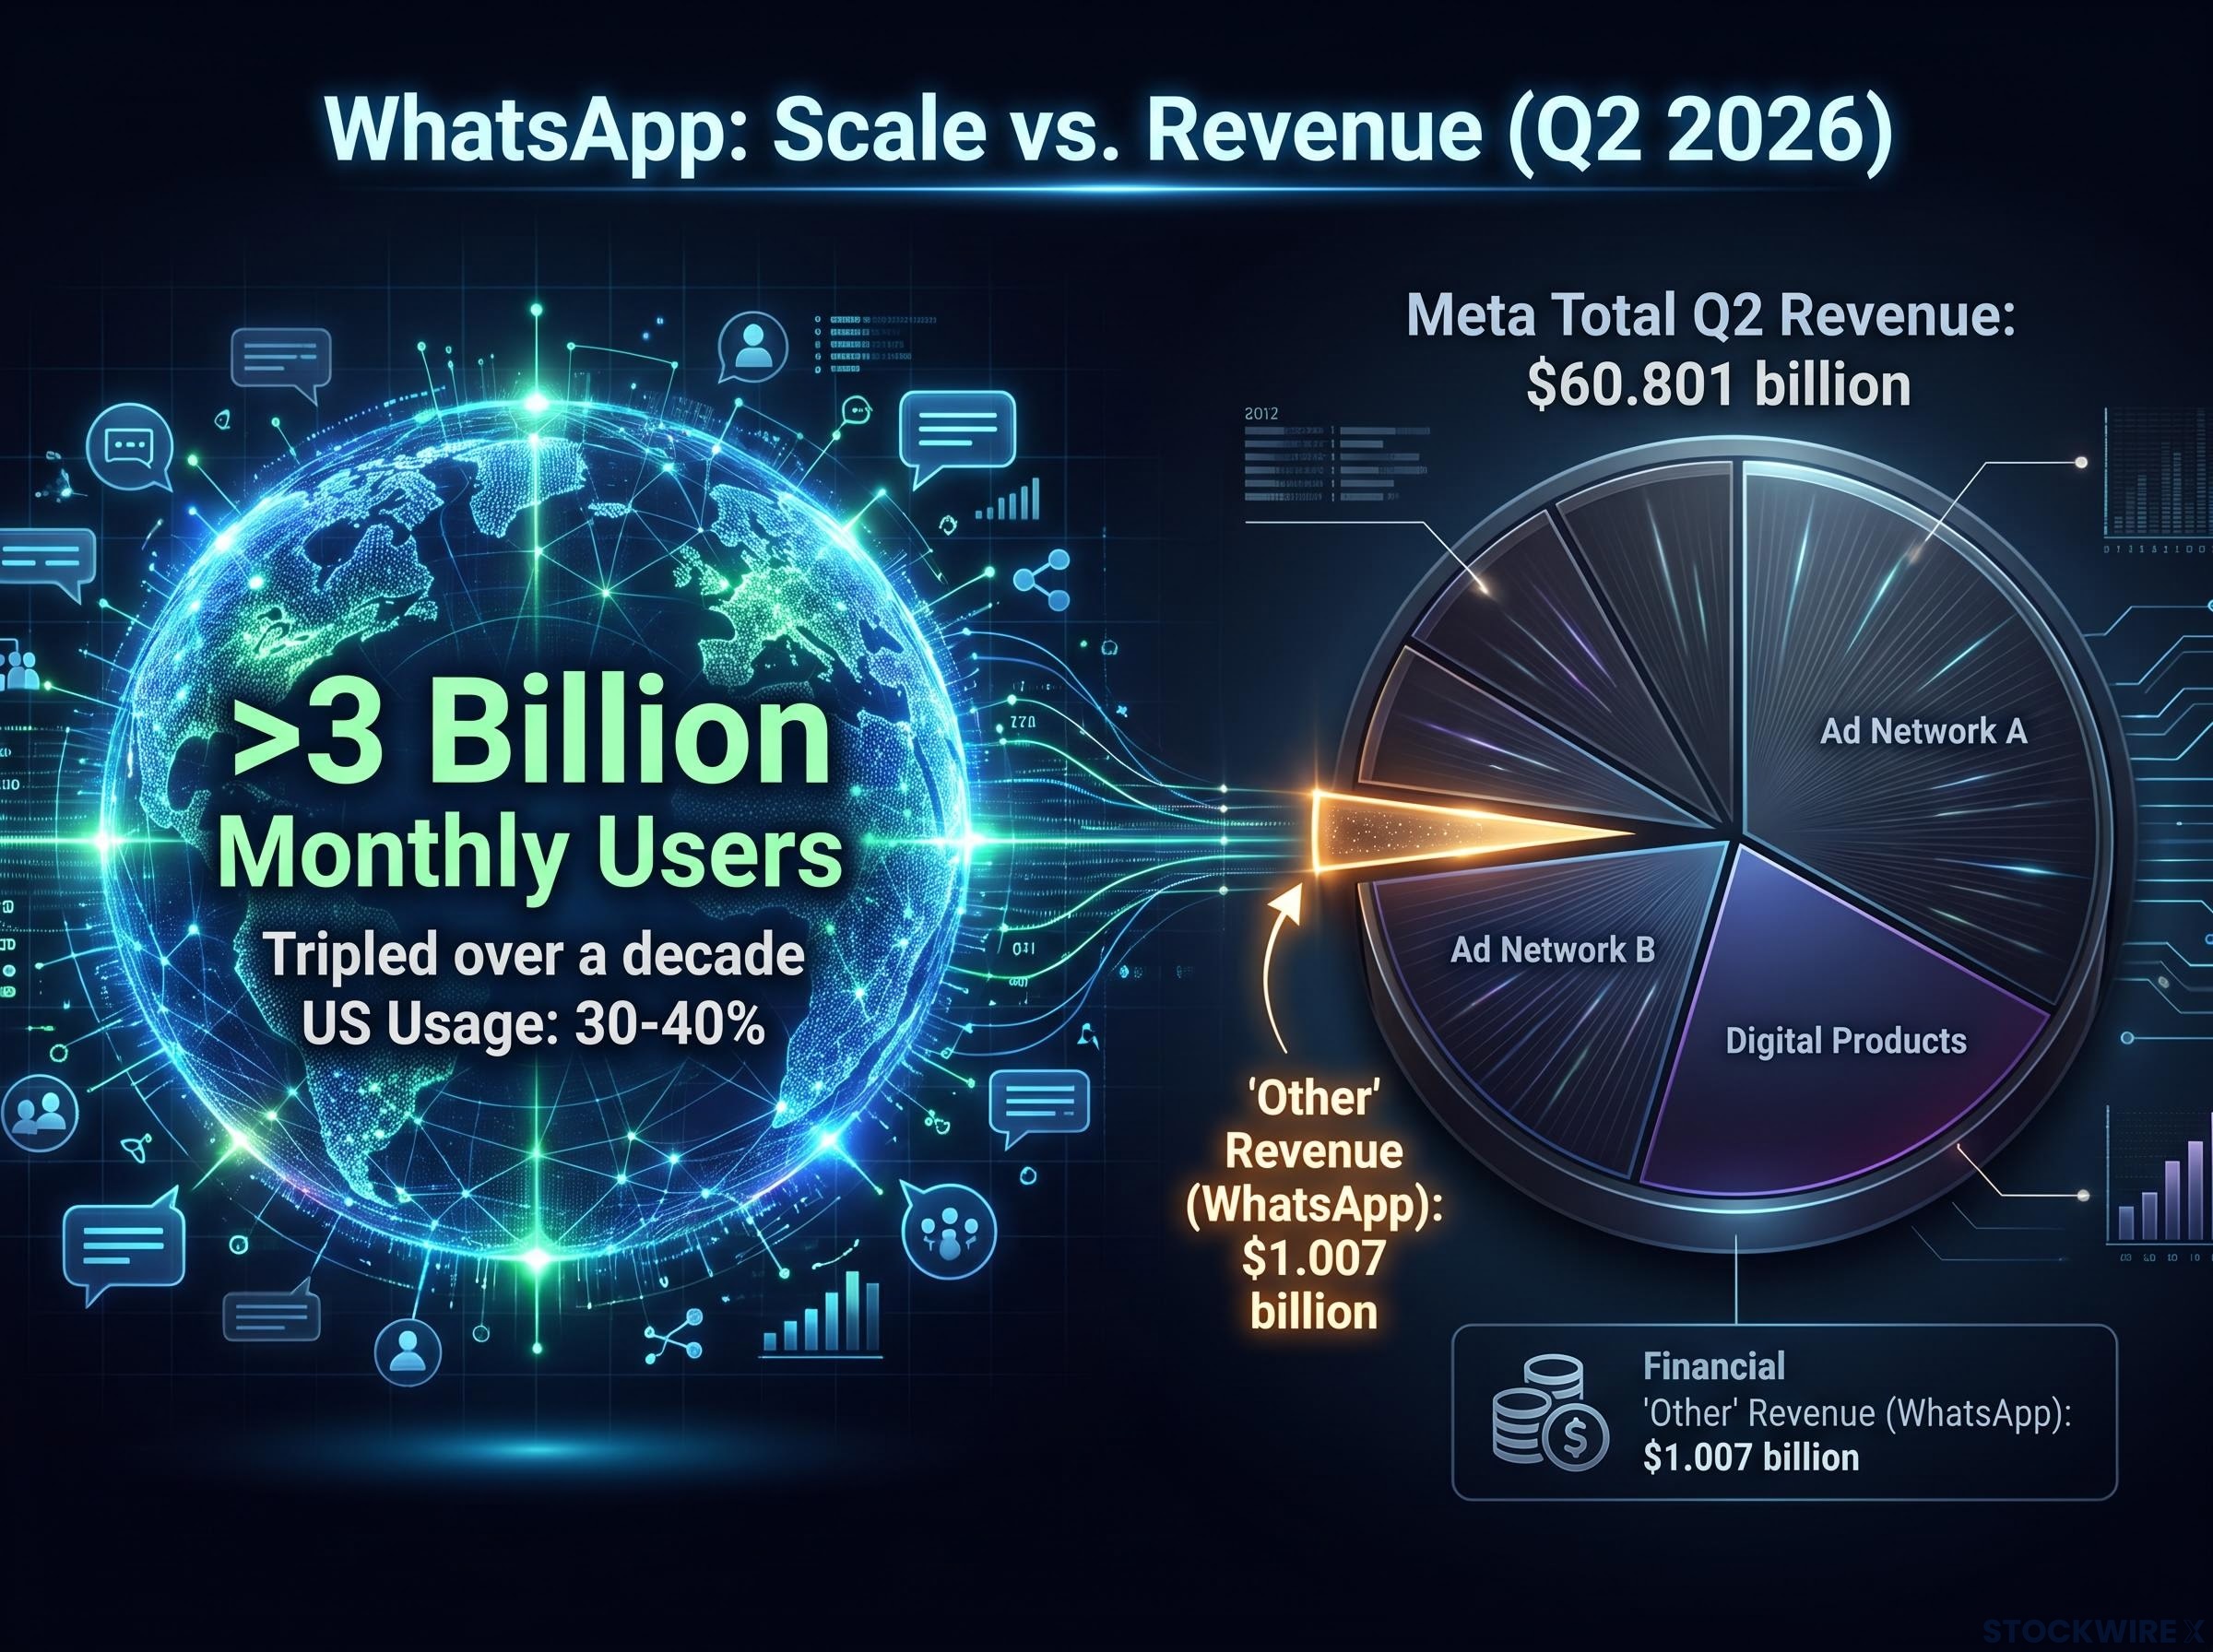
WhatsApp has more than 3 billion monthly users, according to Meta’s Q1 2025 disclosure, and the base tripled over a decade. Meta has not given a newer exact figure.
The revenue line is thin. The “other” category, mostly WhatsApp paid messaging and subscriptions, topped $1.007 billion for the first time in Q2 2026.
Scale versus revenue More than 3 billion users. $1.007 billion in quarterly “other” revenue.
Individual users are never charged, and personal conversations carry no advertising or payment forms. Monetisation targets businesses messaging consumers, and Meta reports no WhatsApp Business, click-to-message or Status run-rates.
The US angle is awkward. Roughly 30-40% of Americans use WhatsApp, low next to India, Indonesia and Brazil, so the largest base sits in lower-ad-value markets.
Precedents suggest paths that avoid charging for basic use:
- WeChat: layered payments, mini-programs and services onto free messaging, implying WhatsApp could build commerce around chat.
- Instagram and Reels: added ads progressively without subscriptions, implying higher-value ad interactions are possible.
- Facebook’s mobile shift: redesigned ad products for the phone feed, implying format redesign can unlock a free base.
The $1.007 billion milestone is real progress but tiny against $60.801 billion. Treat WhatsApp as unpriced optionality, not a forecastable earnings stream.
Muse and the AI question: new revenue line or new liability?
Meta introduced Muse on 8 September 2026, US first, as a personal agent that takes actions such as bookings, flight changes and shopping. It is freemium:
- Free, with a usage limit
- Power tier: $20 per month
- Maximum tier: $100 per month
24/7 Wall St called the plans the first direct consumer revenue line tied to the AI buildout. The market liked it: shares rose about 6% on the news, and one source claimed roughly $200 billion in added value, a figure no other source confirms.
The scale is unproven. Q2 2026 expenses were already lifted by AI infrastructure, with EPS at $6.18, and nobody has shown that subscriptions at these prices can offset that spending.
The Muse subscription math is demanding: at $20 per month, offsetting even one year of AI capex would require hundreds of millions of paying users, far beyond what a US-only launch can reach.
“Public reckoning” CNBC said agents like Muse prompt a “public reckoning” over privacy and safety.
Privacy as an adoption ceiling
Agents need messages, calendars, payments and logins. TechCrunch noted users choose what to opt into, weighing privacy against convenience, and consumers may balk at handing over cards, wallets and logins.
Limited access means limited utility, and limited utility caps monetisation. The same access also invites scrutiny from the Federal Trade Commission (FTC) and state attorneys general.
Because Muse’s revenue impact is undisclosed and adoption hinges on trust, treat it as a narrative catalyst, not a number for your model. These reactions may be dated as of 5 October 2026.
Is Meta’s valuation reasonable? A bull and bear scorecard
Price-to-sales divides a company’s market value by its annual revenue. A lower figure looks cheaper, but it only means something next to growth, margins and capital spending.
One presenter put Meta’s price-to-sales at about 8, against a disruptive-tech catalogue average of about 8.7, with double-digit growth. That is a single-source comparison and may be dated, particularly after the drop to $529.15. No source quantifies forward price-to-earnings or the current distance from the all-time high.
| Factor | Bull view | Bear view |
|---|---|---|
| Margins | High, at 31% operating margin | Compressed, operating income down 8% |
| Platforms | Three global platforms | Feed engagement near saturation in mature markets |
| AI | Lifts monetisation per user | Capex and Reality Labs losses drag |
| Risk | Diversified ad base | Regulatory, privacy and ad-cycle exposure |
The presenter ranked Meta as the most opaque of the Magnificent 7 and preferred Amazon. A multiple near 8 looks reasonable only if margins hold, and they just compressed, so check whether the multiple is cheap or simply reflects weaker earnings quality.
Because Reality Labs losses distort consolidated multiples, a sum-of-parts framework that values Family of Apps separately gives a cleaner read on whether a multiple near 8 is genuinely cheap.
Three checks before buying:
- Confirm the current price-to-sales against recent filings, not the presenter’s figure.
- Test whether the 31% operating margin stabilises as AI costs rise.
- Decide how much, if anything, to credit WhatsApp and Muse.
What the numbers settle, and what they leave open
The verifiable parts are strong: ad demand is high, and impressions and pricing both rose. WhatsApp and Muse remain unpriced because Meta’s disclosure gives you nothing to measure them with.
Track three variables: impression and price trends, the “other” revenue trajectory, and margin and capex guidance. Add Muse adoption and privacy developments.
This article is for informational purposes only and should not be considered financial advice. Investors should conduct their own research and consult with financial professionals before making investment decisions. Past performance does not guarantee future results, and these statements are speculative and subject to change. Recheck Muse and valuation data against current filings.