Meta just reported $64.60 billion in quarterly revenue, up 26% and ahead of what Wall Street expected. In the same quarter, the company burned through more cash than it brought in for the first time in more than a decade. The day after, the Nasdaq had its weakest session in four months.
If the business is growing this fast, why did the market flinch?
The answer sits in a run of warnings that came before the results. Within days, the chief executives of Broadcom, BlackRock, Nvidia and Intel each argued that money, not chips or electricity, may be the tightest limit on the AI buildout. That turns the AI capital crunch into a question of who gets funded and at what price.
That question reaches anyone holding index funds heavy with AI names. Here is a framework for reading capital intensity, free cash flow pressure and market breadth, and for deciding whether this is a crunch or a filter.
What did Meta’s quarter reveal about the cost of the AI buildout?
On the surface, the third quarter of 2026 looked strong. According to Reuters, analysts had expected revenue of roughly $63.3-$63.4 billion. Meta cleared that comfortably.
Then the cash flow statement arrived.
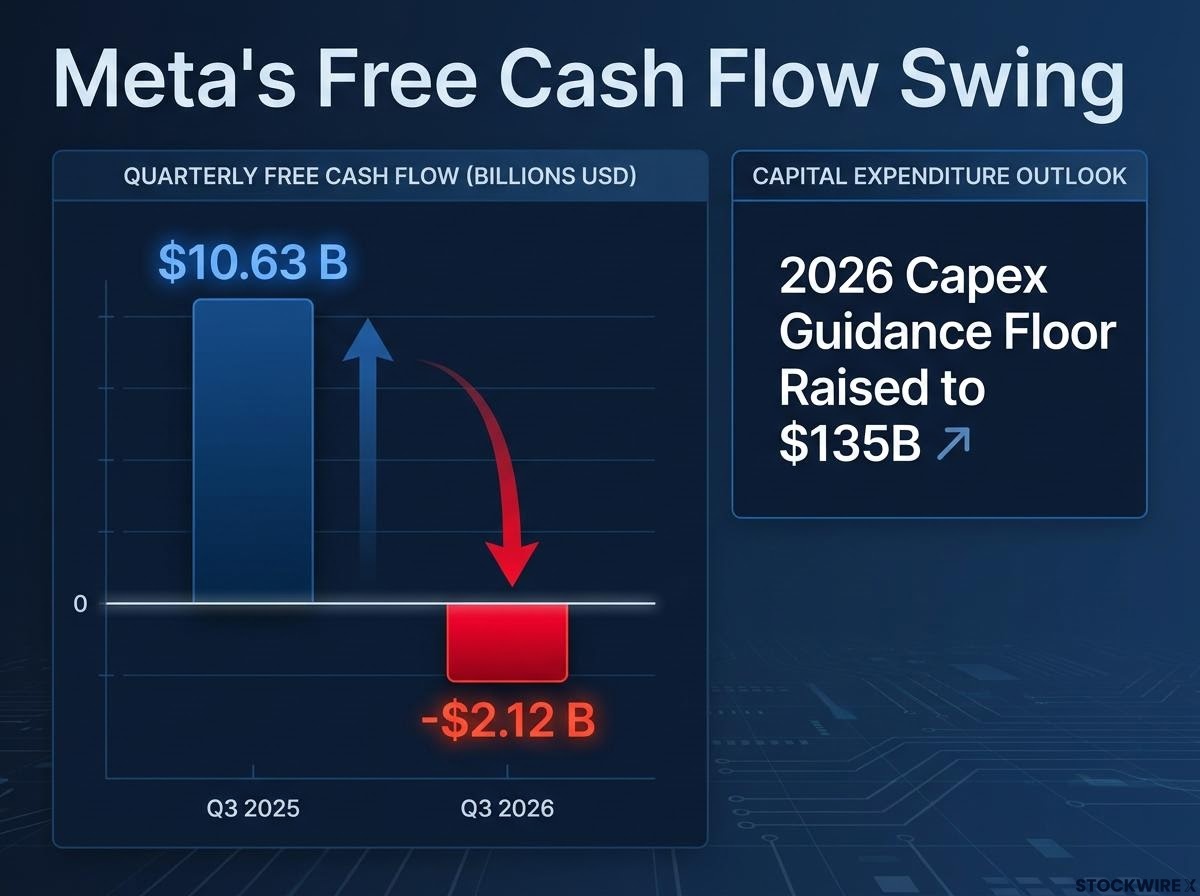
The free cash flow swing Negative $2.12 billion in Q3 2026, versus positive $10.63 billion a year earlier.
Free cash flow is the cash a company has left after paying for its operations and its investment in equipment and buildings. Meta also lifted the bottom of its 2026 capital expenditure guidance, meaning planned spending on physical assets, to $135-$145 billion from $130-$145 billion. Meta itself said fundraising by Alphabet and SpaceX, along with expected raises by Anthropic and OpenAI, was making the funding climate harder.
Free cash flow versus EPS is the comparison that exposed Meta’s quarter: earnings can beat expectations while cash left after capex turns negative, which is why you should check cash conversion before trusting any headline profit figure.
Why a non-voting share class matters
Meta also announced a new security built for raising money:
- One publicly traded, non-voting Class C share for each existing Class A and Class B share
- Mark Zuckerberg’s voting control stays intact
- Stated uses include capital raising, employee pay and acquisitions
- Trading is expected in January 2027
- Reuters reported it could support hundreds of billions of dollars of financing over several years
A company does not build that kind of tool unless it expects to need outside capital for years. Read the quarter as a financing event, not an earnings event. Even a highly profitable company can now consume more capital than it generates, so you should judge AI spenders on cash left after capex rather than on headline earnings.
When big ASX news breaks, our subscribers know first
Capital intensity, free cash flow and breadth: three lenses for reading AI markets
Start with the number on your screen. Yardeni Research projects that Amazon, Alphabet, Meta, Microsoft and Oracle will spend nearly $780 billion on capex in 2026, and more than $1 trillion a year from 2027 through 2030.
FactSet puts fiscal 2026 hyperscaler capex at more than $690 billion, rising above $900 billion by fiscal 2028. The gap between the two likely comes from differences in company definitions, fiscal-year conventions and forecast dates.
Capital intensity is how much a company spends on physical assets relative to the money it makes. When it climbs fast, it eats into free cash flow. When free cash flow shrinks, the company has to borrow or sell shares, and that demand for funding shows up in bond yields and in which stocks the market rewards.
Breadth measures how many stocks take part in a move. You can track it by comparing the standard S&P 500, which is weighted by company size, with the equal-weighted version, where every stock counts the same.
| Lens | What it measures | Signal to watch | Example from this story |
|---|---|---|---|
| Capital intensity | Spending on physical assets relative to earnings | Capex guidance rising faster than revenue | Meta’s capex floor raised to $135B |
| Free cash flow | Cash left after operations and capex | A swing from positive to negative | Meta at -$2.12B versus +$10.63B |
| Market breadth | How many stocks join a move | Size-weighted index diverging from equal-weighted | S&P 500 -1.2%, equal-weighted up |
Together, these lenses separate a company that is investing from one that is borrowing to keep up. The rest of this analysis depends on that distinction.
How did markets price the warning on 22 October?
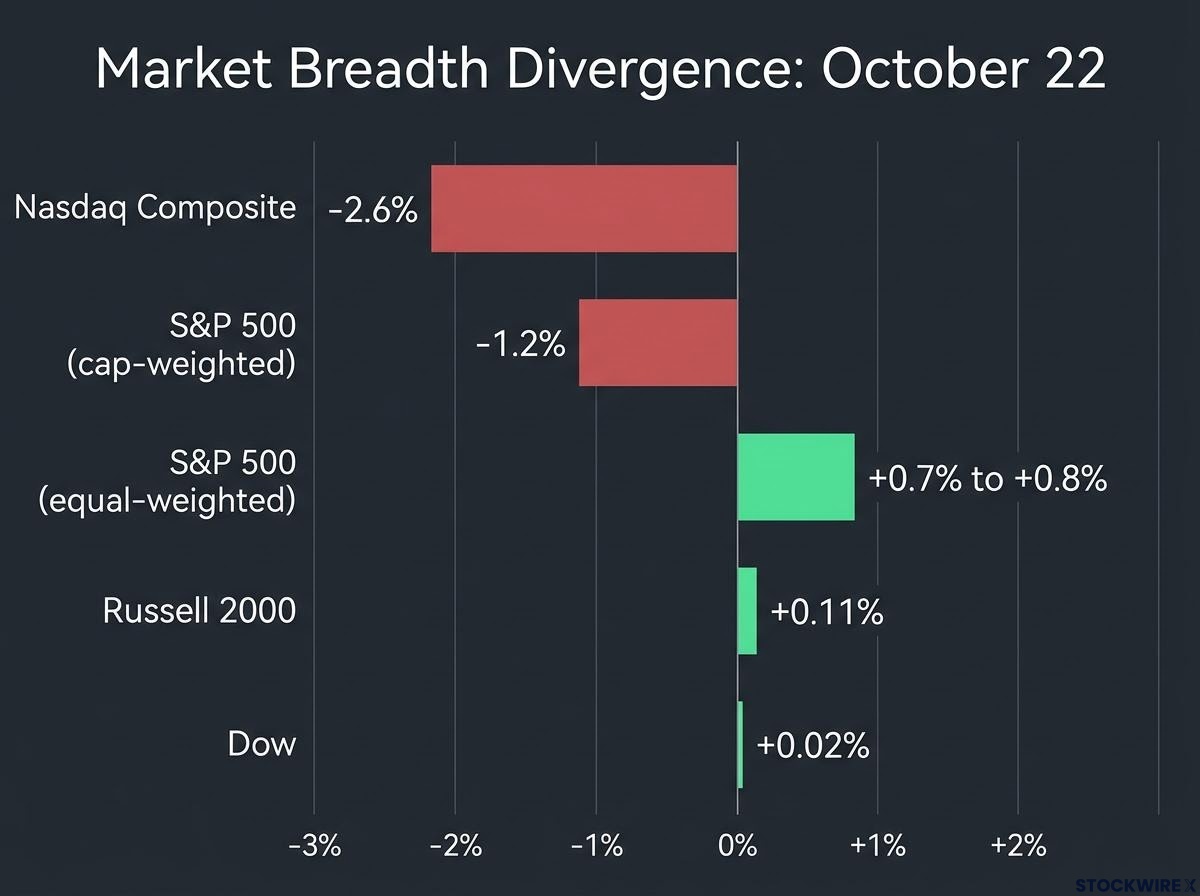
The selling began where you would expect. On Thursday, the Nasdaq Composite fell 2.6%, Nvidia lost about 4%, CoreWeave dropped about 10% and the iShares Semiconductor ETF (SOXX) shed roughly 6.8%.
The rest of the market told a different story. The Dow edged up 0.02% and the Russell 2000 gained 0.11%. While the size-weighted S&P 500 fell 1.2%, its equal-weighted version rose.
| Measure | Move | What it signals |
|---|---|---|
| Nasdaq Composite | -2.6% | Weakest day in four months |
| Nvidia | About -4% | AI leader repriced |
| CoreWeave | About -10% | Leveraged AI infrastructure hit hardest |
| Lam Research | -9% to -11.8% | Chip equipment tied to capex plans |
| S&P 500 (cap-weighted) | -1.2% | Mega-cap concentration sold |
| S&P 500 (equal-weighted) | +0.7% to +0.8% | Average stock gained |
| 10-year Treasury yield | Below 5% | Move toward perceived safety |
Source note: Yahoo Finance and Benzinga put Lam Research’s fall at about 9% to 9.7%, while Investing.com/Yardeni reporting gives 11.8%. Bloomberg and Schwab put the equal-weighted gain at 0.8%; Investing.com reports 0.7%.
Bonds rallied as well. The 10-year yield dropped below 5% for the first time in almost a month, with reports ranging from a close near 4.97% to about 5.02% intraday, and the 2-year fell to 4.64%. Yardeni read the bond move as investors pricing a slower buildout, not collapsing AI demand.
This was rotation, not exit. When the size-weighted index falls while the equal-weighted one rises, the market is repricing AI concentration risk, and a headline drop can hide gains in the average stock you own.
Investors wanting to act on the breadth split can read our dedicated guide to cap-weight versus equal-weight ETFs, which shows how each structure changes your real concentration.
Is capital really running short, or only for some borrowers?
The executives who raised the alarm did not hedge much.
- Hock Tan, Broadcom CEO: Financing could become a bigger obstacle than chips, memory or power (DBS Asia Future Forward Conference, Singapore, 12 October)
- Larry Fink, BlackRock CEO: Sees “genuine shortages of capital” for the first time in roughly 50 years (October remarks)
- Jensen Huang, Nvidia CEO: Neocloud demand is “off the charts”, but capital is scarce (reported 25 October)
- Lip-Bu Tan, Intel CEO: The immediate challenge is capital and its cost, then proving returns (CNBC, 12 October)
Hock Tan, Broadcom CEO “What I think might be the biggest constraint is capital.”
Tan estimated about $200 billion a year goes into generating AI tokens against roughly $150 billion in revenue, and warned some investors are buying “like it’s a casino”.
Who is raising, and how much
Alphabet raised about $85 billion in equity in June. The five largest hyperscalers issued about $159 billion in bonds through early June, 47% more than in all of 2025. SpaceX plans about $40 billion of debt, Anthropic raised about $65 billion in late May and OpenAI is seeking about $30 billion, at a valuation above $1.4 trillion per Reuters or around $1.25 trillion per Bloomberg.
Barclays strategist Venu Krishna counts $346 billion raised by hyperscalers, data-centre vehicles and neoclouds so far in 2026, against $172 billion in 2025. Goldman Sachs projects hyperscaler bond issuance of about $250 billion this year and $400 billion in 2027, all competing with government borrowing for the same pool of money.
Price shows who pays. CoreWeave’s 2032 bonds were reported near a 16% yield, more than three times comparable Treasuries, and stress can feed on itself:
- Higher yields raise borrowing costs
- Weaker shares make equity raising costlier
- Lenders tighten terms
- Construction slows
- Confidence weakens further
That gap between hyperscaler funding and CoreWeave’s yield tells you the crunch works as a sorting mechanism based on credit quality. The balance sheet matters more than the AI label.
Crunch or filter? Weighing Yardeni’s view against the overbuild warning
Yardeni Research makes the optimistic case. In its 25 October note, the firm separated capital scarcity for the industry from capital access for the strongest firms. Meta, Alphabet, Microsoft, Amazon, Oracle and Nvidia should keep access, it argued, while a shakeout trims overinvestment without ending the boom.
The skeptics point back to Tan’s numbers. If token spending outruns token revenue by $50 billion a year, demand for infrastructure can stay high while the underlying economics stay weak. Their sharpest risks are services that fail to cover depreciation and financing costs, GPUs that become obsolete before facility loans are repaid, punitive refinancing for leveraged neoclouds, and strategic overbuilding by firms afraid of falling behind.
GPU useful life assumptions matter here: CoreWeave depreciates chips over six years, the longest among peers, which flatters reported profit if hardware becomes obsolete in two to four years.
| View | Core claim | Who is most exposed | What would confirm it |
|---|---|---|---|
| Filter view (Yardeni) | Tighter money improves allocation | Weaker projects and overextended operators | Hyperscalers keep raising while weak operators cut spending |
| Overbuild view (skeptics) | Spending outruns returns | Leveraged neoclouds and late-cycle lenders | Low utilisation and failed refinancings |
What the telecom buildout teaches
The fibre boom followed a recognisable sequence. Firms built ahead of demand, financing conditions exposed weak economics, and many operators and their backers failed. The network itself survived and later proved valuable.
Both camps can be right at once. Being correct about AI demand does not make every AI investment profitable, so check utilisation, financing duration, hardware lifespan and refinancing ability, not just the technology thesis.
Past performance does not guarantee future results. Forecasts cited here are subject to market conditions and may change.
What to watch as the funding test plays out
Meta’s quarter showed what capital intensity does to cash. The 22 October breadth split showed the market repricing concentration rather than abandoning stocks. The funding data showed scarcity landing unevenly.
Four indicators will show which reading wins:
- Hyperscaler free cash flow after capex, quarter by quarter
- Neocloud bond yields, with CoreWeave as the reference point
- The gap between equal-weighted and size-weighted S&P 500 returns
- The timing and reception of Anthropic’s potential IPO, OpenAI’s round and Meta’s Class C trading from January 2027
AI spending looks set to continue. The decision in front of you is about who can keep financing it at an acceptable cost, and whether your portfolio leans toward those funded from strength or those reliant on open markets.
This article is for informational purposes only and should not be considered financial advice. Investors should conduct their own research and consult with financial professionals before making investment decisions.