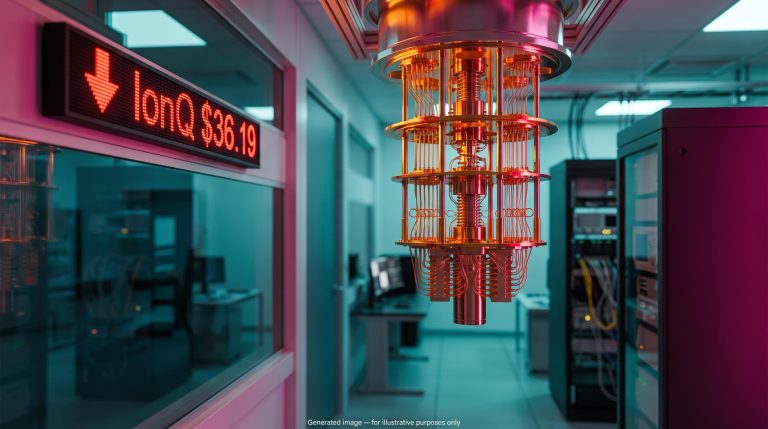
The 10-year Treasury yield is sitting near 5.2%, its first sustained break above 5% since 2007. The S&P 500 is still trading close to record highs. In 2022, a far smaller climb in rates arrived alongside a 30% fall in stocks, so the calm in the AI bubble stock market debate deserves a harder look.
Most commentary blames oil. The stronger candidate is artificial intelligence spending. Microsoft, Alphabet, Amazon and Meta are on track to spend roughly $720-745 billion on capital projects in 2026, and that money has to be financed somewhere.
If you assume high rates and AI optimism can coexist indefinitely, you risk being caught holding concentrated exposure when the financing logic turns.
Here is a yield-level framework for judging when rates start to matter, the valuation caveat that a headline multiple hides, and the specific indicators, from memory chip prices to token spending, that could signal the cycle turning.
Why AI spending, not just oil, is pushing the 10-year yield above 5%
The puzzle is simple to state. Yields usually climb when investors fear inflation or a fiscal mess, yet credit spreads (the extra yield companies pay over government bonds) remain tight and stocks keep holding up. Something other than panic is at work.
What the yield move looks like
The 10-year rose about 50 basis points in September alone, according to Reuters, the biggest monthly jump since 2022. A basis point is one hundredth of a percentage point. As of 13 October 2026, the 10-year sits at about 5.22%-5.23% and the 30-year near 5.67%.
The household consequence is direct. The 30-year fixed mortgage rate is running around 7.32%-7.46%, per Zillow and NerdWallet surveys.
The four channels linking AI to rates
Oil matters, mainly as a near-term inflation input through fuels like diesel. But oil cannot explain why yields are rising alongside strong earnings. The AI financing chain can:
- Investment demand: data centres, chips, power and land need enormous upfront funding.
- Higher expected productivity: if AI lifts potential output, investors demand higher real returns.
- Reduced excess saving: capital shifts from financial assets into physical infrastructure.
- Heavier debt supply: governments and hyperscalers issue long-dated debt at the same time.
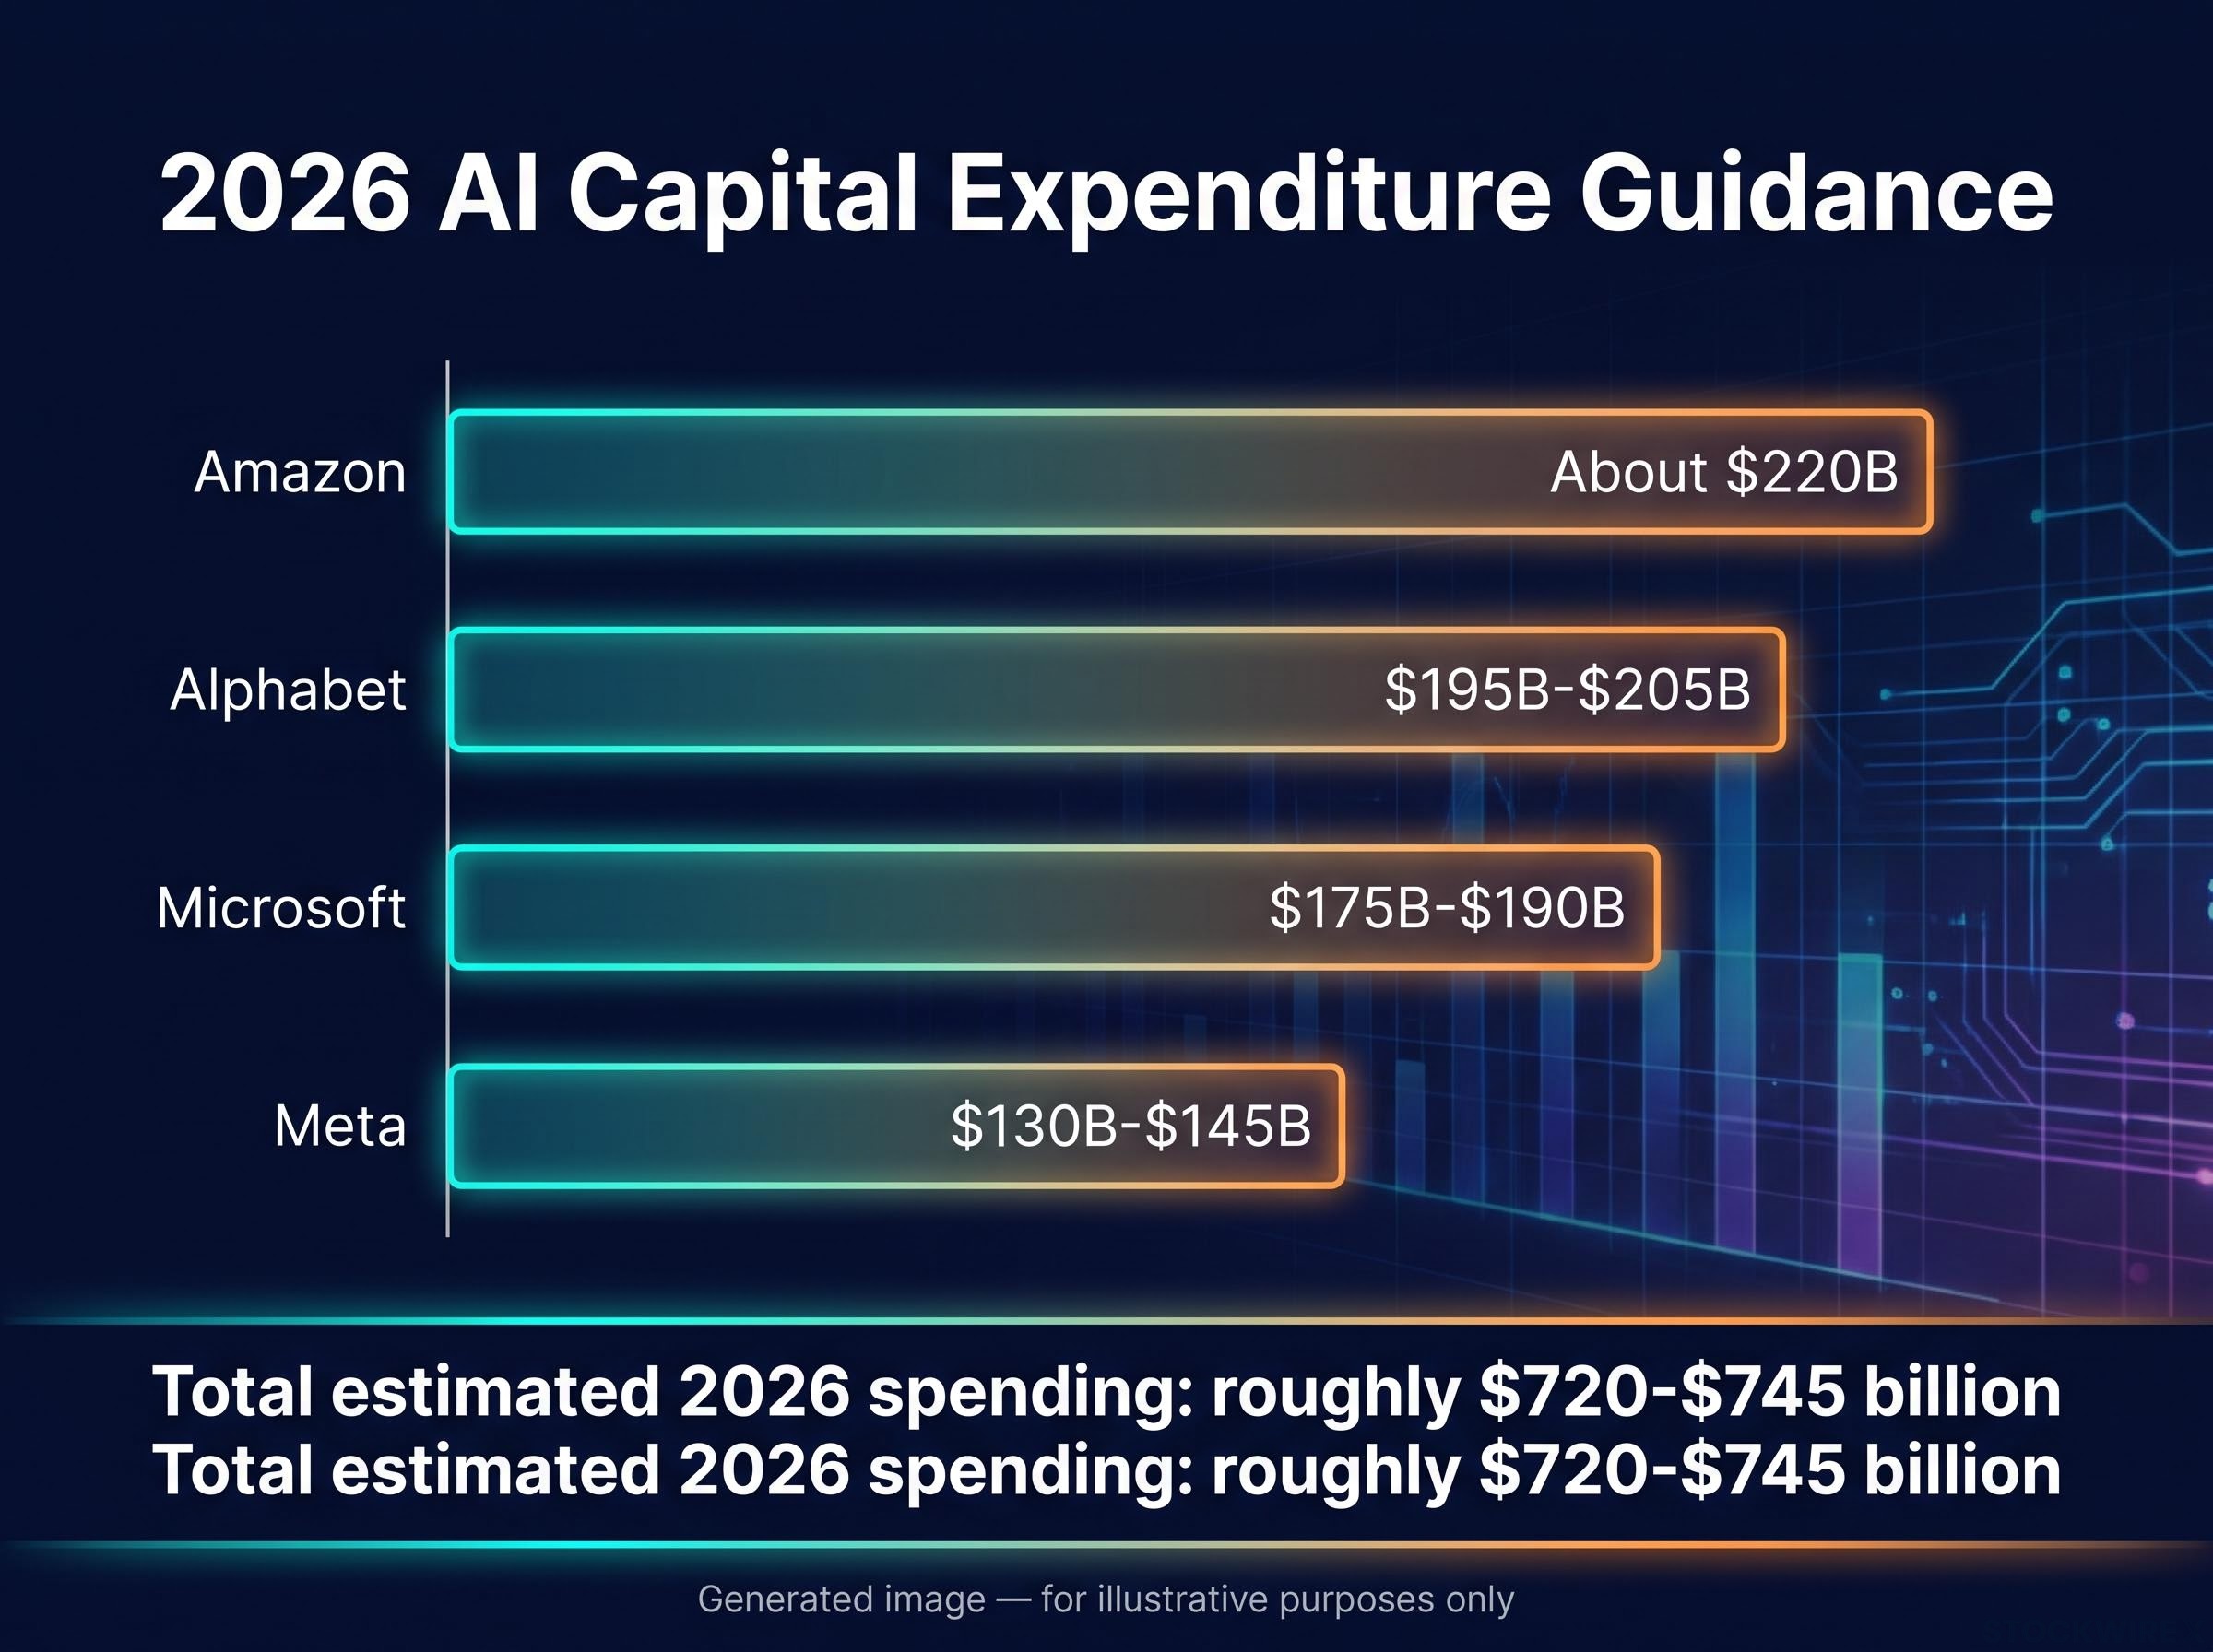
| Company | 2026 guidance | Recent detail |
|---|---|---|
| Microsoft | $175B-$190B | Fiscal Q4 capex about $41B |
| Alphabet | $195B-$205B | Q2 capex $44.92B, up about 100% YoY |
| Amazon | About $220B | Q2 capex $53.1B, partly from memory costs |
| Meta | $130B-$145B | Q2 capex about $31.1B |
That total equals roughly 2.3%-2.7% of US GDP. Consensus estimates for five companies including Oracle climbed from about $485B in January to $730B in July. Bank of England data show hyperscalers’ share of US investment-grade bond issuance jumping from 3% to 15% by early May.
Projected AI bond issuance of $250 billion in 2026 and roughly $400 billion in 2027 adds long-dated supply to a market already absorbing heavy government borrowing, though some estimates put the spillover to broader corporate borrowing costs at only a few basis points.
The Institute of International Finance, Fed Governor Christopher Waller and the ECB’s Christine Lagarde have all linked AI activity to a higher neutral rate, the interest rate that neither stimulates nor restrains the economy. Peter Berezin of BCA Research goes further, arguing the AI boom outweighs oil as a driver. Government borrowing remains a third force.
What this tells you: the yield move partly reflects a strong-investment economy, so it is not an automatic sell signal for equities. It also means your mortgage and borrowing costs are unlikely to ease soon.
When big ASX news breaks, our subscribers know first
Why stocks have not cracked yet, and what yield levels would change that
Intuition says 5% yields should hurt stocks. The reason they have not is that rates do their real damage by restricting the economy, and policy is not yet restrictive.
A Taylor rule is a formula that estimates where the Fed’s policy rate should sit given inflation and growth. Those rules currently imply a Fed funds rate of roughly 5%-6%. Meanwhile the 10-year remains below nominal GDP growth of about 6.5%, so borrowing costs still trail the pace at which the economy is expanding.
The story is also different. In 2022, markets believed the Fed wanted to slow the economy. Today the read is a strong economy that needs higher rates, and earnings back it up: the S&P 500 trades near 19x forward earnings, close to its 10-year average, and Google Cloud revenue rose 82% YoY.
| 10-year level | Historical reference | What it signals | Possible portfolio stance |
|---|---|---|---|
| About 5.2% | Highest since 2007 | Growth-led rates, below nominal GDP | Benchmark equity weight |
| About 5.5% | Berezin’s bond buy level | TIPS near a 3% real yield | Reassess bond allocation |
| About 6.5% | 2000 peak before stocks buckled | Historical stress marker | Defensive positioning |
TIPS are inflation-protected Treasury bonds whose principal adjusts with consumer prices. Berezin is neutral on stocks, expecting a sideways market for the rest of 2026 and a decline in 2027, and suggests holding benchmark weight, such as 60% equities in a 60/40 portfolio, while planning to turn defensive later.
Timing logic: Stocks usually peak before capital spending does. Berezin sees the boom running another 12-24 months, with equities possibly peaking in 2027 and capex around 2028.
The market’s calm is conditional on yields staying below nominal growth. Your reassessment trigger is a move toward 5.5%-6.5%, not the 5.2% headline. These projections are speculative and subject to change.
Is the AI bubble a margin bubble rather than a valuation bubble?
A 19x multiple looks reassuring. The question is what the earnings underneath it are made of.
The Shiller CAPE ratio sits near 40, the second-highest reading in 155 years, which complicates the comfort of a 19x forward multiple; cyclically adjusted earnings tell a more demanding story than one-year projections.
- P/E bubble: the price is too high relative to earnings. Price to earnings (P/E) compares a share price with profit per share.
- Margin bubble: the price looks fair, but the earnings themselves are inflated and may not last.
A simple illustration: a company earning $20 on $100 of sales looks cheap at 19x. If that margin falls back to $14, the same price now looks expensive.
That is Berezin’s argument. Apply 2019 margins and the S&P 500’s multiple jumps to about 27x. Forward margin assumptions of about 16.7% are a record, per BCA. Nvidia’s operating margin is around 65.2%, and Micron’s gross margin about 80.72%, levels that may compress as compute supply grows.
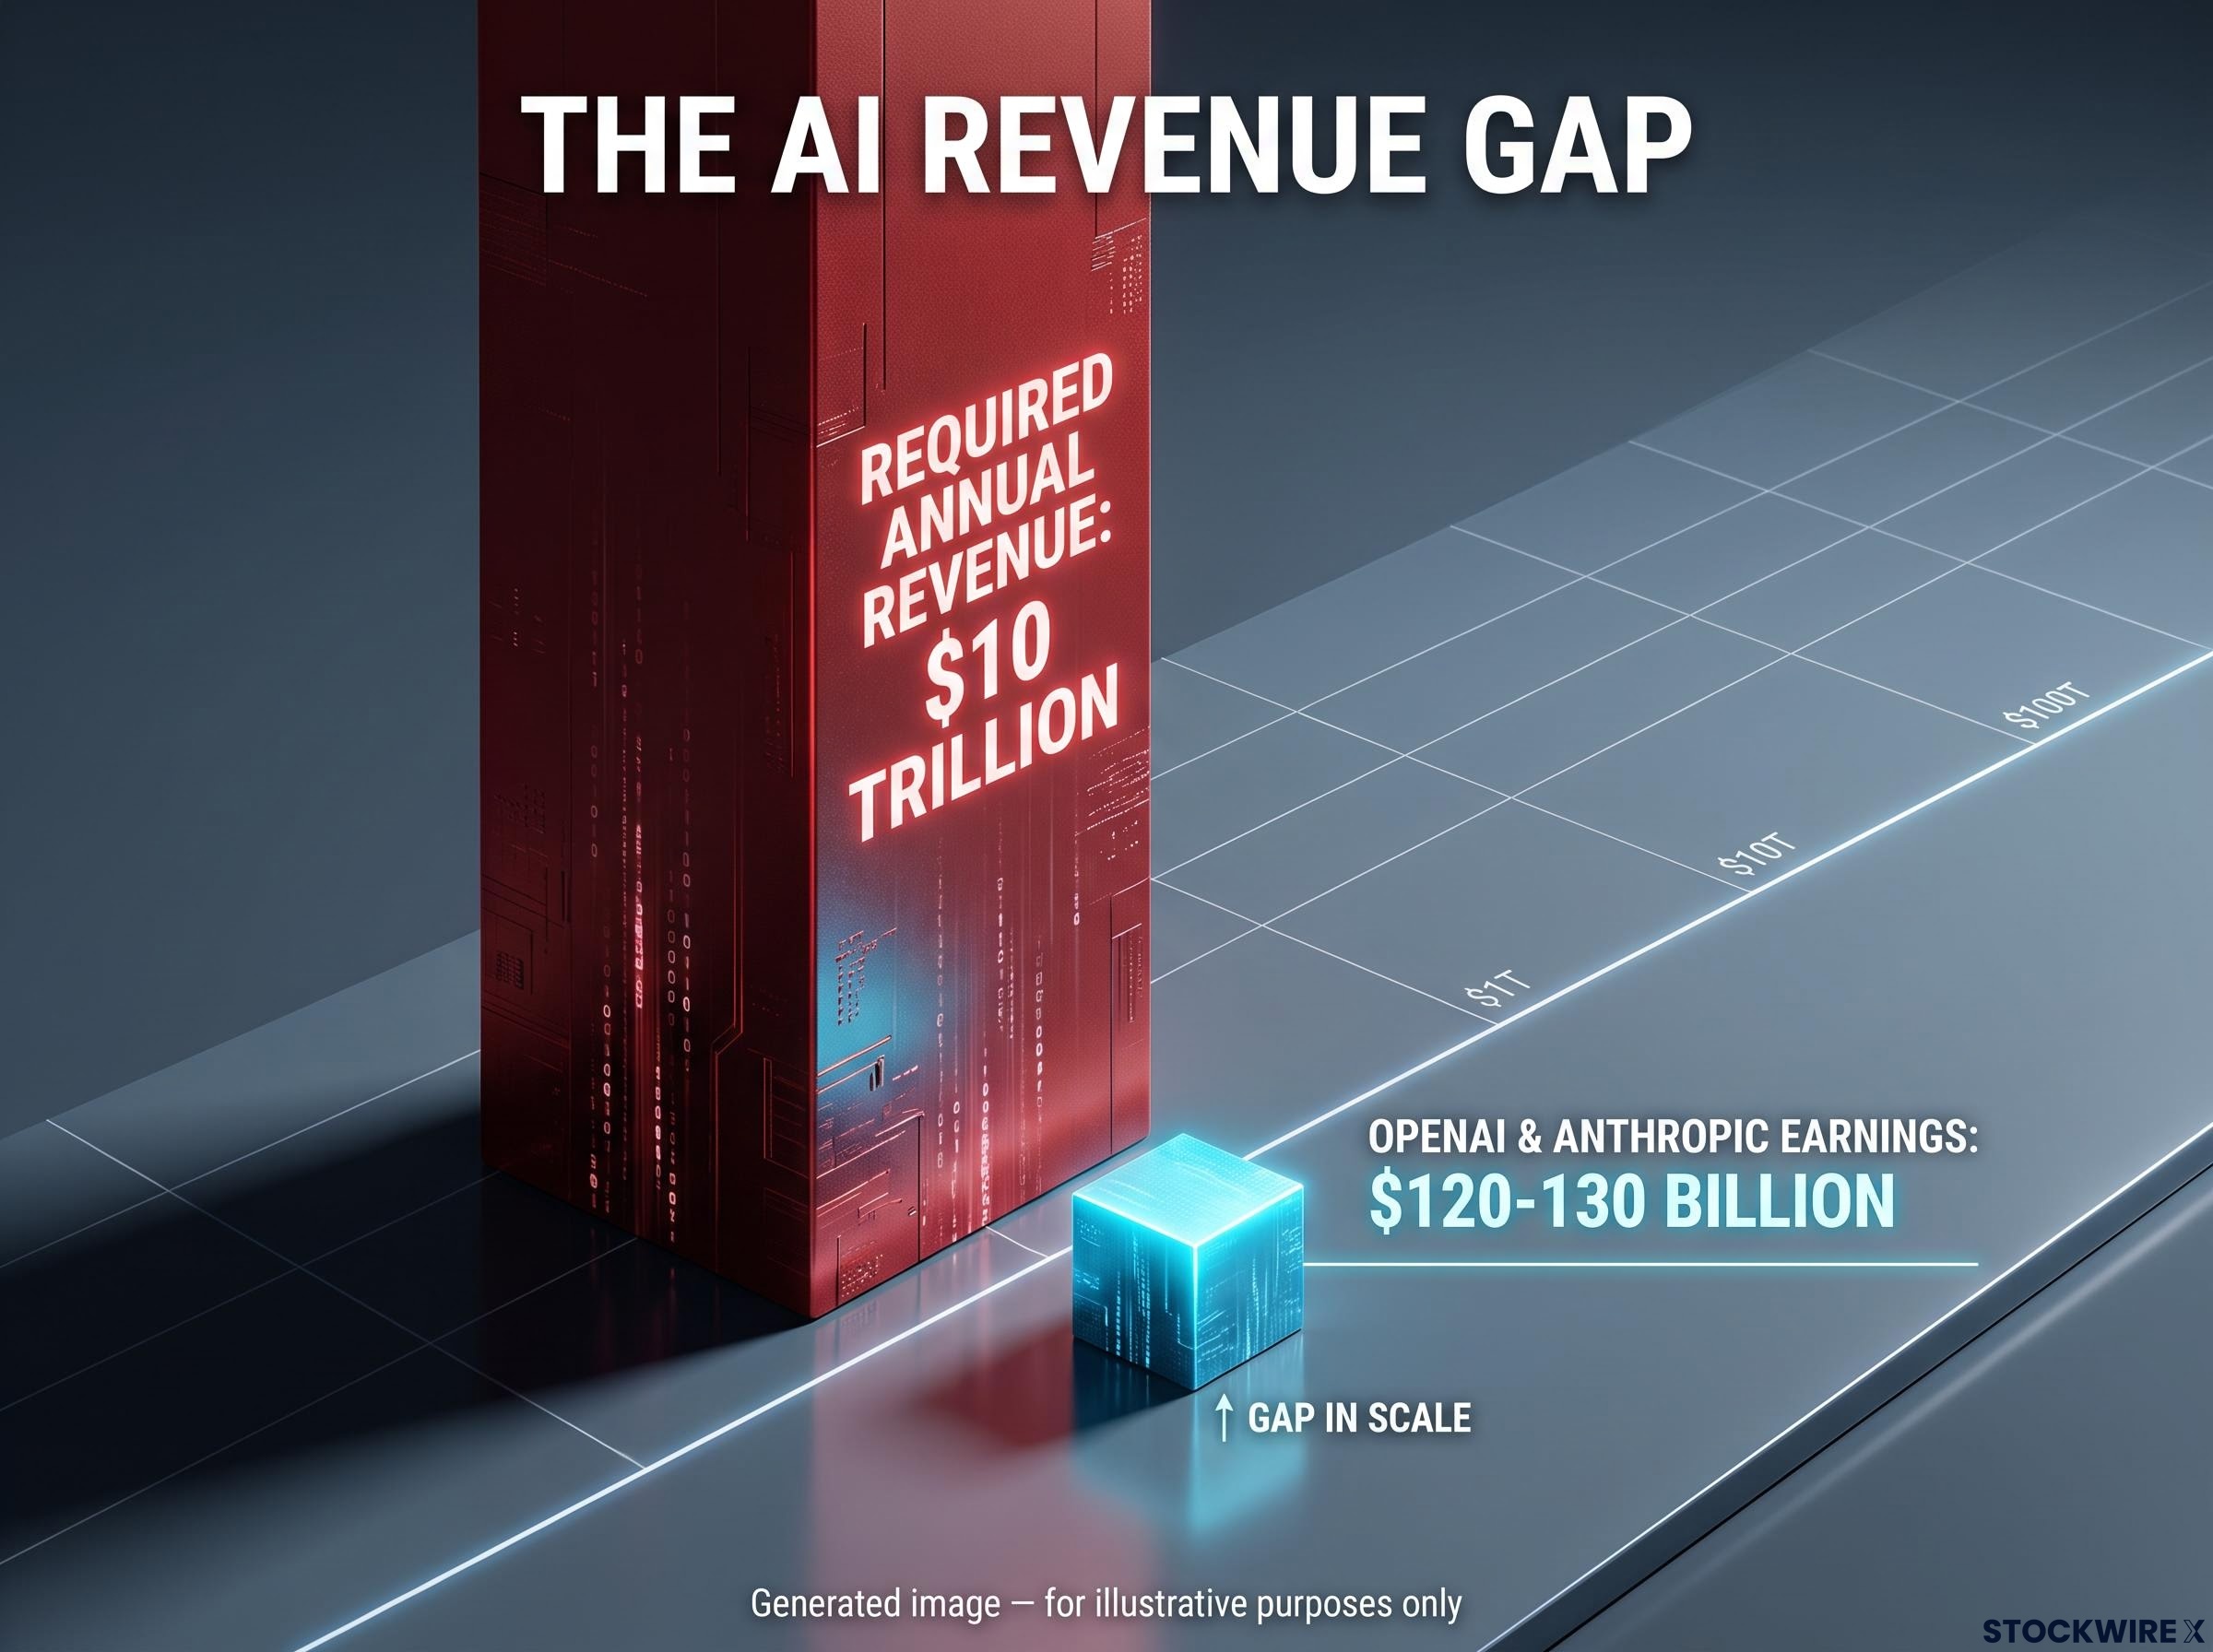
The revenue gap: AI firms need roughly $10 trillion in annual revenue to justify the spending. OpenAI and Anthropic together earn about $120-130 billion.
Depreciation, the accounting cost of wearing out equipment, is the slow-moving pressure. BCA projects hyperscaler depreciation rising from about $255B in 2026 to $581B in 2029. Reuters reports the five big spenders could outspend their free cash flow by 2027, and Fitch warns capex above $1 trillion a year in 2027-29 may exceed economically justifiable levels.
Bear case:
- Record margins may reflect temporary demand
- Depreciation is lagging spending
- Capex may exceed free cash flow by 2027
- Q2 productivity grew 2.2% YoY versus a 2% average, so gains are not yet economy-wide
Bull case:
- Spenders are large and profitable
- Demand and backlogs are real
- Customers are paying today
- The multiple is near its 10-year average
The takeaway for you: a reasonable index multiple can mask fragile earnings. Judging the market on P/E alone offers false comfort.
Why a tech bust would be harder to cushion than the one in 2000
The 2001 rescue playbook had two main tools: aggressive rate cuts and a wealth base small enough that a stock crash did limited damage to spending. Set each against today.
Policy room
The Fed cut rates about 12 times in 2001. Today, inflation has run above target for six years and the budget deficit sits near 7% of GDP, leaving little fiscal space. A 2026 Baringa report reached a similar conclusion on narrowing policy room.
Berezin’s main risk is oil-driven inflation expectations losing their anchor, as in the 1970s. The IMF’s October outlook projects 2.3% US growth in 2026 and 2027 and oil at $96 in 2026, but assumes Hormuz shipments resume by March 2027, a timeline Berezin doubts.
Wealth exposure
US household equity wealth is about $76 trillion, versus $13 trillion in 2000, or roughly 230% of GDP versus 130%. Stanford economists estimate stock wealth effects add about $100B (0.4% of GDP) to growth. A bust would hit wealthy consumers and their spending harder.
Financing links have also deepened. Private credit’s share of AI financing rose from 9% in 2024 to 34% in 2025, per Bank of England data.
| Factor | 2000-01 | 2022 | Today |
|---|---|---|---|
| Policy room | About 12 Fed cuts | Fed tightening | Sticky inflation, 7% deficit |
| Wealth exposure | About 130% of GDP | Elevated | About 230% of GDP |
| Shock type | Valuation collapse | Discount-rate shock | Multiples and earnings cut together |
| Inflation backdrop | Contained | High and rising | Could stay inflationary |
Unlike 2022, a bust would bring both multiple compression and earnings downgrades. Fed economist Austan Goolsbee has described AI as an inflation problem, citing land, electricity, construction and component costs. The counterpoint holds: today’s spenders are profitable and fund much capex from operating cash flow.
For you, the “Fed will rescue it” cushion is thinner. Size risk assuming a slower, shallower recovery than after 2000.
Indicators that would tell you the cycle is turning
Valuation is a poor timing tool, and analyst forecasts tend to lag. Real-economy prices usually move first, which is why Berezin watches memory and token pricing.
| Indicator | Rising signals | Falling signals | Current reading |
|---|---|---|---|
| Memory prices | Genuine shortage | Weak demand or new capacity | UBS: +30%-40% QoQ in Q3 |
| Token spending | Pricing power holds | Provider margins erode | Almost 20% below May high |
| GPU rentals | Tight supply | Overcapacity | H100 costs rising fastest |
| Capex guidance | Boom intact | Early warning | About $720-745B |
| Credit spreads | Financing stress | Easy funding | High-yield tech about 40 bp wider |
| Depreciation | Margin pressure | Relief | More than doubling by 2029 |
UBS’s July forecast for memory prices far exceeded the 10%-15% consensus. The Silicon Data LLM Token Expenditure Index, which nearly doubled from December, has since fallen back. UBS’s stress scenario sees AI-related tech spreads widening toward about 90 bp.
S&P Global Ratings has extended its memory chip price forecast through at least 2028, since new fabs need 3-4 years to reach volume production; that makes rising memory prices a sign of structural scarcity as much as demand.
Rank them this way:
- Memory prices: the clearest read on physical demand
- Token spending: the read on whether end users pay
- Credit spreads: the read on whether financing stays open
A flattening token index alongside surging memory prices is a mixed signal, not a verdict. Two or three indicators turning together matters far more than any single move.
What the boom’s timeline changes for your portfolio, and what it does not
AI spending is a major, though not sole, driver of 5%+ yields. The technology and demand are real; the return on the marginal infrastructure dollar may be overstated.
The timeline framework suggests a boom lasting another 12-24 months, with stocks possibly peaking in 2027 ahead of capex around 2028. That supports benchmark allocation now and a defensive shift later.
With the Magnificent Seven near 32% of the S&P 500, concentration risk means any broad index holder already carries a sizeable AI bet, and for those within 5-10 years of retirement a sharp repricing is especially damaging.
Your decision points are clear: the 5.5% yield level where bonds gain appeal, margin and depreciation trends, and the indicator watchlist above. Track memory, token and credit signals monthly, and revisit your allocation as yields approach the upper thresholds.
This article is for informational purposes only and should not be considered financial advice. Investors should conduct their own research and consult with financial professionals before making investment decisions. Past performance does not guarantee future results, and financial projections are subject to market conditions and various risk factors.