Sterling climbed against the dollar on Tuesday 13 October 2026, with GBP/USD up about 0.28% to trade near 1.3244 as traders bet on a Bank of England rate rise in November. Any GBP/USD forecast built on that rally runs into an awkward fact: the daily chart still leans bearish. A rally and a downtrend can sit side by side, and that is the signal many readers are missing.
The hike itself is largely priced in. Market-implied odds of a 25 basis point rise on 5 November sat near 90% on 9 October, according to Pound Sterling Live, while other reports put them closer to 84%.
So the question has changed. It is no longer whether the Bank of England (BoE) moves, but what is left to push the pair higher once it does.
Here is a clear read on what is moving the pound, the price levels that matter on the chart, and the dated events over the next three weeks that could settle the argument either way.
Why are traders betting on a November BoE hike?
The loudest voice behind the move belongs to Megan Greene, an external member of the Monetary Policy Committee (MPC), the nine-person group that sets UK interest rates. She voted for a 25bp rise to 4% at the June, July and September meetings. On 13 October, she told Bloomberg that the growth upgrade and a resilient jobs market show rates should sit above the current 3.75%.
The case for hiking
Greene’s argument centres on wages. Reuters reported her concern that pay settlements of roughly 3.5% next year point to too little wage disinflation, meaning pay growth is not cooling fast enough. She has also argued the BoE should not lean on high gilt yields (the interest rates on UK government bonds) to tighten conditions on its behalf.
The wage argument is reinforced by services inflation, private rents and catering prices, which have re-accelerated independently of energy costs and weaken the case that the MPC can simply look through the headline move.
Greene’s warning: Waiting until second-round effects are fully visible would be too late, because energy costs can feed into wages, services prices and expectations before a wage-price spiral becomes obvious.
Barclays and UBS Global Research, as reported by Reuters, expect tightening to resume as soon as November. The IMF’s October World Economic Outlook added fuel, lifting its UK growth forecast to 1.3% for 2026 from 1.0%.
| Indicator | Latest figure | Source/date |
|---|---|---|
| Bank Rate | 3.75% (held) | Bank of England, 12 October 2026 |
| CPI inflation | 3.1% y/y (August) | ONS, 16 September 2026 |
| Unemployment rate | 4.9% (May-July) | ONS, 15 September 2026 |
| Employment rate | 75.1% (May-July) | ONS, 15 September 2026 |
| Vacancies | 702,000 (June-August), lowest since early 2021 | ONS, 15 September 2026 |
The case against
Greene is in a minority on the committee, so market pricing is running ahead of MPC consensus. Much of the inflation impulse comes from energy, and higher rates cannot create energy supply. Vacancies at a five-year low suggest the jobs market is softening, not overheating.
The IMF’s own numbers cut both ways. Growth slows to 1.2% in 2027 while inflation averages 3.3% in 2026 and 2.8% in 2027, a combination the Fund linked to stagflation-like pressure, where prices stay high as growth fades.
What this tells you is that November now works as confirmation, not a fresh catalyst. The pound needs something beyond the hike itself to extend its gains.
When big ASX news breaks, our subscribers know first
What actually moves GBP/USD? A primer on the core drivers
What you saw on screen this week was a pound rally on rate bets. The mechanics behind it are simpler than they look, and they apply to every future BoE or Fed headline.
Rates and the BoE-Fed gap
The BoE targets 2% inflation, mainly by adjusting Bank Rate, the interest rate it pays on reserves held by commercial banks. Higher rates tend to attract investors seeking better returns, which supports sterling.
Because currency markets price expected interest rates rather than the headline decision, the path of Bank Rate, quantitative tightening and forward guidance often matters more to sterling than the move itself.
The key point: Currency markets react to expected interest rates, not current ones. A hike that everyone already anticipates adds little extra lift on the day it arrives.
GBP/USD is the price of one pound in US dollars, so it measures two central banks at once. If the BoE hikes while the US Federal Reserve waits, UK yields rise relative to US yields and the pair tends to climb. A hot US inflation print does the reverse.
A Reuters poll expects September US CPI at 3.6% year on year, with core at 2.5%. MUFG forecasts core up 0.2% month on month, and warns a repeat of the prior 0.3% could revive bets on another Fed hike. Fed futures on 2 October implied about a one-in-four chance of an October rise, with December the dominant expectation.
Fed voices are split in tone. Chicago Fed President Austan Goolsbee said persistent inflation would clearly require action, while Governor Christopher Waller said AI-related investment is affecting US yields and inflation expectations remain well anchored.
Data, trade, risk and fiscal credibility
Rates are the main lever, but five other forces shape the pair:
- Rate expectations: a steeper expected BoE path relative to the Fed supports GBP.
- Economic data: strong GDP, business surveys (PMIs) and employment support GBP; weak readings weigh on it.
- Trade balance: a persistent deficit leaves sterling reliant on foreign capital and exposed if investors demand a higher risk premium.
- Risk sentiment: the dollar tends to gain when investors turn fearful, while sterling is more sensitive to growth.
- Fiscal credibility: credible budgets can lower gilt risk premia and help GBP; unfunded spending can push yields up for the wrong reason.
The 2022 mini-budget proved that last point, when a gilt sell-off sent sterling sharply lower despite rising yields. Scale matters too: the BIS 2025 Triennial Survey shows sterling on one side of 10.2% of global trades, down from 12.9% in 2022, with GBP/USD its main pair.
The read you should take from this: GBP/USD is a relative bet on two central banks, so a single US inflation surprise can undo a UK-driven rally in one session.
Where does the chart point? The bearish daily setup for GBP/USD
Fundamentals give the pound reasons to rise. The chart says it has not earned the right yet.
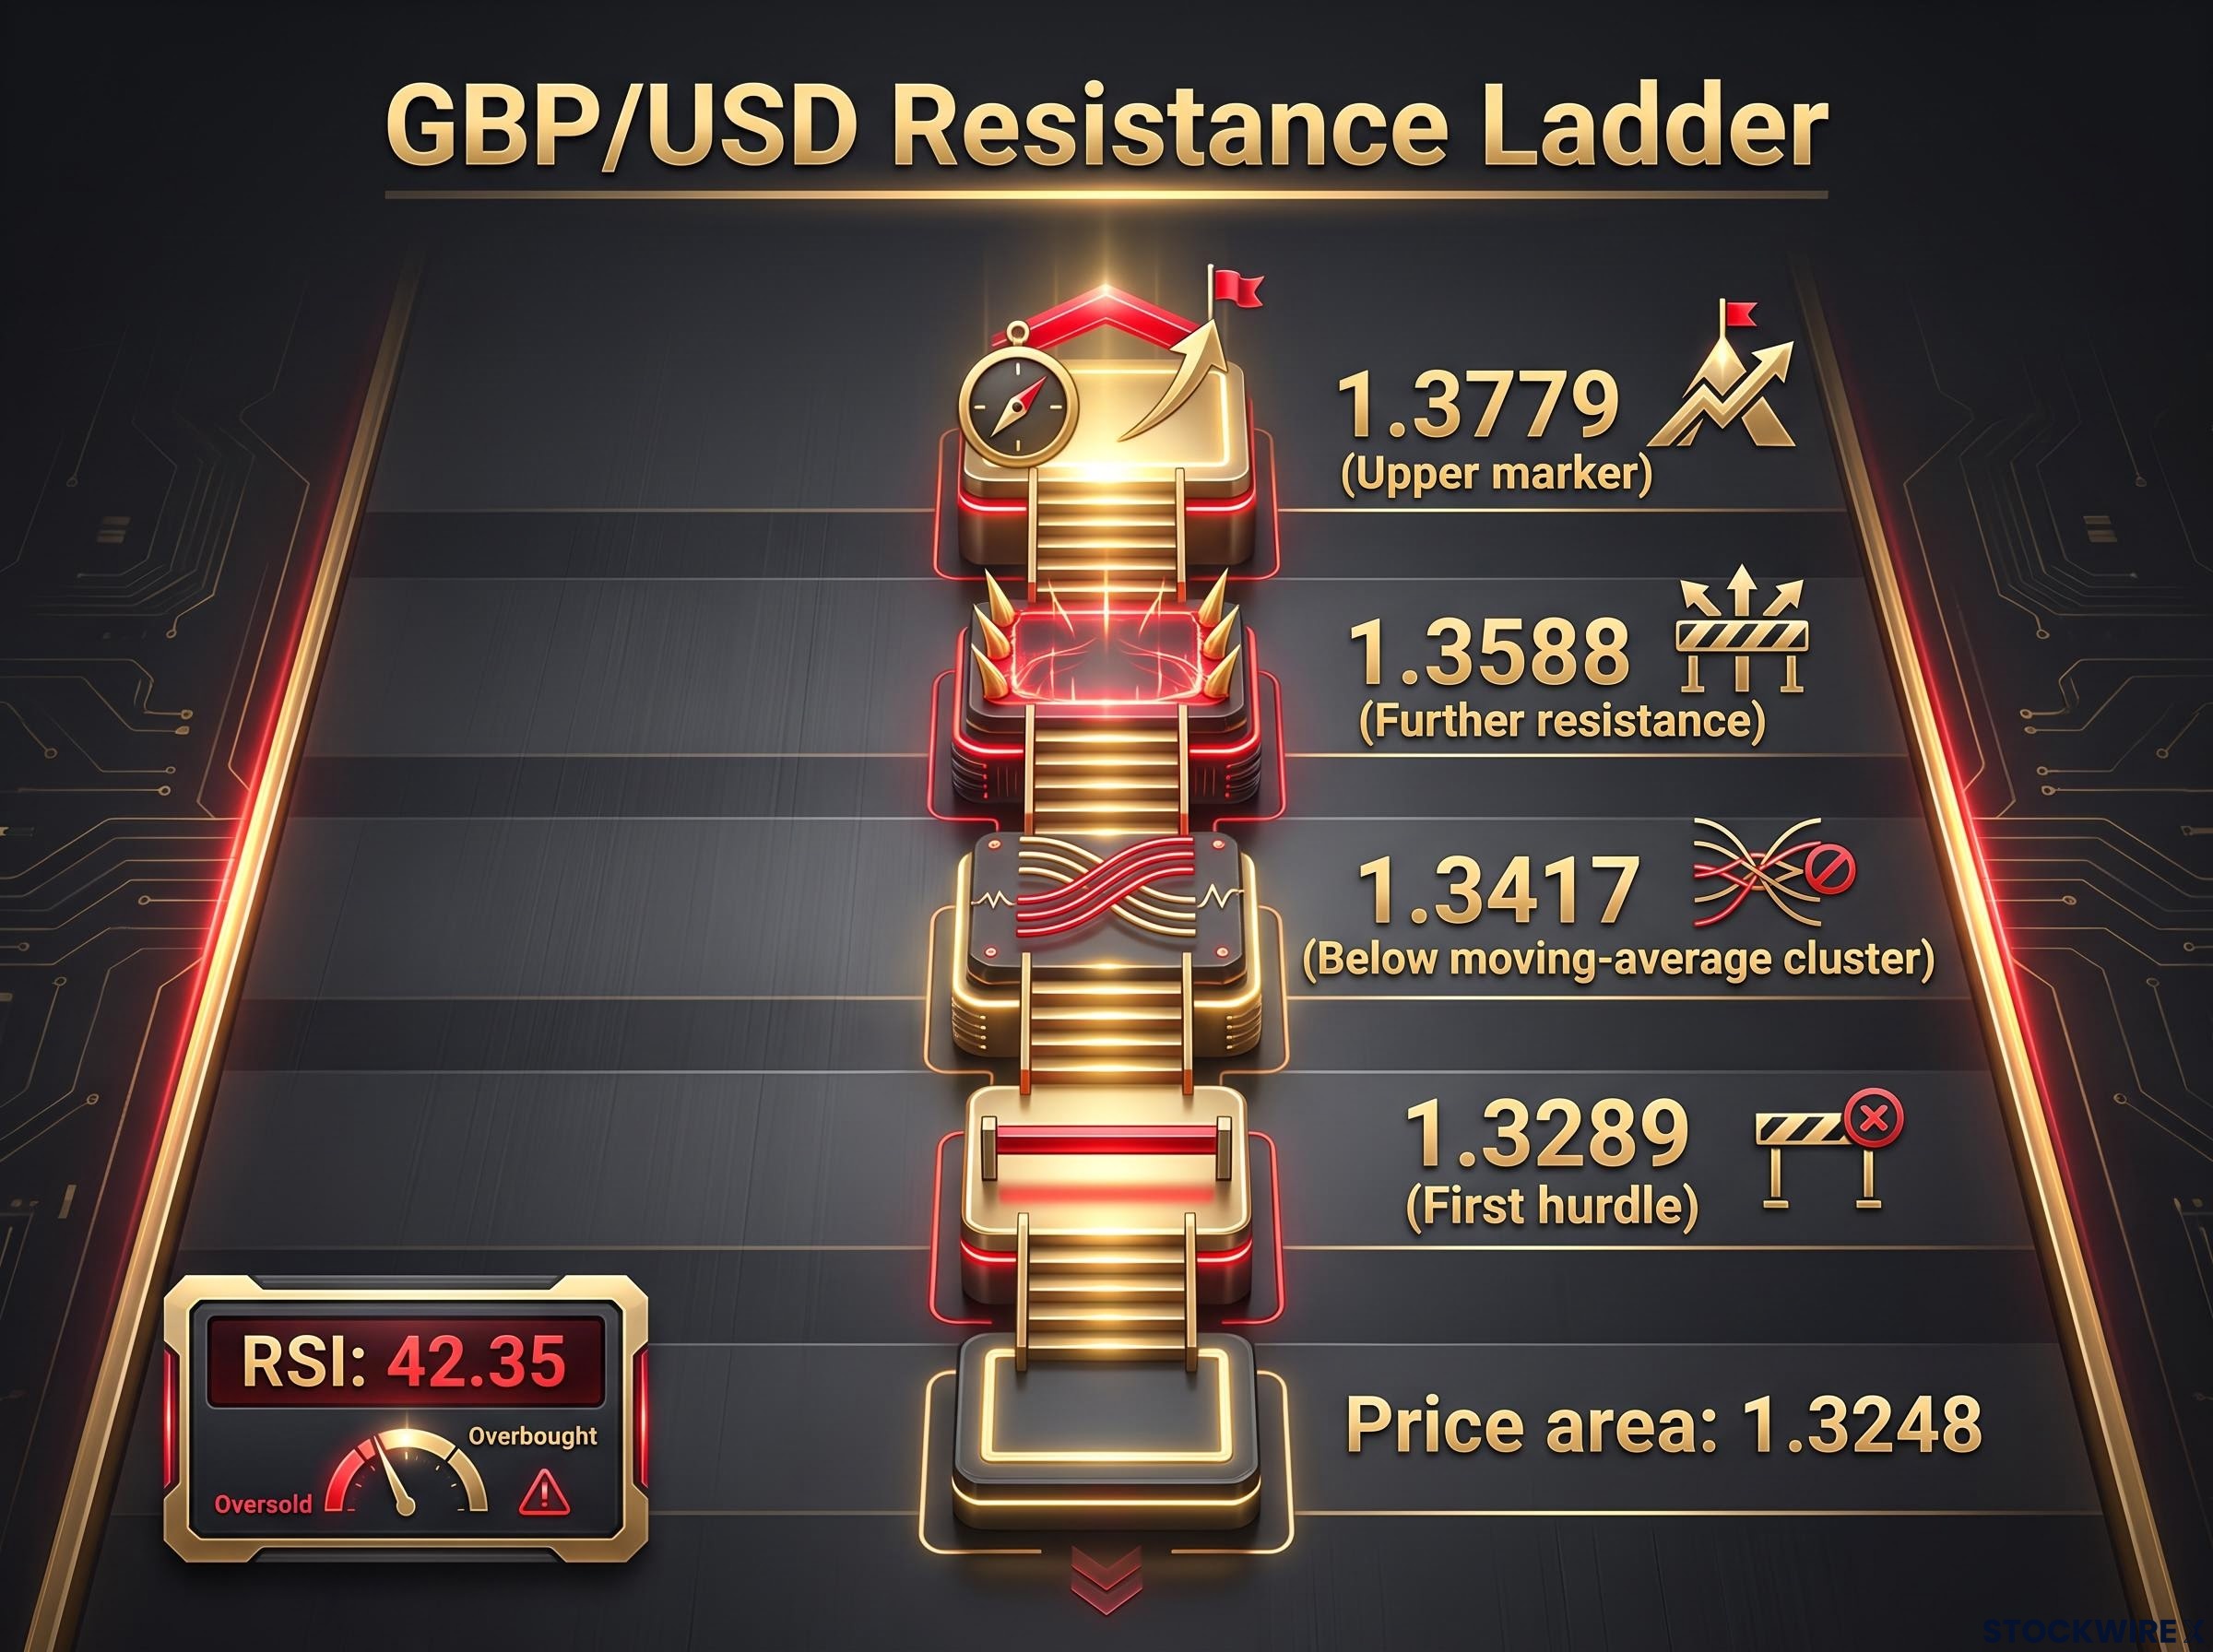
According to FXStreet’s AI-assisted daily-chart analysis, price near 1.3248 sits beneath a cluster of simple moving averages (the average closing price over a set number of days) and descending trend lines. FXStreet places that triple average near 1.3430, while TMGM puts the 50-, 100- and 200-day cluster near 1.3451. The Relative Strength Index (RSI), a momentum gauge running from 0 to 100, reads 42.35, below the 50 midline that separates bullish from bearish momentum.
A repeatable technical analysis framework combining moving average configuration, RSI readings and layered resistance mapping explains why a price sitting beneath a cluster of averages keeps capping rallies, even when the fundamentals look supportive.
The resistance ladder starts close to current price.
| Level | Origin | Significance |
|---|---|---|
| 1.3289 | Descending line from 1.3869 | First hurdle to ease selling pressure |
| 1.3417 | Descending barrier from 1.3653 | Sits just below the moving-average cluster |
| 1.3588 | Further resistance | Next test if the cluster breaks |
| 1.3779 | Further resistance | Upper marker on the ladder |
The trigger level: A daily close above 1.3289 is the first sign the technical picture is turning.
No clear nearby support was identified, which leaves downside targets undefined. This is chart analysis, not a guaranteed outcome.
If you hold a bullish view on the fundamentals, the chart keeps arguing against you until that 1.3289 close arrives.
What could change the GBP/USD forecast? Catalysts, scenarios and risks
The chart sets the levels. The calendar decides whether price reaches them.
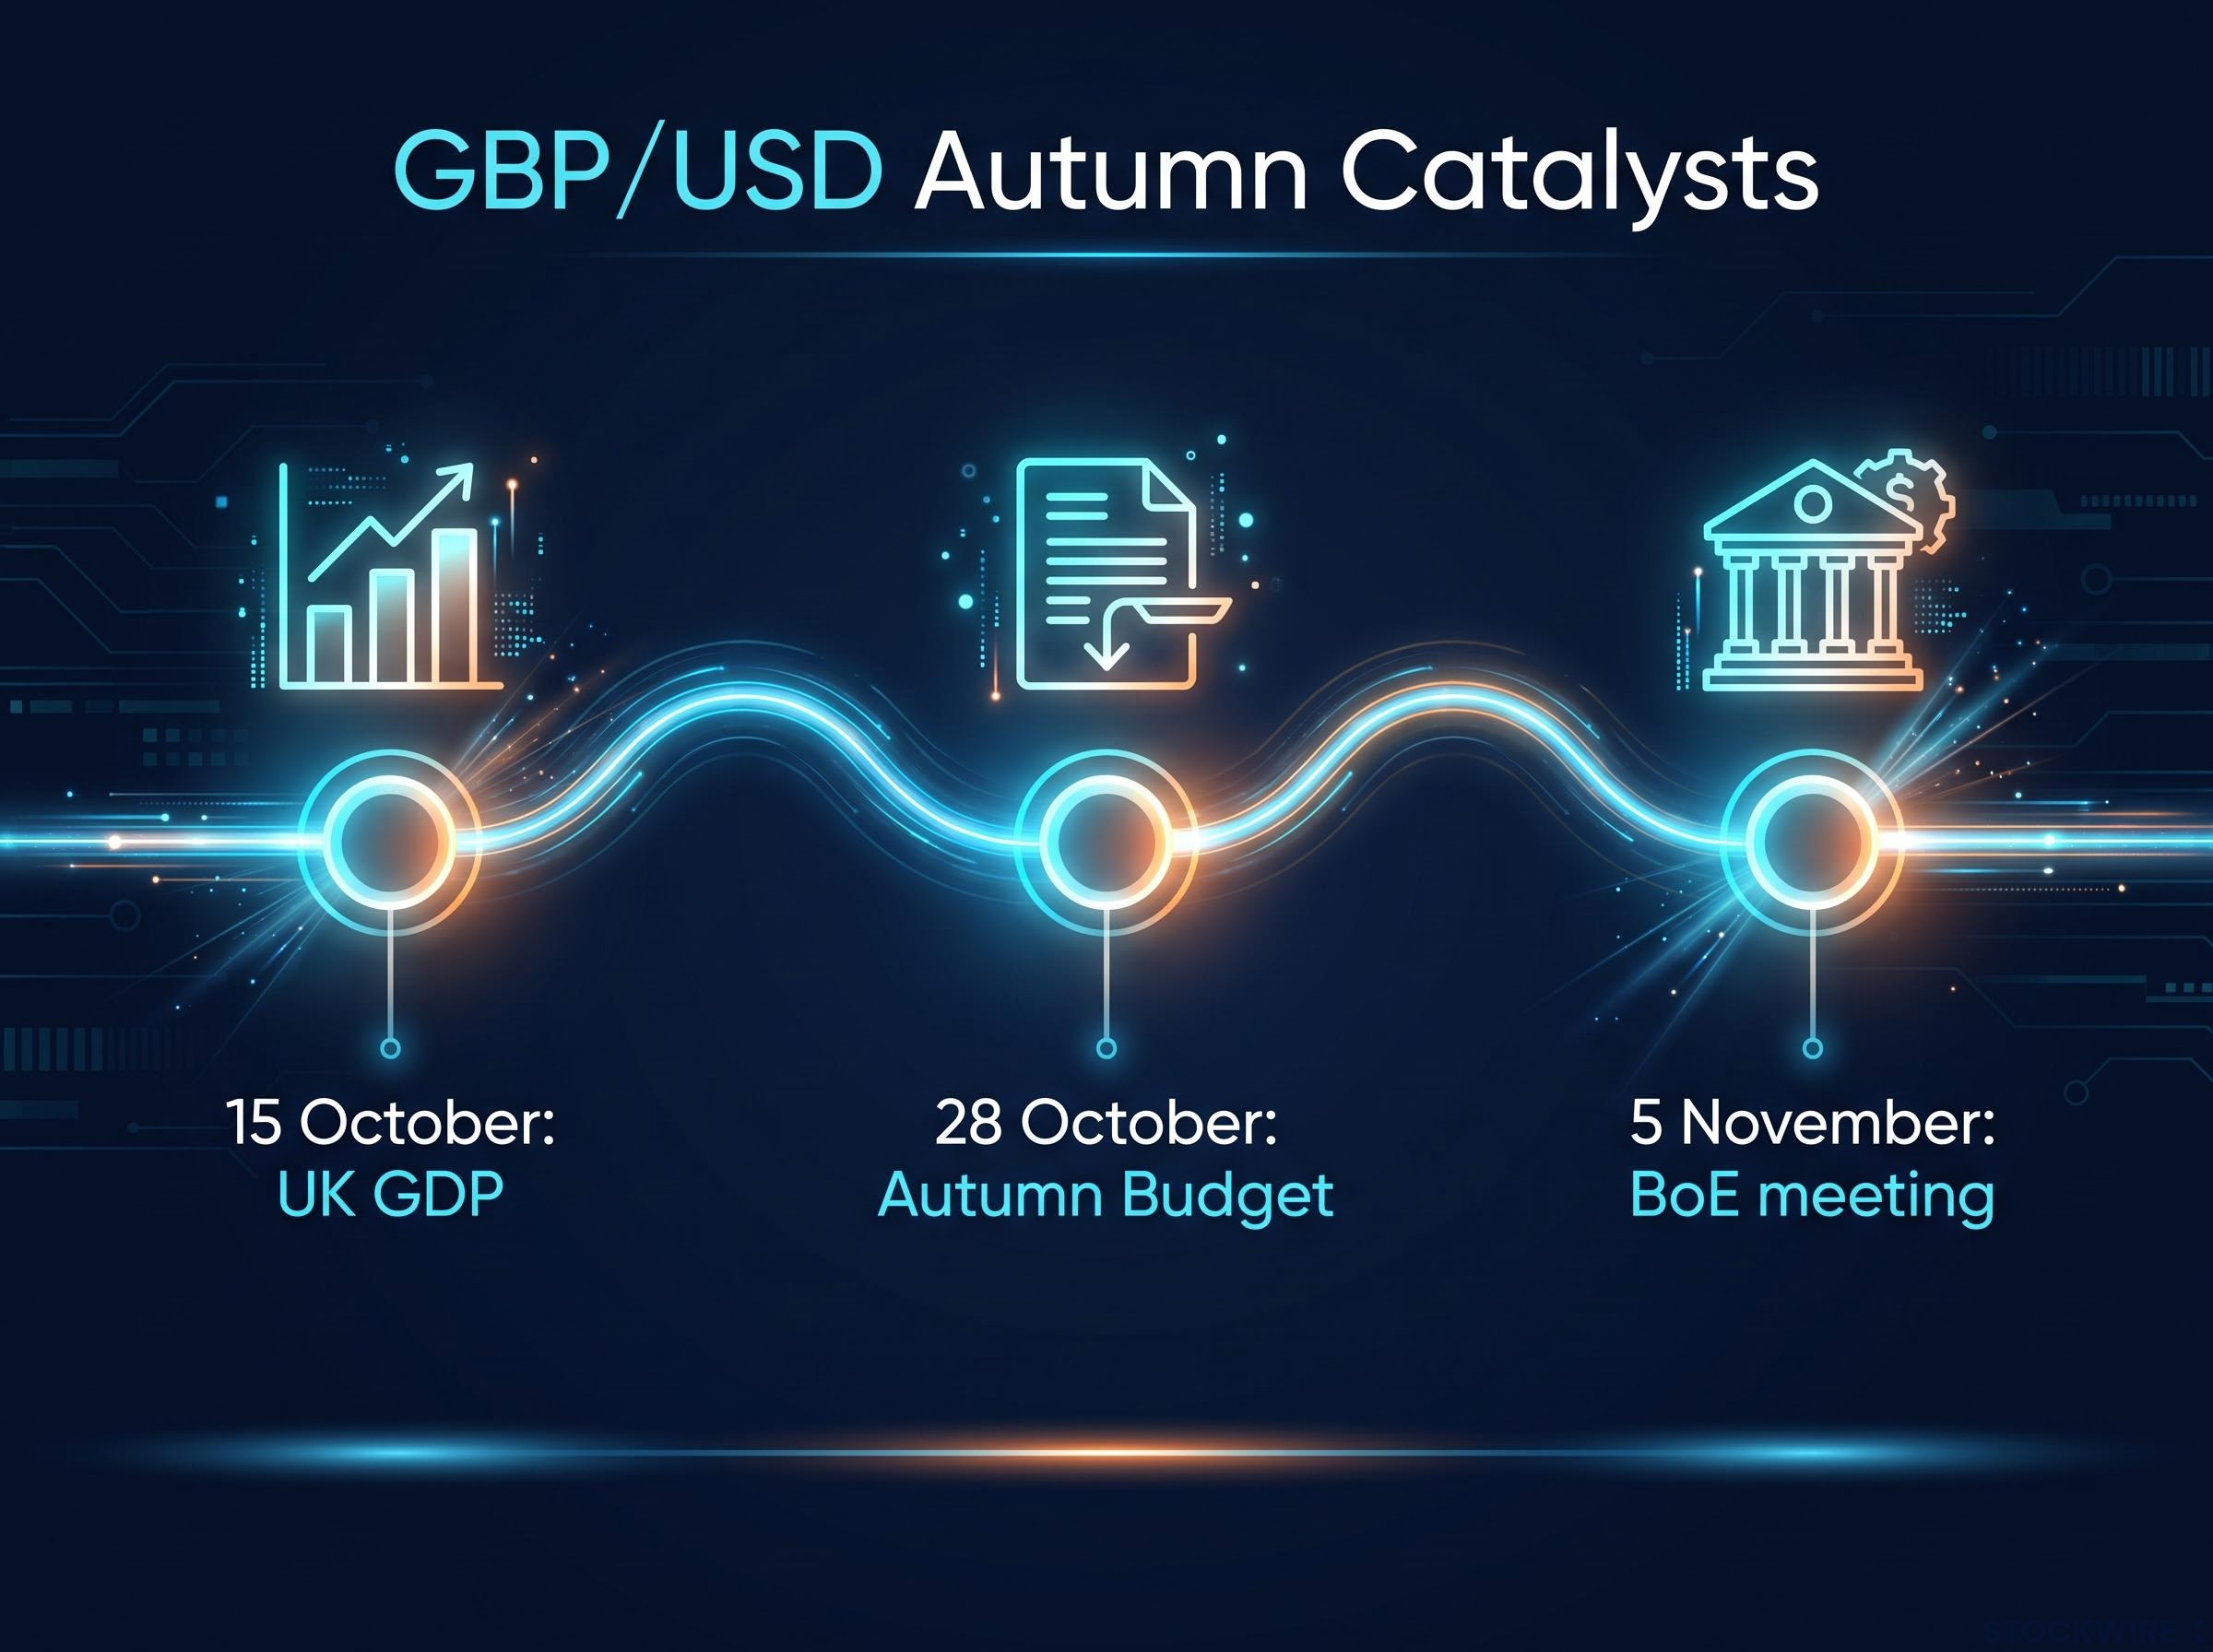
The calendar
- US CPI (this week): a print above 3.6% headline or 2.5% core could firm the dollar.
- UK GDP (15 October): tests whether the IMF’s upgraded growth story shows up in the data.
- Autumn Budget (28 October): credible consolidation may support sterling; unfunded measures could hurt it.
- BoE meeting (5 November): the decision matters less than the guidance attached to it.
The Budget is the underrated catalyst, landing one week before the BoE decides. It is not equivalent to 2022, but that episode explains why fiscal news moves the pound.
Investors weighing the Budget risk can read our detailed coverage of the Bank of England QT revamp, which explains how a 0.3-point rise in long-end yields erases fiscal headroom.
Two scenarios and the risks to both
| Scenario | Trigger | Effect on GBP/USD | Key level |
|---|---|---|---|
| Bull case | BoE seen catching persistent inflation early, resilient jobs, supportive rate gap | Room to challenge resistance | 1.3289, then 1.3417 |
| Cautious case | Hike priced, hot US CPI, fiscal doubt offsetting yield edge | Range-bound or softer | 1.32-1.33 zone |
Both paths carry risks. The BoE could hike into a temporary energy shock, deepen a 2027 slowdown or disappoint markets with limited forward guidance if they are pricing a broader cycle. A weakening labour market hands doves fresh ammunition.
That leaves you with several separate tests over three weeks, and no single release justifies a high-conviction call.
Past performance does not guarantee future results. Forecasts and scenarios are speculative and subject to change with market developments.
Weighing a priced-in hike against a bearish chart
The fundamentals lean towards sterling, but expectations have already absorbed the November hike and the chart still caps the rally. Until a new catalyst arrives, those two forces largely cancel each other out.
Your first decision points are close. A daily close above 1.3289 would tell you the technical resistance is starting to give way. The 28 October Budget will show whether fiscal policy reinforces the BoE’s yield support or undercuts it.
Treat the US CPI print and UK GDP as early evidence, not verdicts. The stronger read will come from how the pair behaves around those levels and dates combined.
This article is for informational purposes only and should not be considered financial advice. Investors should conduct their own research and consult with financial professionals before making investment decisions.