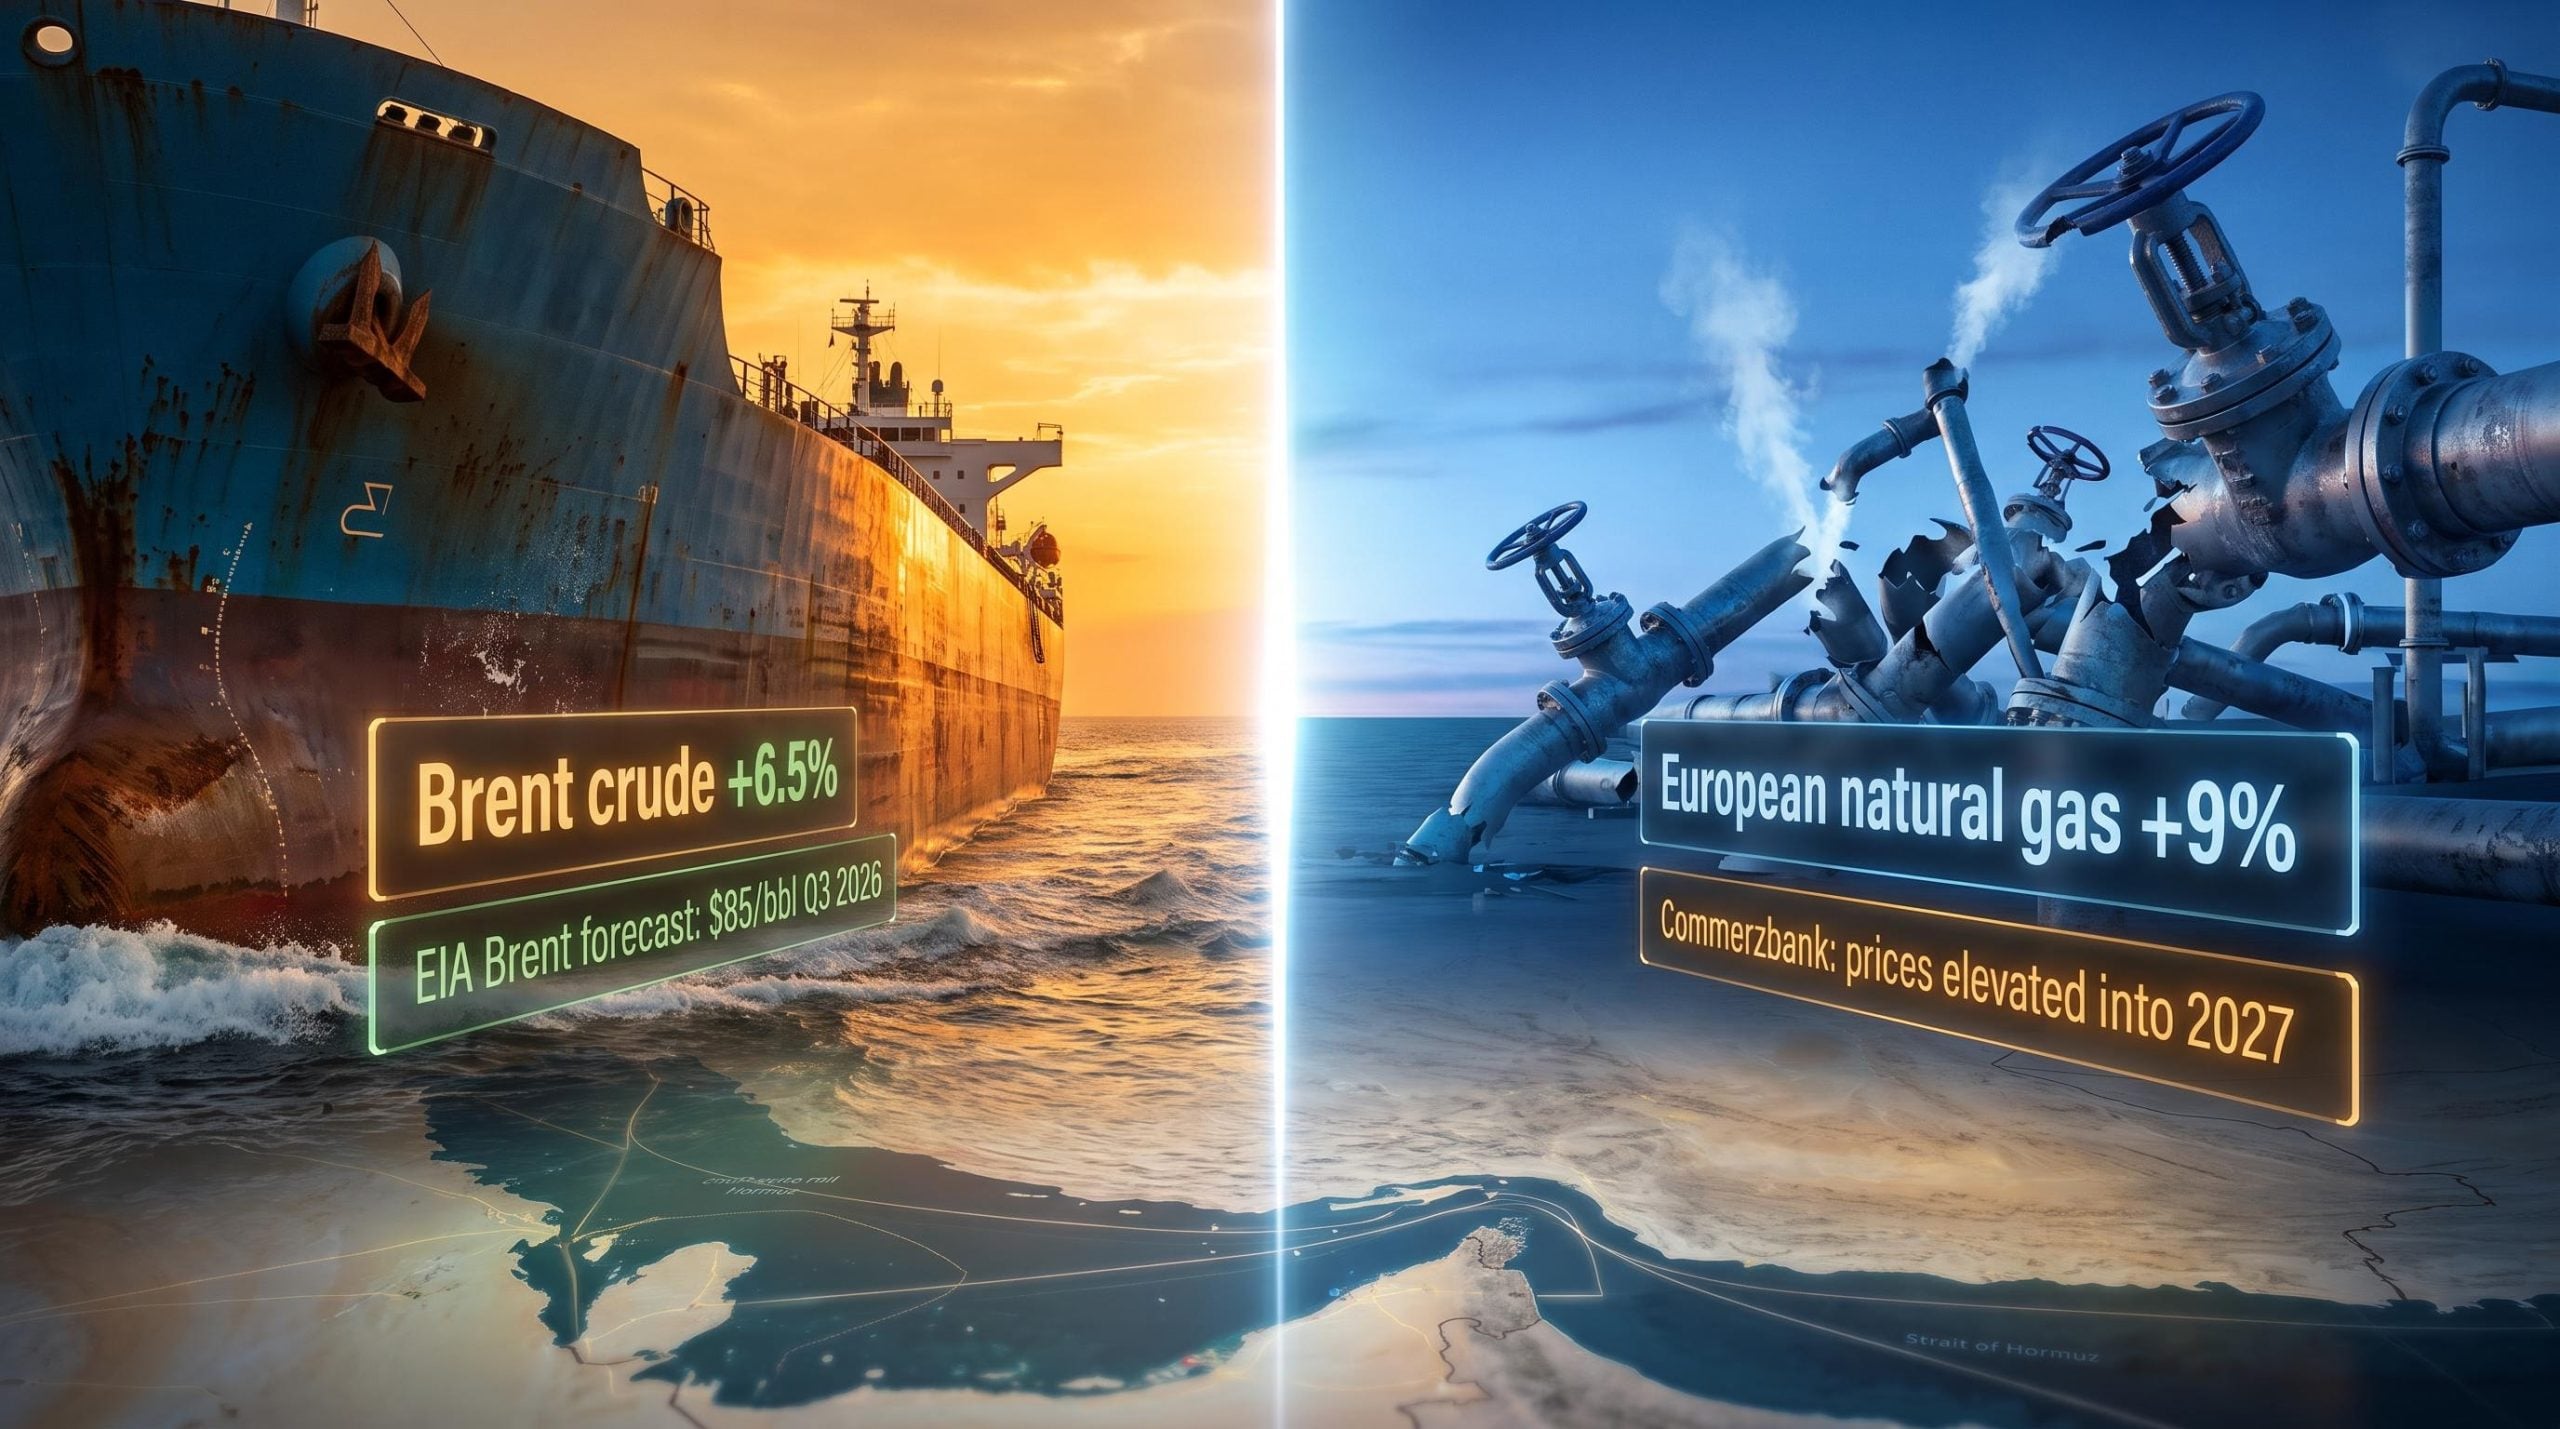
Both Brent crude and European natural gas prices surged this week, and financial headlines are treating them as the same story. They are not.
The Middle East crisis has created a single geopolitical event with two entirely different supply chain consequences. Crude oil is responding to a logistics problem: tankers rerouting around the Strait of Hormuz, voyages lengthening, freight costs climbing. European natural gas is responding to something deeper, a structural loss of LNG capacity that no single agreement or ceasefire can repair. Investors reading both moves as one trade are carrying a risk they have not priced in.
Here is the specific divergence that matters for your portfolio. This piece separates the two mechanisms, identifies which commodity is most sensitive to a diplomatic resolution and which is tied to a multi-year structural problem, and gives you the signals to watch for each so you are not reacting to the wrong headline for the wrong position.
Same shock, two separate market signals
This week saw sharp gains across both commodity classes, moving in lockstep despite serving different underlying functions. Brent crude gained approximately 6.5%. European natural gas climbed nearly 9%. Heightened Middle East tensions and tightening restrictions on Hormuz shipping provided the common catalyst for both moves.
Brent crude: +6.5%. European natural gas: +9%. Same week, same geopolitical trigger, different underlying mechanics.
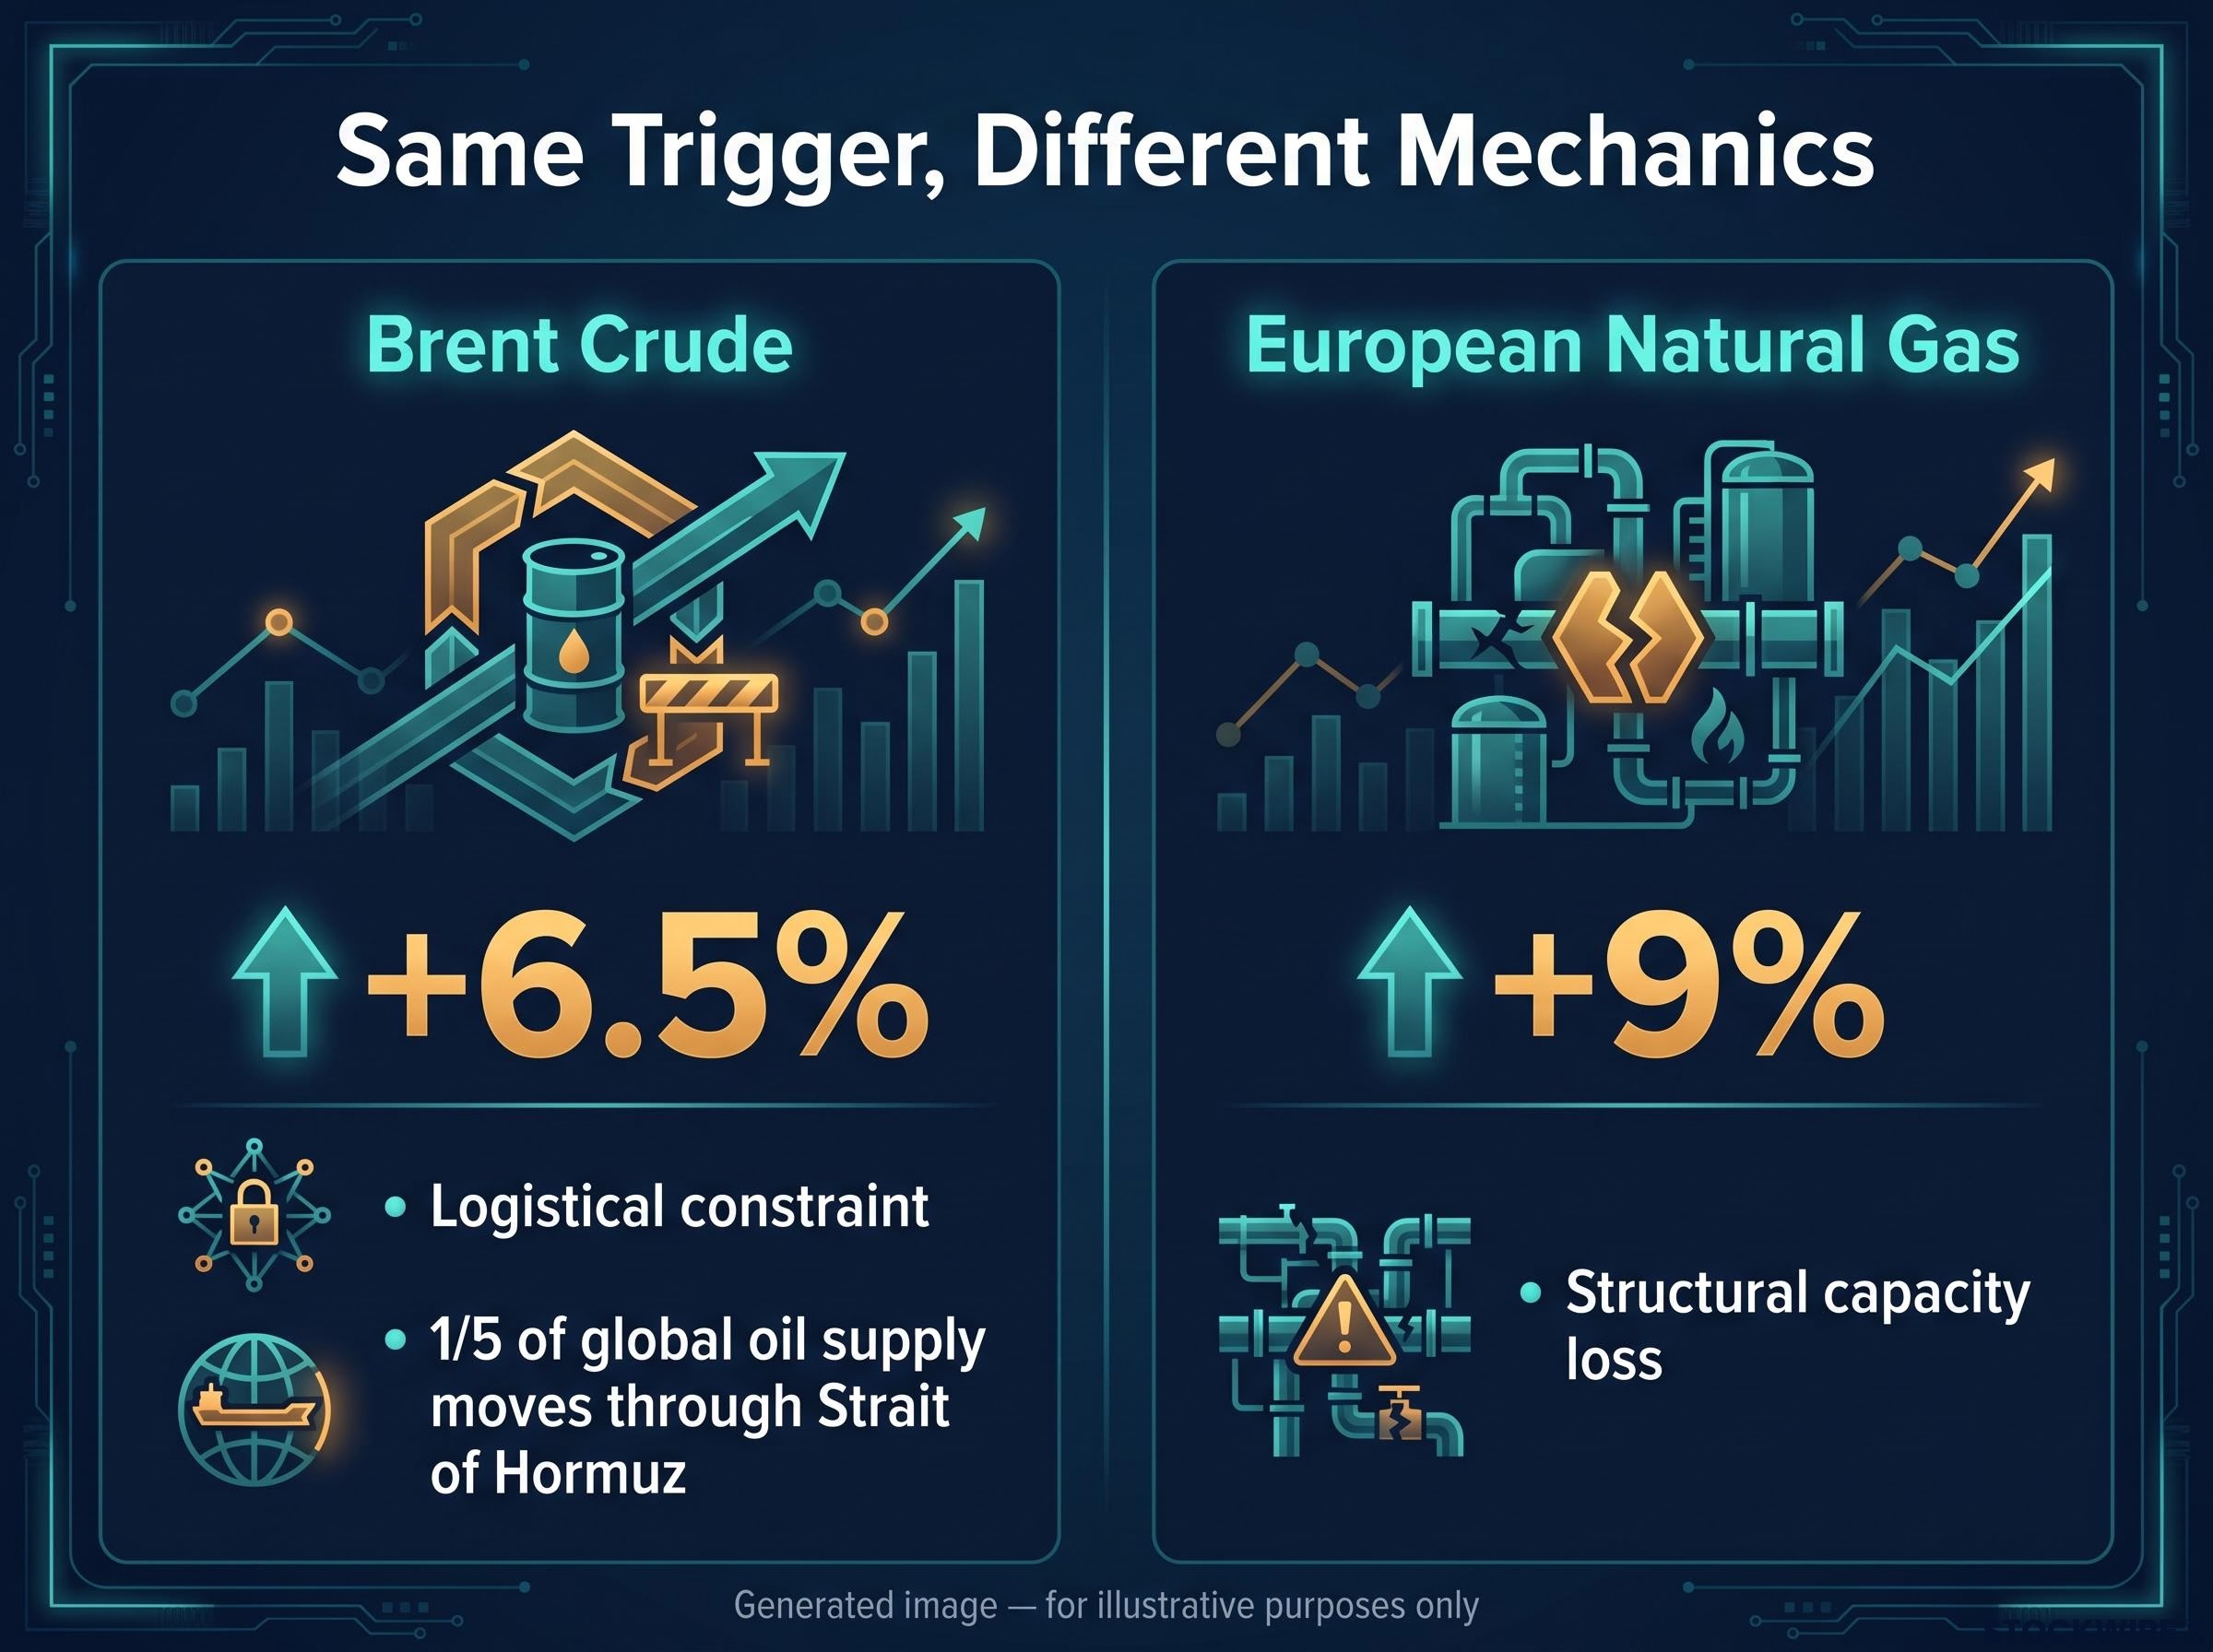
The shared geography is real. Roughly one-fifth of global oil supply and significant LNG volumes from the Persian Gulf move through the Strait of Hormuz. Commerzbank analyst Norman Liebke has noted that while Brent and European gas are each responding to Middle East supply risks, they are doing so through entirely different channels, with oil buoyed by rerouted tanker flows and gas squeezed by lost Qatari LNG capacity and cargoes pulled toward Asia.
OPEC’s coordination mechanism has been structurally eroding for years, with the cartel’s share of global crude output falling from a historical peak of more than 50% to approximately 27-28% following the UAE’s May 2026 exit, which means the supply response that once damped price spikes is no longer available at anywhere near its historical scale.
What follows in these two commodities is not one energy story. It is two parallel stories with different durations, different relief conditions, and different implications for anyone holding energy-linked positions. The identical price direction can lead you to assume the same trade is running in both markets. It is not, and the distinction determines whether you are positioned for a trade that resolves in weeks or one that persists for years.
When big ASX news breaks, our subscribers know first
What is actually moving crude oil prices
Start with what is physically happening to oil tankers in the Persian Gulf.
- Ships divert away from the constrained zone. Shipping companies reroute tankers around the Strait of Hormuz, choosing longer, more expensive routes to avoid the risk.
- Voyages lengthen and freight costs rise. Longer transit times mean fewer deliveries per vessel per month. Freight rates climb. Regional spot supply tightens.
- Spot prices rise to reflect the constraint. Markets price in the transit disruption as a risk premium on every barrel that would normally flow through Hormuz.
That sequence describes a logistical problem, not a production collapse. The oil is still being extracted. The wells are still producing. The constraint sits between the wellhead and the refinery, not at the source itself.
Brent crude is currently trading in the mid-$80s to upper-$80s per barrel range as these Hormuz constraints persist. The US Energy Information Administration’s (EIA) Short-Term Energy Outlook projects Brent averaging around $85 per barrel in Q3 2026, citing ongoing Hormuz shipping constraints and their impact on Middle East production and inventories.
Commerzbank’s view is that restoring reliable tanker passage through the Strait of Hormuz on a durable basis would place clear downward pressure on crude prices. Forecasts indicate Brent easing toward the low $80s by year-end if conditions stabilise. Negotiations over an Iran-Oman framework for Hormuz transit had reached an advanced stage at the time of reporting, though several substantive points were still outstanding and no deal had been finalised.
The Hormuz risk premium embedded in crude prices is not symmetrically sensitive to diplomatic signals: a ceasefire announcement compresses it faster than a breakdown widens it, which means the distribution of outcomes around any single negotiating headline is skewed rather than balanced.
What this tells you about your oil-linked exposure is specific. Because the crude premium is logistical rather than structural, a credible diplomatic headline or transit agreement can move prices materially within days. If you hold upstream producers or integrated majors, you are riding a risk premium with an identifiable relief valve, and that valve can open faster than most position reviews cycle.
Why the European gas market faces a different problem entirely
The European natural gas story starts in the same place, the Strait of Hormuz, but it does not end there. Four structural conditions are compounding on top of one another, and each one makes the problem harder to resolve.
LNG bypass constraints are structurally more severe than crude oil equivalents because no pipeline infrastructure can substitute for seaborne LNG volumes at scale, a supply architecture difference that explains why the European gas market’s recovery timeline is measured in years rather than the months it may take crude shipping to normalise.
- Qatari LNG capacity is physically impaired. Attacks have damaged Qatar’s Ras Laffan LNG complex, cutting its production and exports by approximately 17%, roughly one-fifth, for an estimated three to five years. This is physical infrastructure damage that requires years of repair and reconstruction, not a rerouting problem.
- European LNG supply is structurally lower than pre-war levels. Europe pivoted heavily from Russian pipeline gas to LNG imports after 2022. Even setting aside Hormuz, the continent’s supply base is thinner than it was, and a major supplier just lost a fifth of its capacity.
- Asian buyers are outbidding Europe for cargoes. LNG is a globally traded commodity. Exporters, including those on the US Gulf Coast, route cargoes to whichever destination offers the highest price. Japan, South Korea, and other Asian buyers are currently paying more than European buyers, pulling cargoes eastward.
- European gas storage is thin relative to recent history. Low storage levels amplify vulnerability to every incremental supply disruption and every bidding war for spot cargoes.
Each of these conditions would tighten the market on its own. Together, they create a supply gap that no single agreement can close.
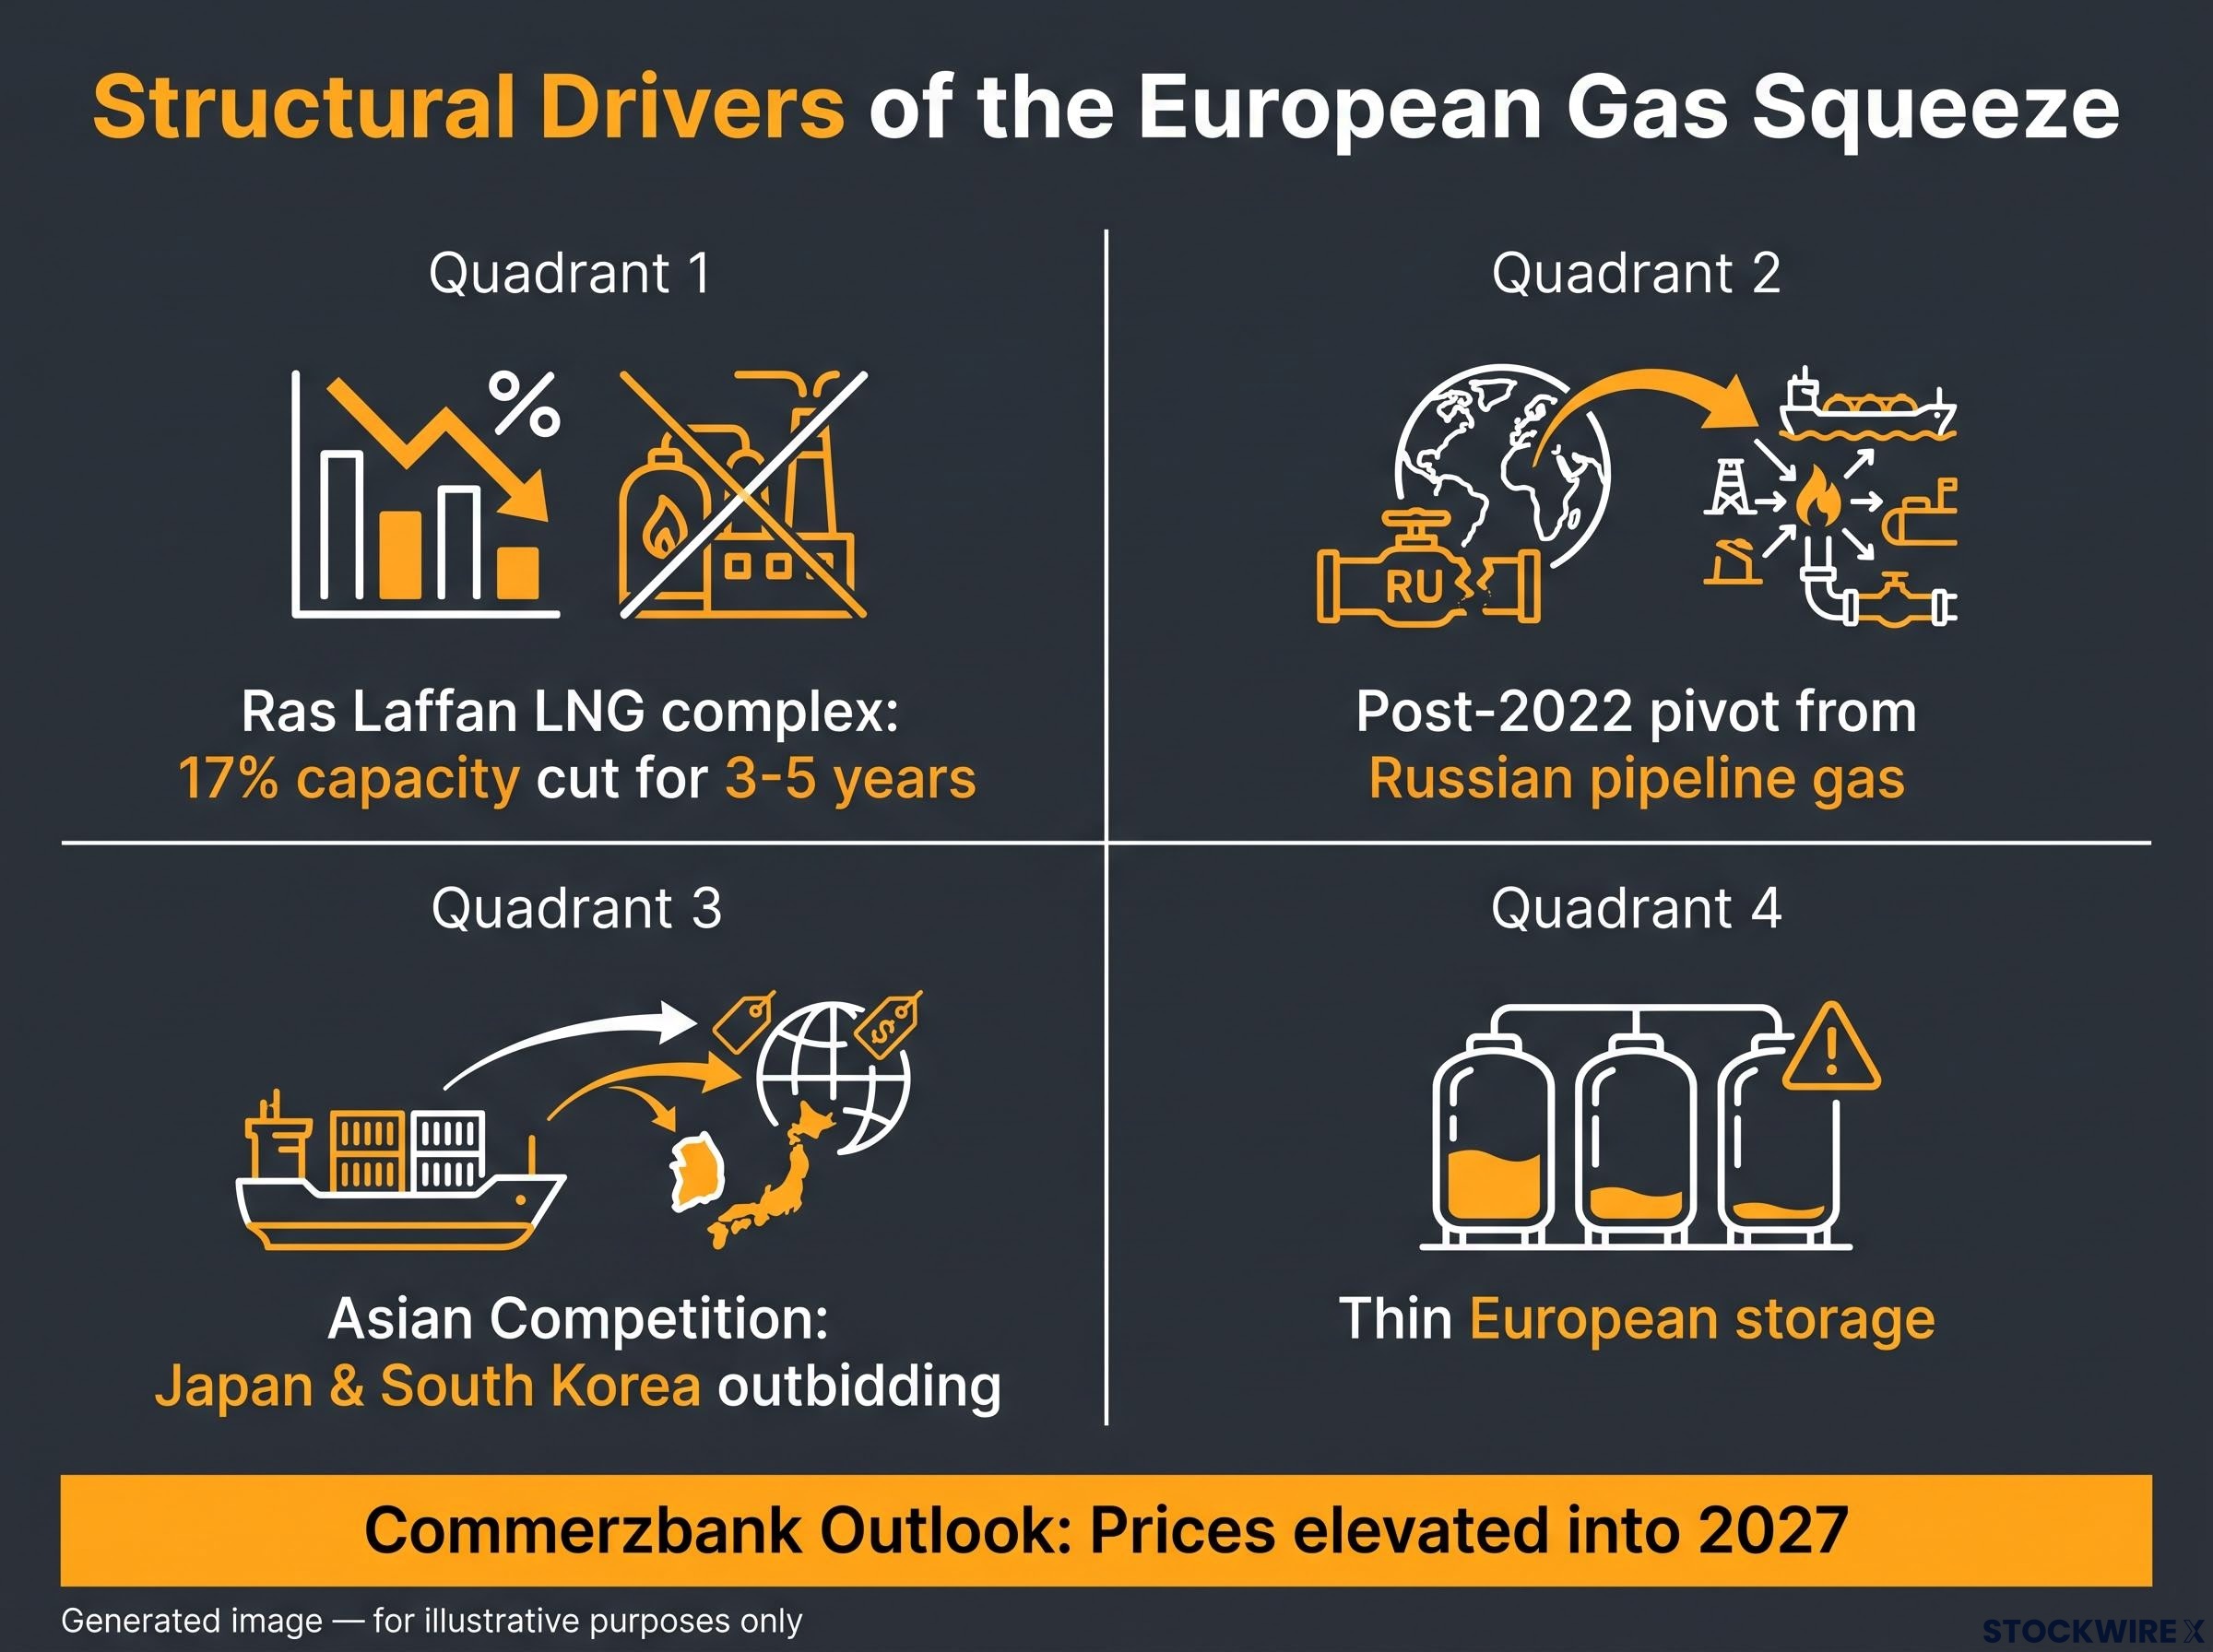
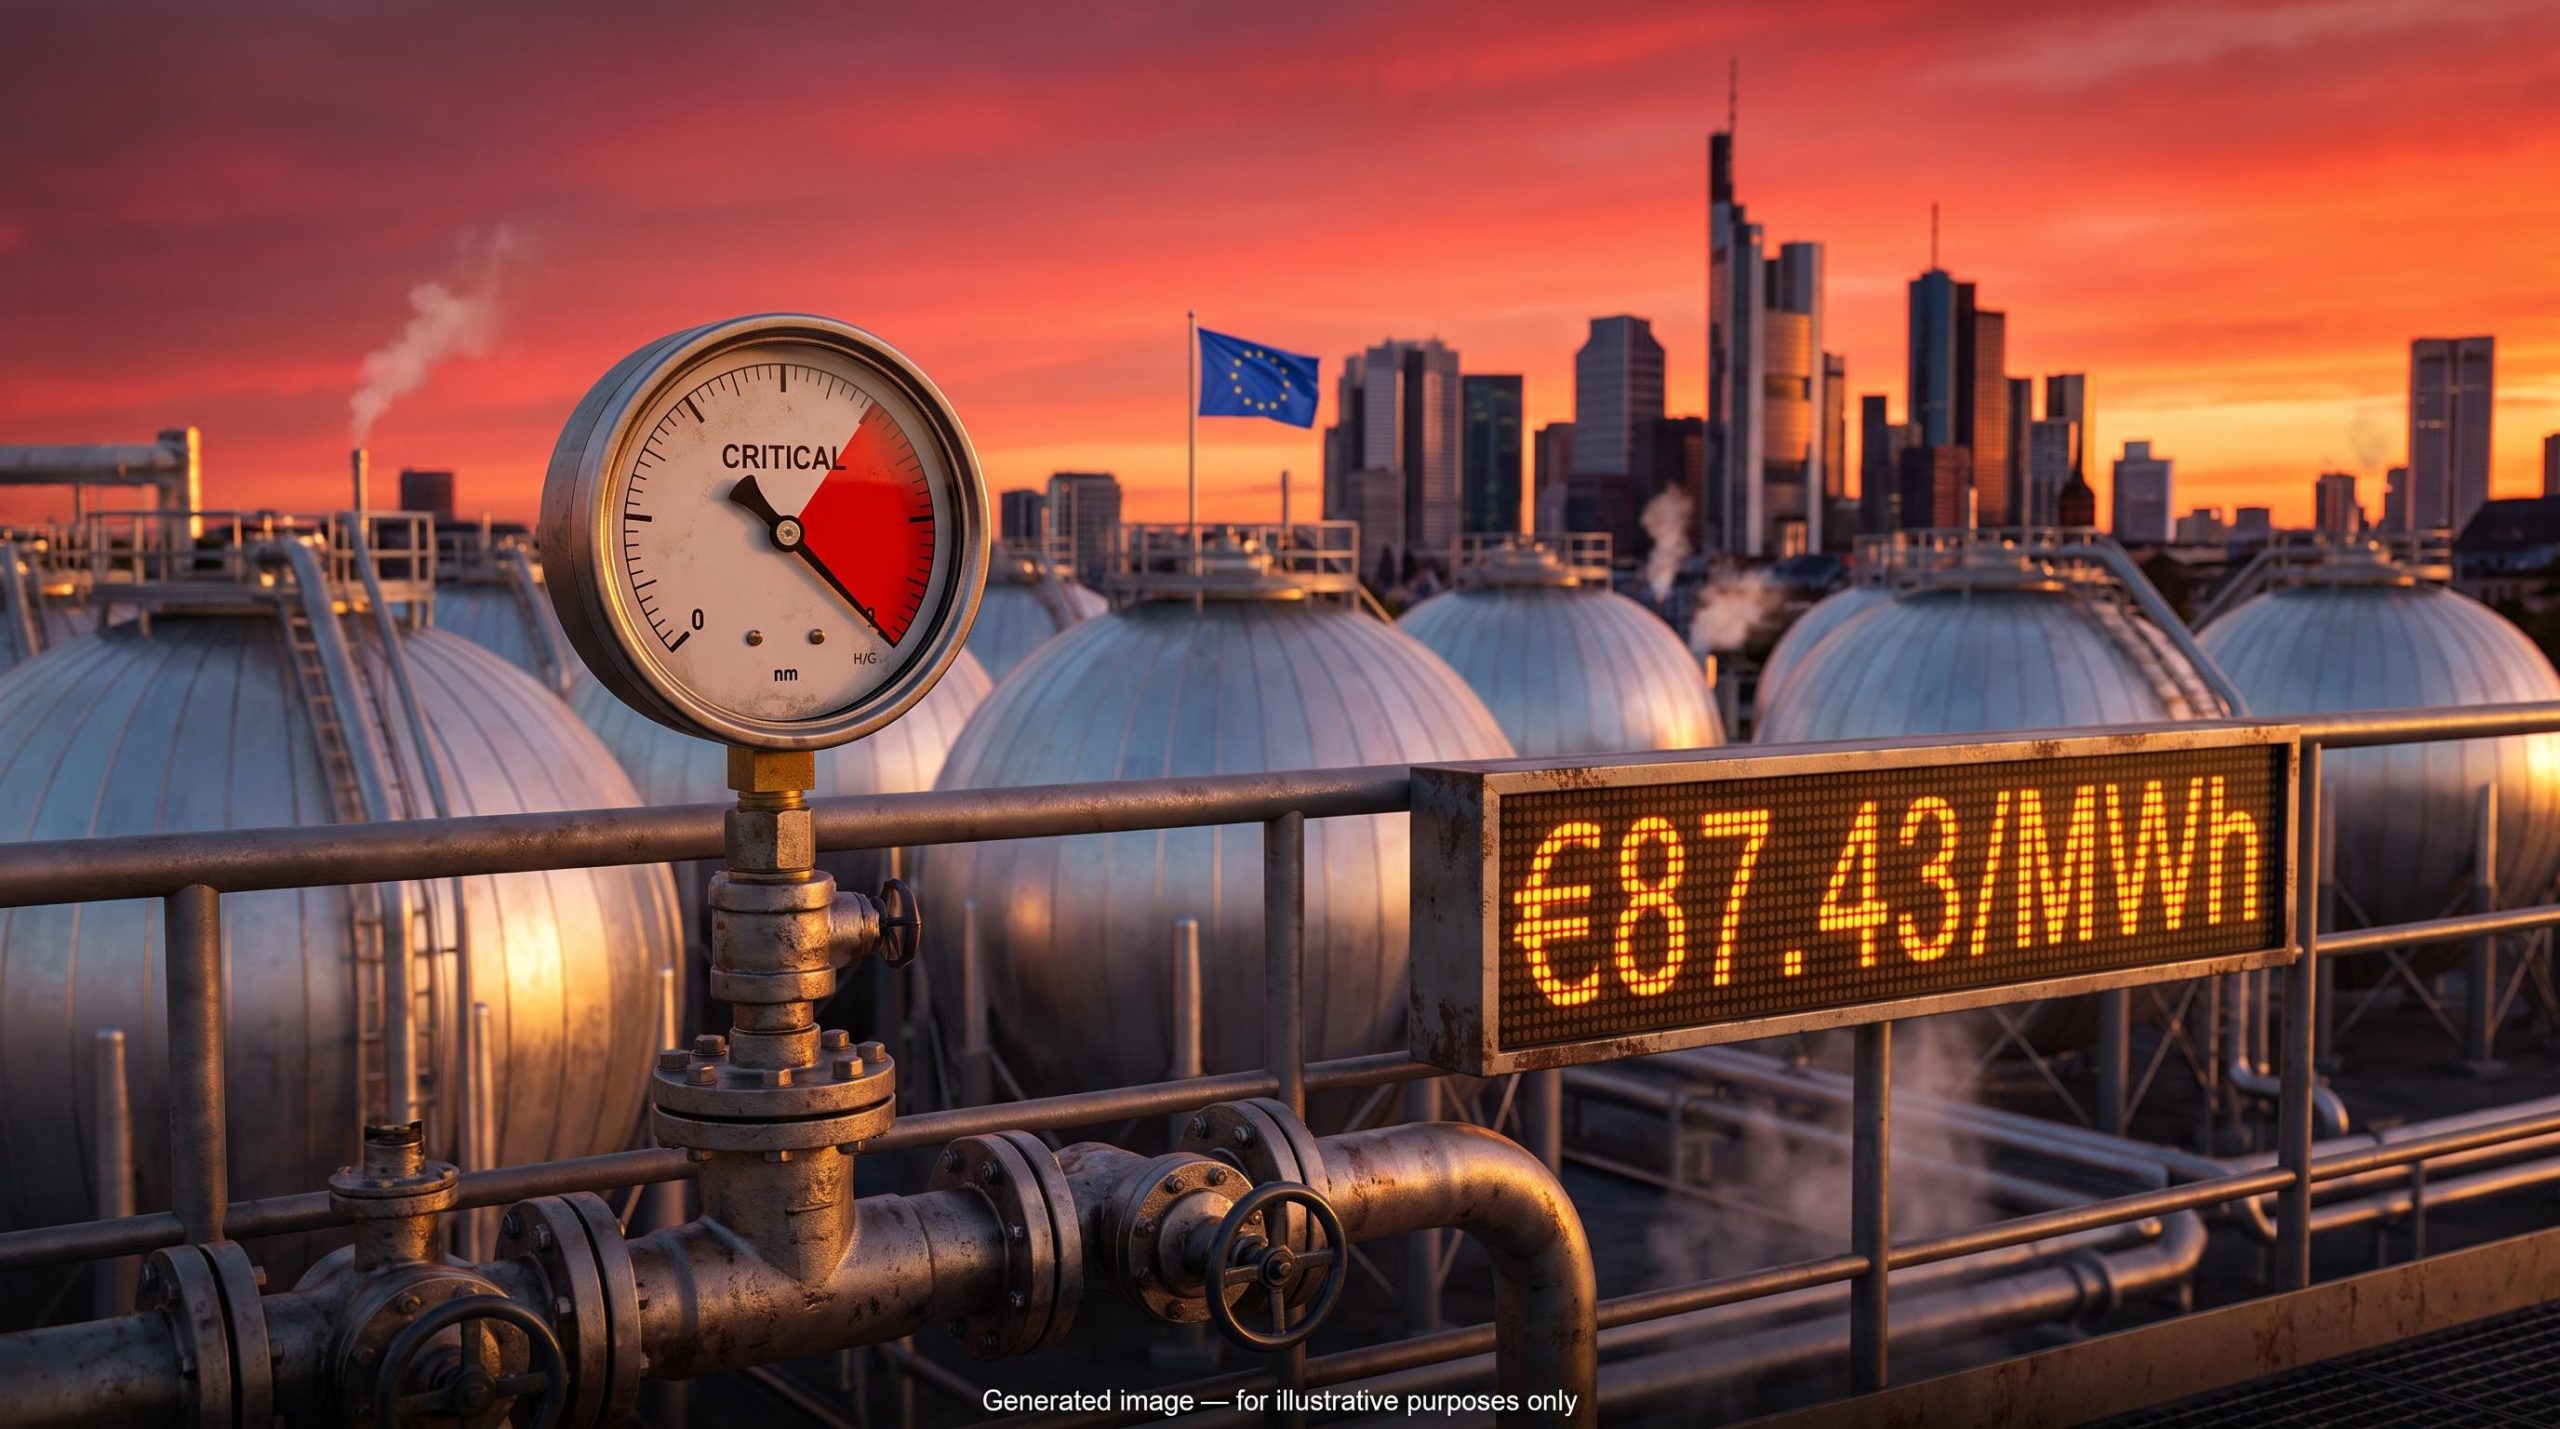
Commerzbank warns that European gas prices will remain above pre-war levels into 2027, even with near-term de-escalation in the Middle East.
Unlike oil, the gas premium has no single diplomatic lever. Even a sustained Hormuz reopening would not, on its own, return European gas prices to pre-war levels, according to Commerzbank’s assessment. What this means for your gas-linked positions, whether European utilities, LNG infrastructure names, or gas-weighted producers, is that you are exposed to a fundamentally different duration than oil investors. The gas story is structural, and recognising that is what separates informed position-sizing from reactive trading.
The divergence in plain terms: a side-by-side comparison
By now, the two mechanisms are clear. Oil is a transit problem. Gas is a capacity problem layered with a global competition problem. The comparison table below puts those differences into the six dimensions that matter most for positioning.
| Factor | Brent crude oil | European natural gas |
|---|---|---|
| Main driver | Transit disruption and shipping constraints through Hormuz | Lasting loss of Qatari LNG capacity, lower European LNG supply, and strong Asian competition for cargoes |
| Nature of problem | Mostly logistical and reversible once shipping normalises | Structural and multi-year due to damaged infrastructure and global demand trends |
| Key catalyst for relief | Normalisation of Hormuz transit and de-escalation in regional conflict | New LNG capacity from Qatar and US, higher European storage, weaker Asian demand over time |
| Geographic impact | Global crude market with broad producer and consumer base | Primarily European prices, shaped by global LNG trade patterns |
| Sensitivity to diplomacy | High: agreements can quickly reroute tankers and ease prices | Lower: diplomacy helps at the margin, but physical capacity must change |
| Timeline for relief | Relatively near-term if diplomatic progress is durable | Multi-year; Commerzbank flags 2027 as a minimum |
Two rows in that table carry the most weight for investment decisions. Sensitivity to diplomacy tells you that a single positive headline from Iran-Oman negotiations can materially compress the oil premium but leave the gas premium largely untouched. Timeline for relief tells you that even if you are right about the Middle East de-escalating, you may be right about oil and wrong about gas at exactly the same moment.
That asymmetry is the single most important insight for anyone holding both commodities inside a broad energy allocation.
What signals to watch before making a position change
Understanding the divergence is the framework. Knowing which data points to monitor is the application. The indicators that matter for oil exposure and gas exposure are different, and watching the wrong set for the wrong commodity produces false confidence.
For oil-linked positions
- Hormuz transit normalisation steps. Any concrete agreement, escort arrangement, or de-mining activity that restores standard tanker routing through the Strait.
- Progress on Iran-Oman or US-Iran negotiations. Diplomatic breakthroughs are the most direct catalyst for oil price compression. Track the specific negotiations, not general sentiment.
- Tanker routing data and freight rate trends. If tankers begin returning to standard Hormuz routes and freight rates decline, the logistical premium is unwinding in real time.
- EIA Short-Term Energy Outlook updates. The US EIA regularly revises its Brent projections based on supply flow data; these updates are a useful check on whether the market is still pricing in full Hormuz disruption or beginning to discount normalisation.
For gas-linked positions
- Ras Laffan repair timelines and capacity expansion updates. Physical repair of Qatari infrastructure is the bottleneck. Progress here, or lack of it, sets the duration of the structural squeeze.
- US and Qatari LNG project completion schedules. New export capacity is the medium-term relief valve. Delays extend the tightness; accelerations compress it.
- European gas storage fill rates versus seasonal norms. This is the most immediate near-term indicator. If storage is tracking below seasonal averages heading into winter, the pressure on spot prices intensifies regardless of what happens at Hormuz.
- Asian spot LNG prices. Prices in Japan, South Korea, and other key Asian markets are the proxy for whether cargo diversion pressure on Europe is increasing or easing. If Asian premiums widen, fewer cargoes reach European terminals.
One thing worth noting explicitly: broad energy ETFs dilute both signals. LNG-focused or European utility ETFs carry more structural gas risk with a longer expected duration. Oil-heavy funds carry more diplomatic headline risk with higher short-term mean-reversion potential. The instrument you hold determines which watchlist applies to you.
Reading the same headline twice and getting two different answers
The next Middle East headline will move both oil and gas prices in the same direction again. That correlation will feel like confirmation that these are the same trade. They are not.
Crude oil will respond more directly and more rapidly to diplomatic progress. A credible Hormuz normalisation puts Brent on a path toward the low $80s by year-end, according to current forecasts. The risk premium is real, but the constraint is logistical, and logistical constraints can be resolved faster than markets sometimes expect.
European natural gas operates on a different clock. Commerzbank’s assessment is that prices remain elevated into 2027 at minimum, even with de-escalation, because the Ras Laffan damage, the Asian cargo competition, and the thin European storage position are structural conditions that do not respond to a single diplomatic event.
The practical implication for your portfolio is specific: an investor who treats a Middle East resolution as uniformly positive for a broad energy allocation is likely to be correct about one half of that portfolio and wrong about the other. The framework that separates the transit premium from the structural squeeze is what prevents that error.
For investors holding energy-linked positions within broader multi-asset portfolios, our full explainer on oil price inflation transmission details how triple-digit oil prices move through a three-stage chain of energy costs, logistics costs, and consumer prices, with materially different pass-through speeds across advanced and emerging market economies.
This article is for informational purposes only and should not be considered financial advice. Investors should conduct their own research and consult with financial professionals before making investment decisions. Forward-looking price projections cited in this article are subject to market conditions and various risk factors. Past performance does not guarantee future results.