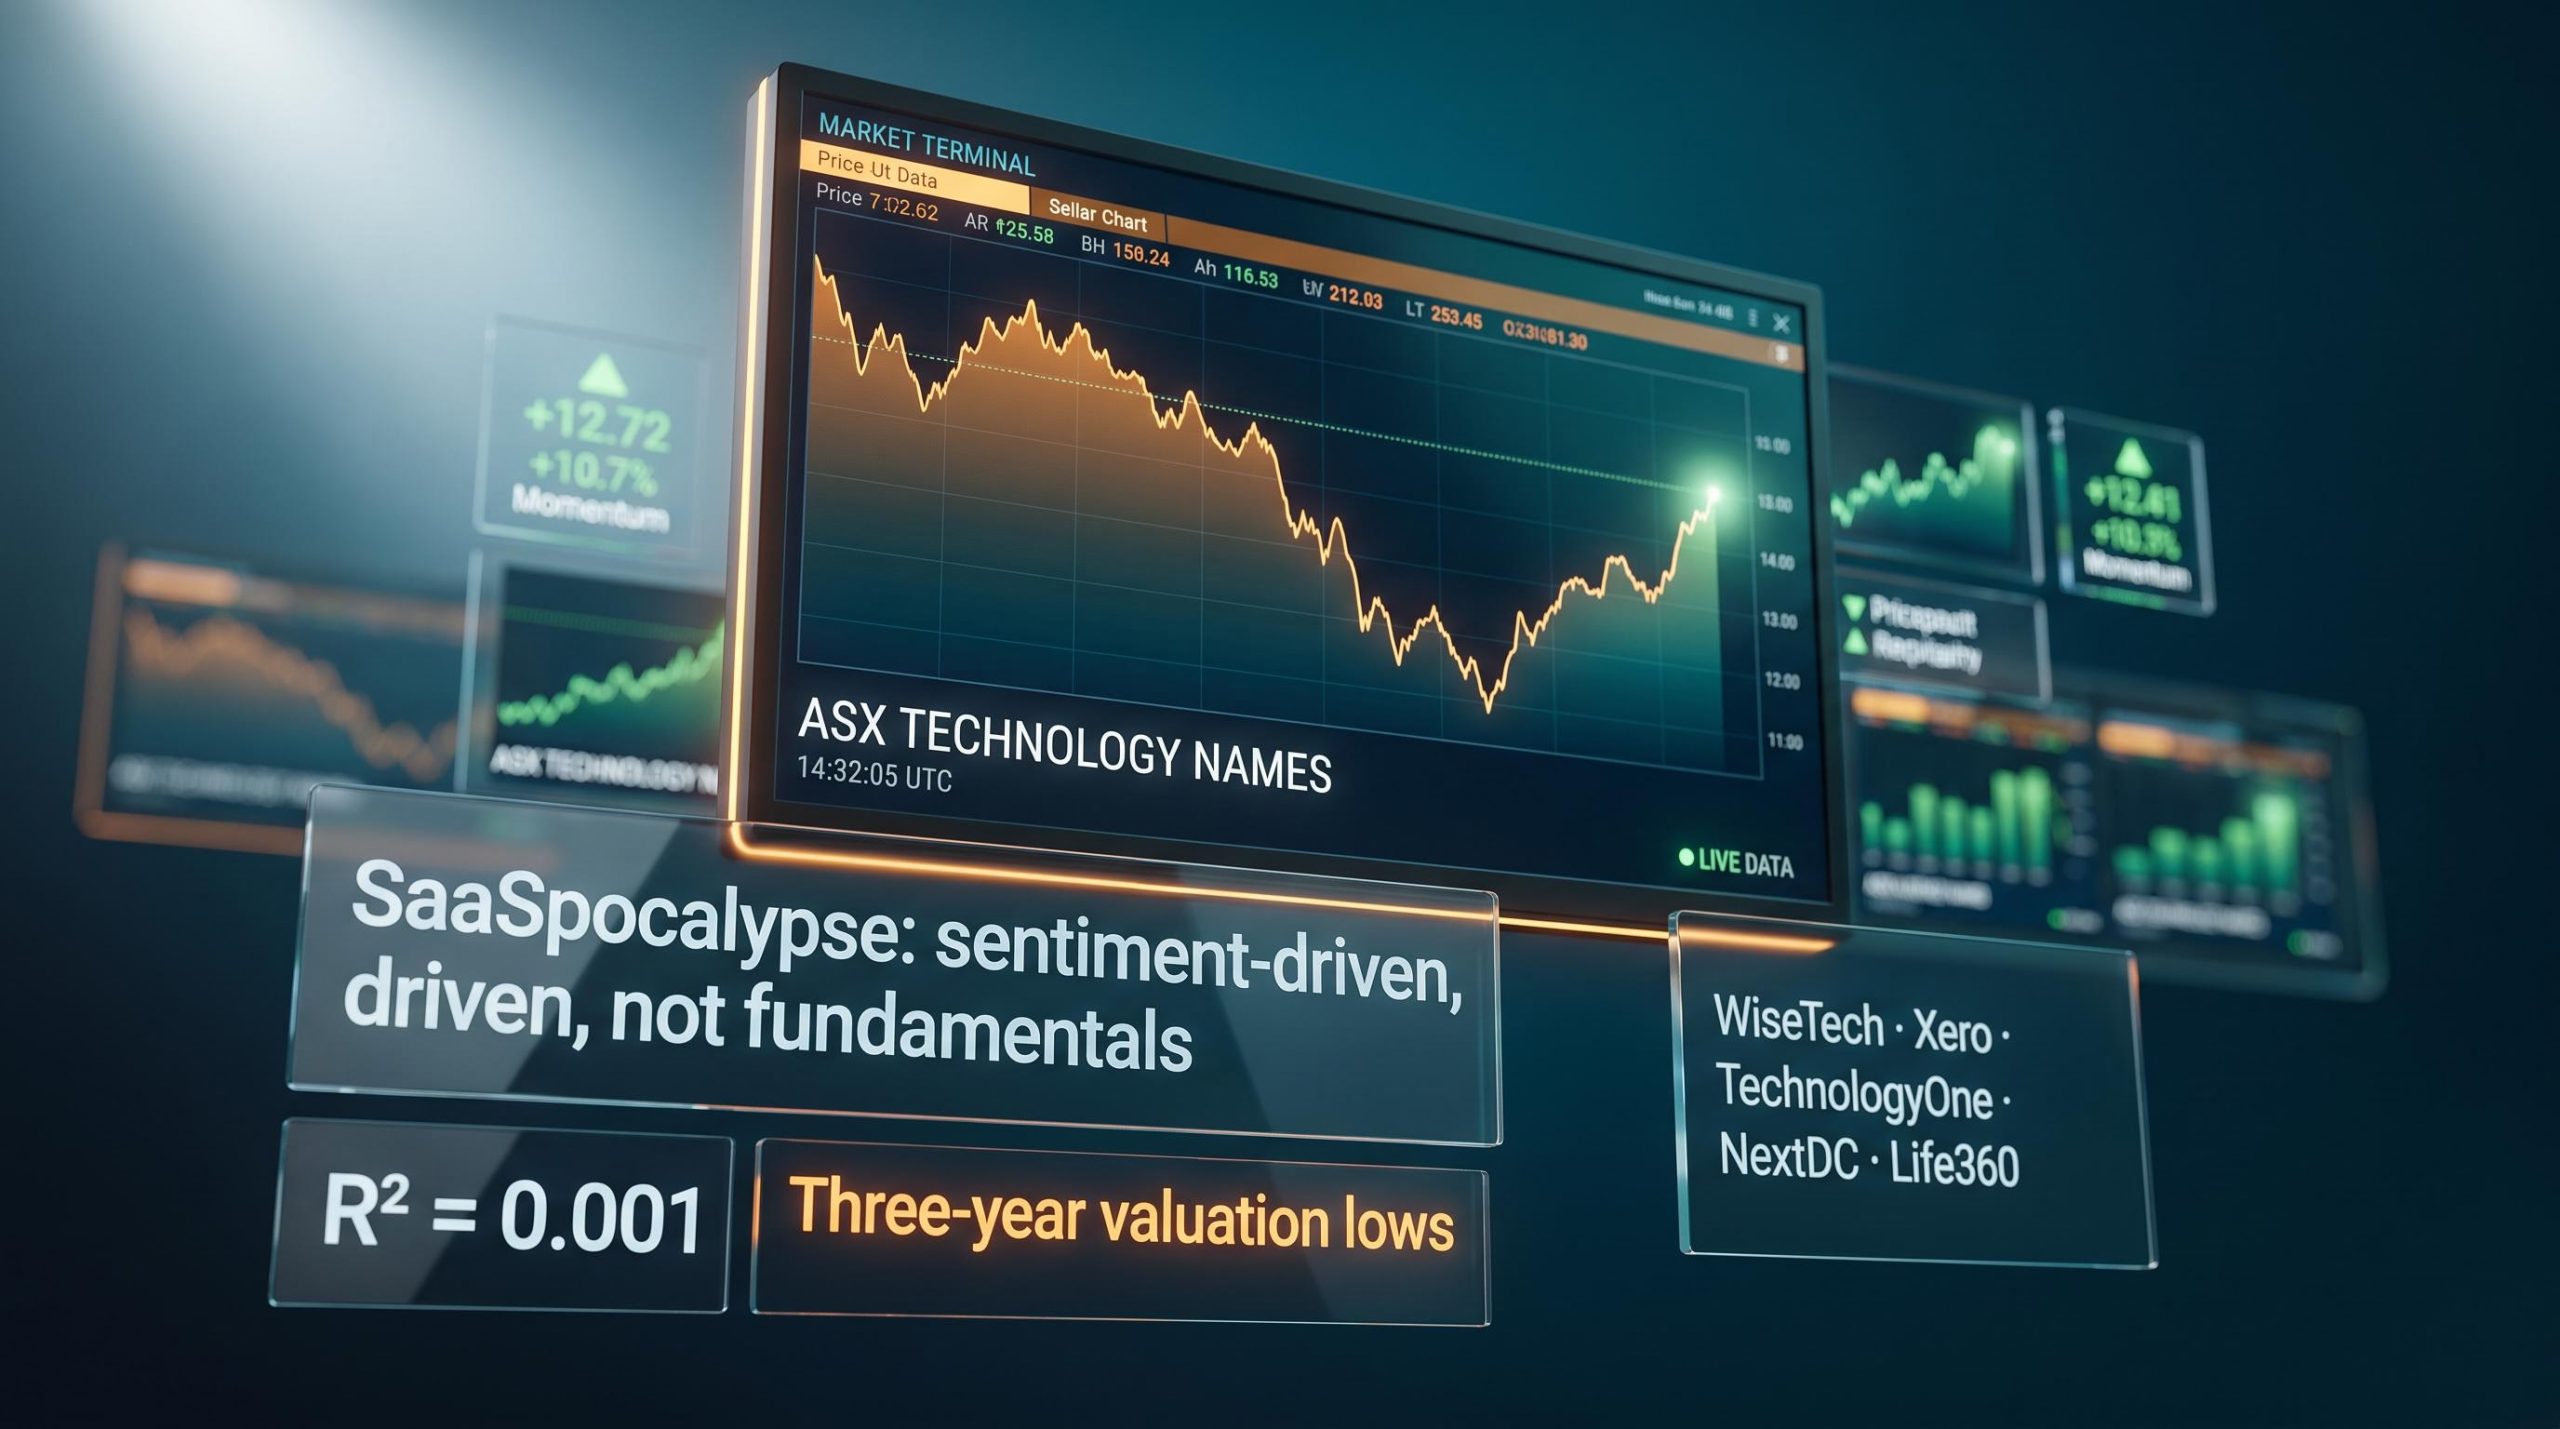
ASX tech stocks have outperformed the broader Australian market over recent months, yet the sector still trades near three-year valuation lows. Prices have moved higher, but multiples remain compressed. The numbers are telling you two contradictory things at once.
That contradiction matters right now more than usual. Morningstar’s Q3 2026 Australian Equity Market Outlook, published on 13 August 2026, identifies ASX tech as one of the only pockets of the domestic market trading at a clear discount to intrinsic value, while most Australian equities sit at a premium. The August reporting season is days away. A sector priced below fair value meeting an imminent earnings catalyst is a rare combination, and a time-sensitive one.
Here is what the evidence actually tells you about whether that discount represents opportunity or warning, and what specifically to look for when results land.
How far valuations have actually fallen
The scale of the derating is the place to start, because it determines whether the “cheap” label carries weight or is just noise.
In the Q3 2026 Australian Equity Market Outlook, Morningstar equity analyst Roy Van Keulen concluded that the ASX technology sector is deeply discounted relative to intrinsic value, a view that holds even after the sector’s recent months of outperformance against the broader index.
Roy Van Keulen, Morningstar Q3 2026: The ASX technology sector is deeply discounted relative to intrinsic value, with multiples sitting close to three-year lows in spite of the partial recovery seen in recent months.
That assessment sits against a broader market backdrop where Australian equities as a whole are trading at a premium to Morningstar’s bottom-up fair value estimates. Technology is not just cheap in isolation. It is one of the few discounted sectors in an otherwise expensive domestic market, which changes the relative positioning calculation entirely.
The broader market backdrop sharpens the contrast: ASX 200 earnings risk at the index level is acute, with an equity risk premium of just 80 basis points and the index priced for perfect earnings delivery, which is precisely the context that makes a deeply discounted technology sector a rare relative-value position rather than an isolated contrarian bet.
The names anchoring this picture are not speculative small caps. The stocks whose multiples reset to multi-year lows include:
- WiseTech Global, the logistics software provider whose premium valuation compressed sharply during the selloff
- Xero, the cloud accounting platform that had traded at elevated multiples for years
- TechnologyOne, the enterprise software group with a sticky government and education client base
- NextDC, the data centre operator whose growth outlook was repriced alongside the sector
- Life360, the family safety app whose US-listed peer multiples diverged from its ASX valuation
When quality businesses with structural competitive advantages are priced below long-run fair value in a market where most things are expensive, the starting conditions for a potential re-rating are in place. Whether that re-rating materialises depends on what comes next.
When big ASX news breaks, our subscribers know first
What the SaaSpocalypse actually was (and what it was not)
Understanding the selloff is the prerequisite for acting on the discount. If the SaaSpocalypse was a fundamentals event, today’s valuations reflect a structurally impaired sector. If it was sentiment, they reflect mispricing. The evidence points heavily in one direction.
Start with the price action itself. During the February 2026 selloff, ASX tech stocks fell sharply and broadly. The Australian Stock Report described the move as an “indiscriminate sell-down,” with capital redirected away from software names regardless of their individual business quality.
Now look at what the businesses were actually doing. MopokeCloud’s analysis of approximately 180 ASX tech companies found that one-year revenue growth explained just 0.1% of the three-month price decline during the February selloff, an R-squared of 0.001. Companies growing revenue at 10-30% were hit hardest, with average price falls of around 26.5%, while firms with declining revenue fell less.
According to MopokeCloud analysis (unverified), revenue growth explained just 0.1% of the three-month price decline across approximately 180 ASX tech stocks, implying 99.9% of the move was sentiment repricing AI disruption risk, not business performance.
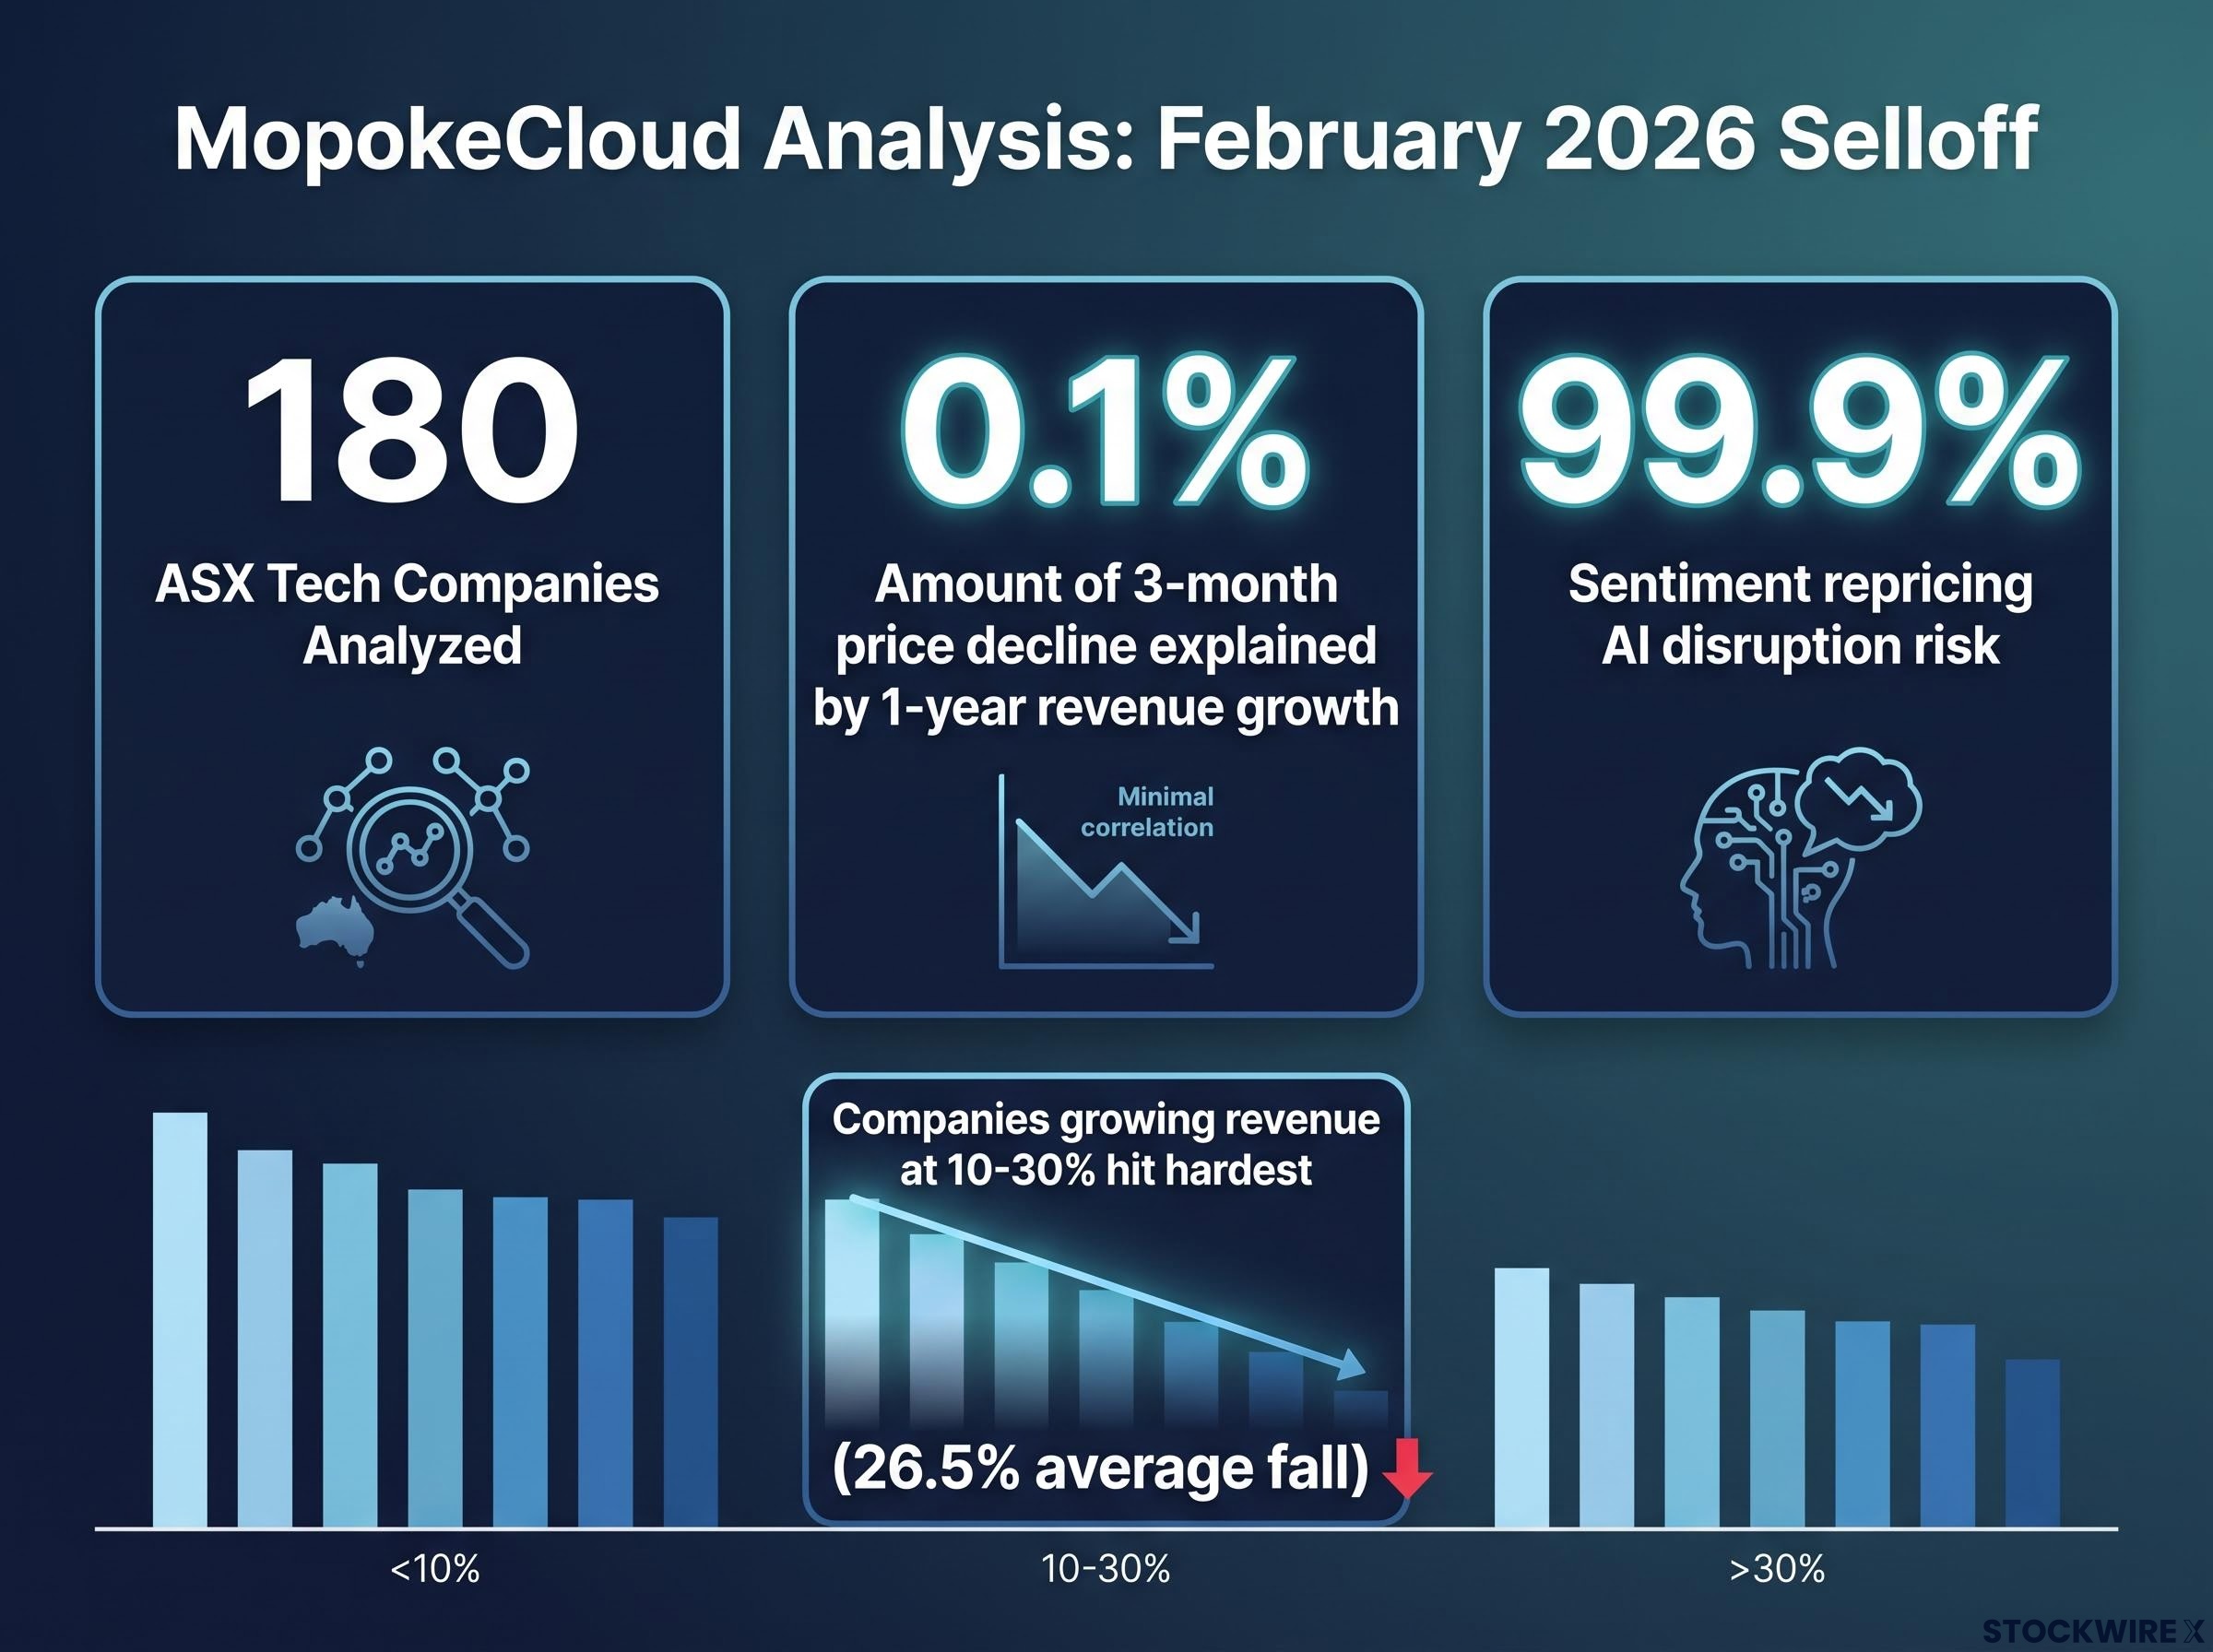
The near-zero correlation between revenue growth and share price decline tells you that the stocks punished most were punished for the wrong reasons. That is the statistical fingerprint of a sentiment event, not a fundamentals collapse.
The recovery divergence from the February selloff has already illustrated that earnings quality is the primary sorting mechanism: companies with demonstrated profitability and positive cash flow before the trough recovered materially faster than high-growth but unprofitable peers, a pattern that directly shapes which names deserve priority in a positioned approach.
The behavioural evidence reinforces this reading:
| Signal Type | What Was Claimed | What Evidence Showed |
|---|---|---|
| AI cost concerns | AI would collapse demand for software services | Companies found that the gains generated by AI adoption were not large enough to cover the associated costs; spending was pulled back accordingly |
| Workforce reductions | Job cuts were evidence of AI-driven disruption | Evidence indicated that headcount reductions at several firms were driven by pre-existing plans, with AI narratives deployed after the fact as justification |
| Hiring trends | AI should reduce the cost of solving customer problems | Software hiring volumes showed no material increase, pointing to a far more limited real-world effect from AI than the disruption narrative assumed |
Meanwhile, US software names including Atlassian, Salesforce, and ServiceNow have posted revenue figures showing renewed acceleration, with enterprise IT budgets appearing to rotate back in favour of software categories. The disruption narrative priced into ASX tech has not been matched by the evidence on the ground.
Why August results are the defining event for this thesis
The valuation discount is documented. The selloff’s sentiment-driven nature is supported by data. What remains unresolved is whether the businesses themselves will confirm that their fundamentals stayed intact through the turbulence. That answer arrives in August.
Full-year results for FY2026, alongside forward guidance for FY2027, represent the first concrete evidence test for the re-rating thesis. This is not a routine reporting season for ASX tech. It is the moment when the gap between depressed prices and underlying business value either begins to close, or it widens.
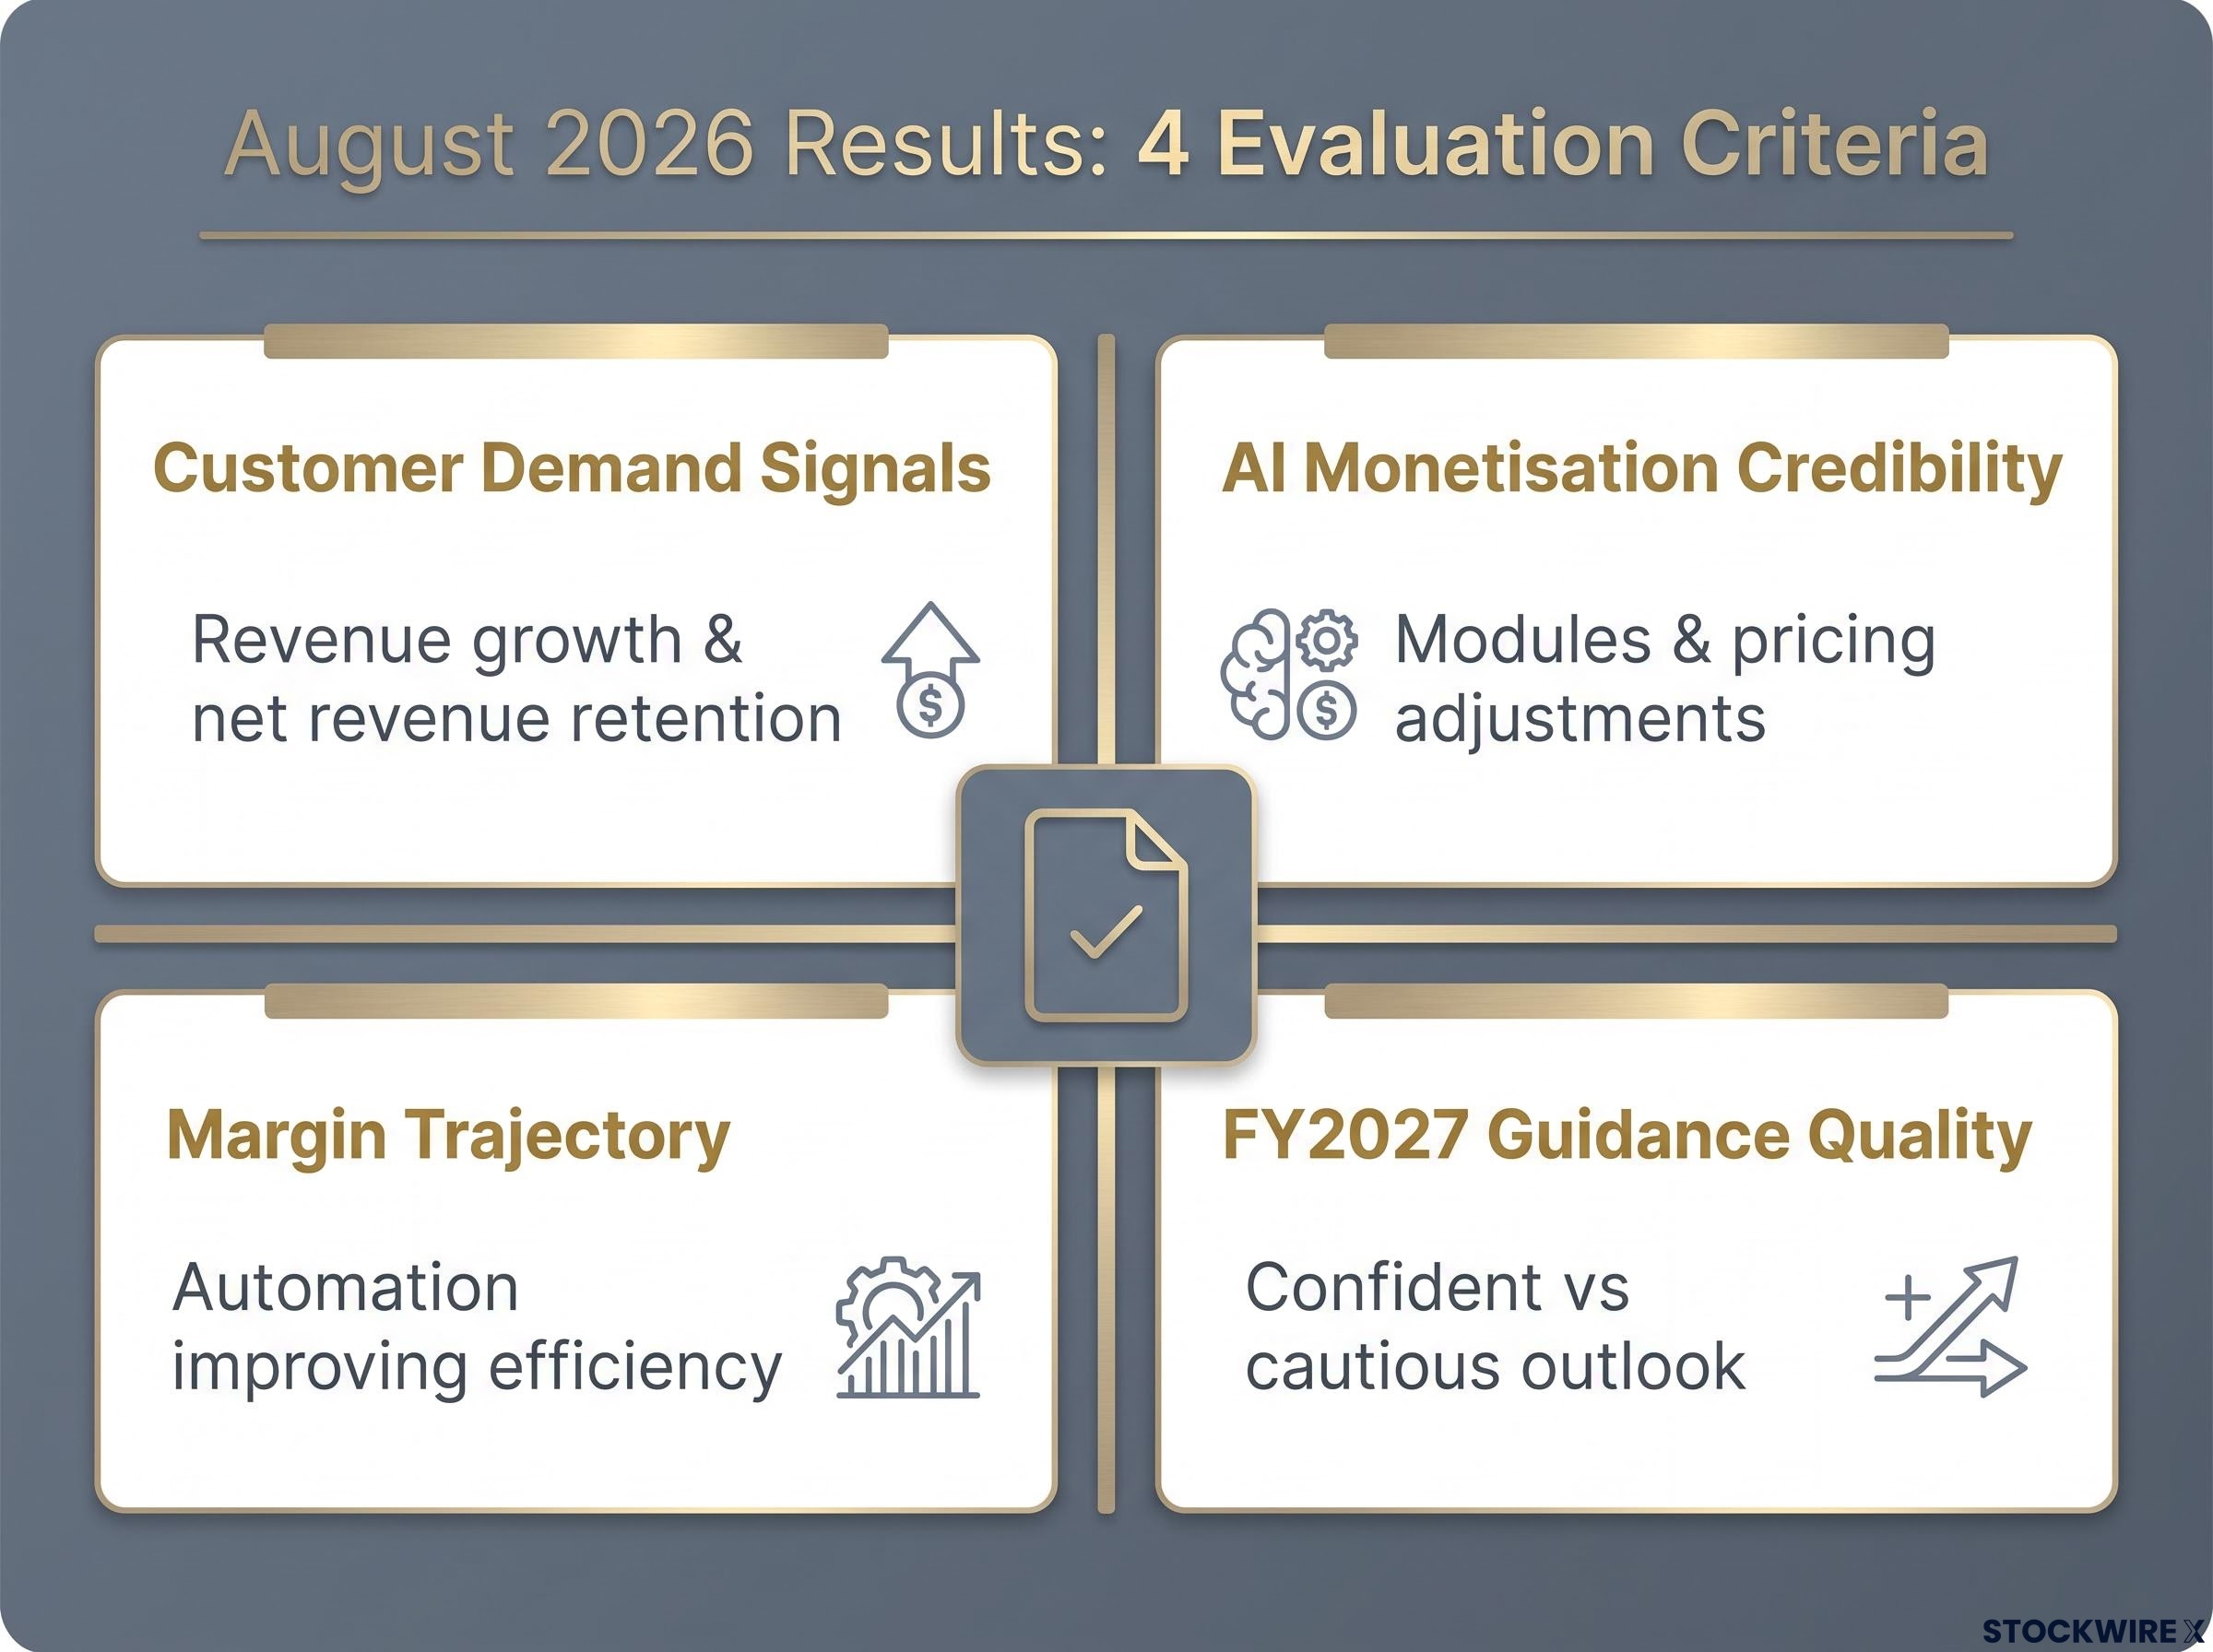
Four specific evidence areas should structure how you evaluate results:
- Customer demand signals: Revenue growth and net revenue retention will show whether enterprise clients are expanding contracts or still pulling back. Strong numbers from workflow, data, and compliance software providers would validate the post-SaaSpocalypse recovery narrative directly.
- AI monetisation credibility: Watch for concrete plans to monetise AI, including new product modules, pricing adjustments, and product stickiness improvements. Vague or purely defensive AI commentary will likely keep valuations compressed regardless of top-line performance.
- Margin trajectory: Evidence that AI and automation are improving development efficiency and operating margins would justify higher growth multiples over time, giving the market a reason to re-rate beyond just revenue recovery.
- FY2027 guidance quality: This is arguably the most important signal. Confident, specific guidance tells the market that management sees durable demand. Cautious or heavily caveated outlooks could extend the discount even if FY2026 results look solid.
Morningstar’s Q3 2026 outlook observes that concentrated market conditions and short-term volatility spikes are causing share prices to diverge further from underlying business value, a dynamic that sharpens both the opportunity and the risk for investors making decisions around results season.
For you, the positioning decision before versus after results carries meaningfully different risk profiles. Going in with clear evaluation criteria transforms a passive watching brief into an active analytical framework.
The bull case, the bear case, and the honest balance
The setup has merit. It also has risks. Treating either side as irrelevant is where most investor errors on this trade will come from.
| Bull Case | Bear Case |
|---|---|
| Sector trades at a clear discount to fair value in a premium-priced broader market | Event risk around August results is real; a weak print could sustain or deepen the discount |
| The SaaSpocalypse selloff was sentiment-driven, not fundamentals-driven | Genuine long-term uncertainty persists about AI’s second- and third-order effects on software pricing |
| Quality names are attracting capital back at discounted valuations | Cautious FY2027 guidance could delay any re-rating by multiple quarters |
| US software peers are showing renewed revenue acceleration | AI disruption fears, while overstated so far, may prove partially correct over a longer timeframe |
The honest synthesis sits between the two columns. The valuation discount is real and well-documented. The sentiment-driven nature of the selloff is supported by data. The quality of the businesses involved is not in question. That combination creates a genuine margin-of-safety setup for medium-term investors.
The record 133-percentage-point spread between the top and bottom deciles of US technology stocks in 2026 confirms that selectivity across software names matters far more than a binary sector-level view, a dynamic that applies with equal force to the quality-tiered ASX tech names at the centre of the re-rating thesis.
But the timing is uncertain. August results are a binary event for individual stocks, and weak guidance from even one or two prominent names could drag sentiment back across the sector. The opportunity is real; it is not risk-free.
What this tells you is that the quality of your outcome depends more on how you position, including sizing, sequencing, and stock selection, than on whether the thesis is broadly correct.
How to think about positioning if the thesis holds
If the analytical case holds up, the question shifts from “is there an opportunity?” to “how do I express it without taking unnecessary risk?” Four principles structure the answer:
- Prioritise quality over broad sector exposure. The opportunity is in profitable, cash-generative businesses with structural competitive advantages, including switching costs, network effects, and pricing power. Names like WiseTech, Xero, TechnologyOne, NextDC, and Life360 represent this quality tier. Speculative names that only look cheap because their growth prospects are genuinely deteriorating are a different proposition entirely.
- Treat August as a planned volatility event. A staggered buying approach, taking partial positions before results and topping up after, converts the reporting season from a binary bet into a sequence of informed decisions. That is structurally more sound than any single entry point, and it respects the genuine uncertainty around individual stock outcomes.
- Match exposure to your investment horizon. Medium- to long-term investors who can hold through multiple reporting cycles are far better placed to benefit from a potential re-rating than short-term traders facing binary outcomes around each earnings release. If your horizon is weeks, this is not your trade.
- Size positions to reflect residual uncertainty. The valuation discount is the core rationale, but AI’s ultimate impact on software demand and pricing is still evolving. Position sizing and diversification should acknowledge that the thesis may take longer to play out than expected, or may prove partially rather than fully correct.
This article is for informational purposes only and should not be considered financial advice. Investors should conduct their own research and consult with financial professionals before making investment decisions.
What the next reporting cycle will confirm or challenge
August 2026 results are the first real stress test, not the final verdict. Strong revenue, credible AI monetisation plans, and confident FY2027 guidance would meaningfully close the gap between current prices and analyst fair value estimates. But even a strong set of results is unlikely to trigger a full re-rating in a single event.
The more likely path is that the re-rating, if it comes, unfolds across multiple reporting cycles. Each set of results either reinforces the thesis incrementally or introduces new questions. FY2027 guidance is the signal to weight most heavily in near-term assessments, because it tells you whether management teams see durable demand or temporary recovery.
The core tension the evidence has built across this analysis is clear: ASX tech sits in the unusual position of being one of the cheapest parts of an expensive market, at the precise moment when business fundamentals are about to be retested. That combination is rare.
Morningstar’s August 2026 “Chart of the Week” report describes the sector’s partial recovery from the SaaSpocalypse as a “SaaSurrection,” a framing that captures the view held by analysts that investors willing to hold through volatility and positioned around fair value stand to benefit as the cycle progresses.
The investment case here is not a prediction about what August will deliver. It is a view about whether business quality justifies the current gap to fair value, and the reporting season is the evidence-gathering process that will test that view over time.
For investors wanting to model the second-order effects of hyperscaler AI spending on enterprise software demand, our deep-dive into the AI capital expenditure cycle examines the substitute-versus-complement framework that separates structurally durable software businesses from those facing genuine displacement risk.
Past performance does not guarantee future results. Financial projections are subject to market conditions and various risk factors.