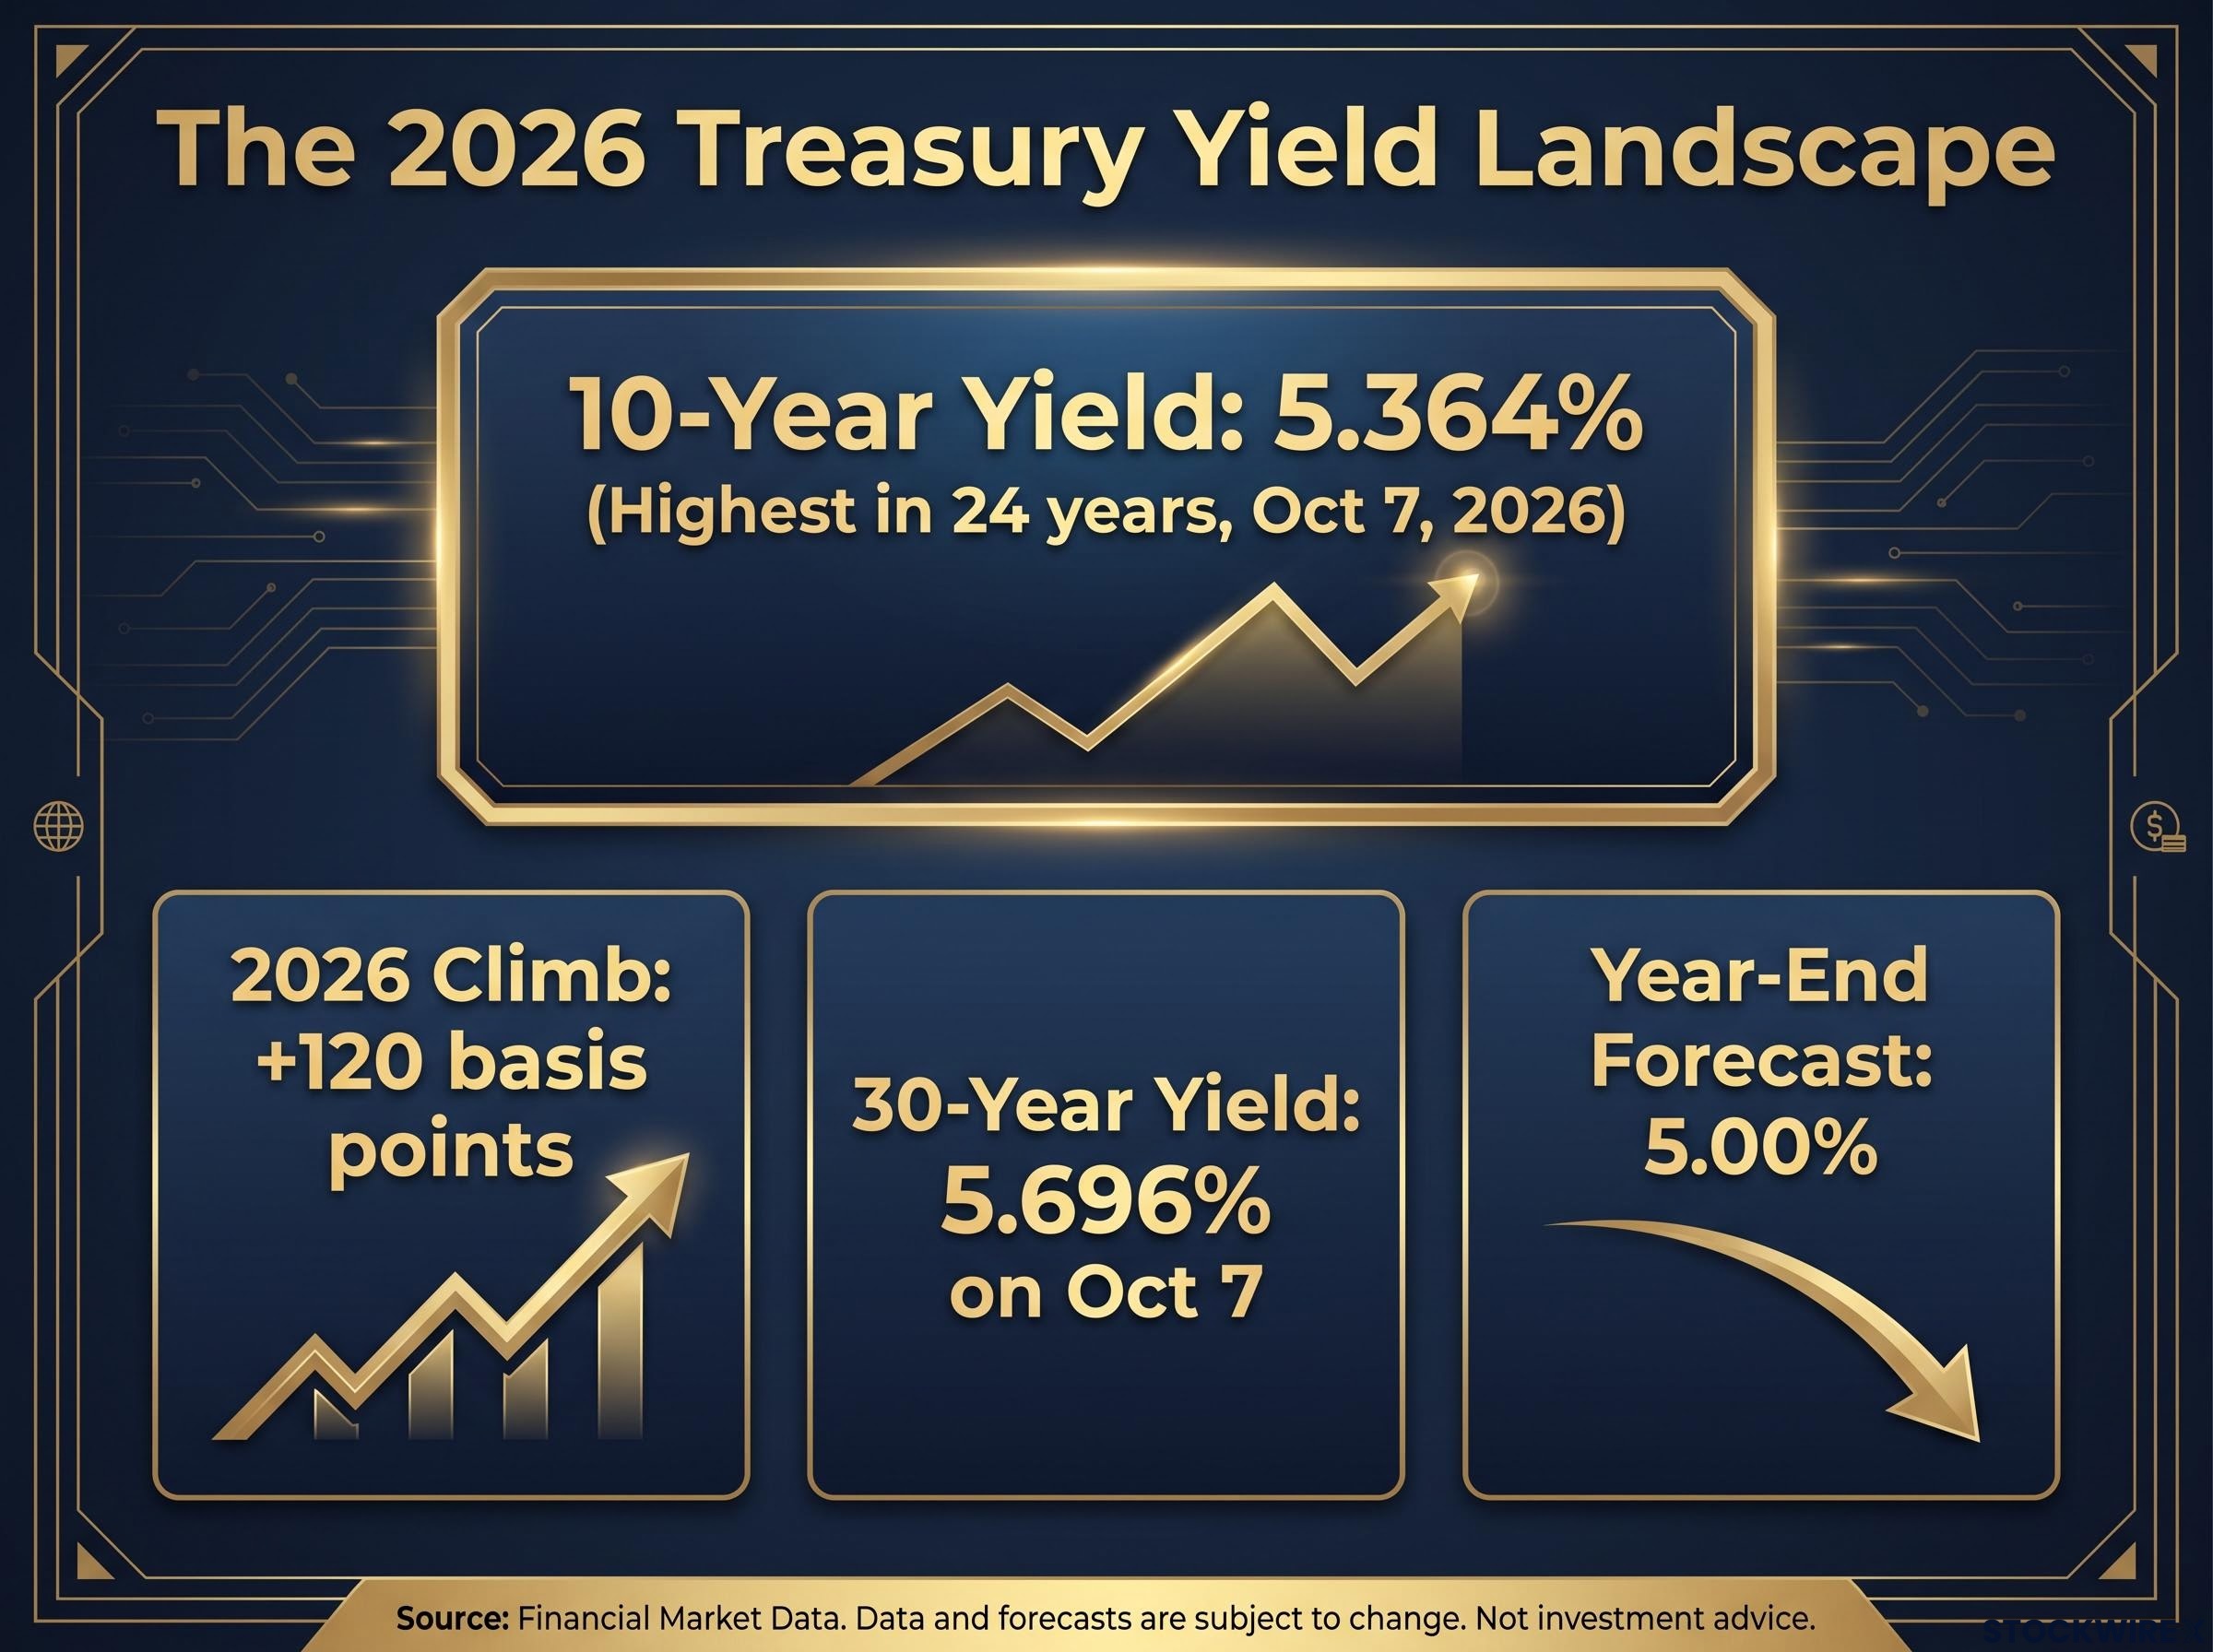
The 10-year Treasury yield touched 5.364% on 7 October 2026, its highest level in 24 years. Meanwhile, the economic calendar before the US election is close to empty. When few other events are scheduled, the bond market tends to drive the mood across most other assets.
The pressure has been building for months. According to Reuters, the September quarter was Treasuries’ worst since 1994, and the 10-year yield has climbed almost 120 basis points in 2026. A basis point is one-hundredth of a percentage point, so that is a rise of nearly 1.2 percentage points.
Three dates matter most from here. September’s consumer price index (CPI) lands on 14 October, the Federal Reserve is widely expected to hold rates later in the month, and the 3 November election follows.
Here is how a move in yields reaches utilities, Bitcoin and bank stocks, which of the coming events carry real weight, and what would change the picture.
Why do long-end yields move everything else?
The headline numbers are stark. On 7 October, Reuters reported the 30-year yield also touched 5.696%, another 24-year high. By the next day, both had eased slightly, though the readings depended on who was measuring.
| Date | Source | 10-year yield | 30-year yield |
|---|---|---|---|
| 1 October 2026 | Reuters (intraday high) | 5.31% | Above 5.65% |
| 7 October 2026 | Reuters (intraday high) | 5.364% | 5.696% |
| 8 October 2026 | Reuters via Fidelity (late morning) | 5.305% | 5.666% |
| 8 October 2026 | Reuters (afternoon, after 30-year auction) | 5.227% | 5.602% |
| 8 October 2026 | US Treasury constant-maturity table | Just under 5% | 5.60% |
The gap between the Treasury’s official 10-year figure and Reuters’ intraday quotes matters. The official close is the primary reference, while intraday readings capture the sharper swings within each session. Reuters and CNBC link the sell-off to inflation that has proved more stubborn than expected and to worries about deficits and government borrowing. Reports of oil above $100 a barrel have also been cited, though that figure has not been independently confirmed.
Because the coupon on an existing bond is fixed, any fall in its price mechanically lifts its yield, which is why the way bond yields move in a sell-off feels so abrupt to equity investors.
How the three channels work
CNBC describes the 10-year and 30-year yields as yardsticks for borrowing costs and asset prices worldwide. The bond sell-off reaches other markets through three main channels:
- Higher term premium: The term premium is the extra return investors demand for holding long-dated debt instead of rolling short-term debt. Heavy government issuance pushes it up, which lifts borrowing costs across the economy.
- Higher real yields: A real yield is the return on a bond after inflation. When a risk-free Treasury pays more, a stock’s dividend or earnings yield looks less attractive by comparison.
- Delayed rate cuts: If the Fed stays restrictive for longer, the valuations of long-duration growth stocks and rate-sensitive sectors tend to compress.
Together these channels raise the bar that every risky asset has to clear. For you, that means even good company news can fail to lift a share price, because the safe alternative now pays more.
Market commentators in the source discussion said traders are rationalising yields around 5.3%, but a touch of 5.5% could trigger a market drop. Comparisons with the 1994 bond sell-off, the 2013 taper tantrum and the Q4 2018 rate scare are common, although those parallels have not been independently confirmed.
Overshoot or new plateau?
Not everyone sees an open-ended threat.
Reuters strategists’ poll (5-7 October) The median forecast has the 10-year yield falling about 30 basis points to around 5.00% by the end of 2026, and to 4.75% over the next year.
If that forecast proves right, the current spike would be an overshoot rather than a new floor. The open question for you is timing: a retreat in yields by December does not stop them from testing 5.5% first.
When big ASX news breaks, our subscribers know first
Can utilities hold at resistance while yields climb?
Utilities show how quickly a move in bonds can turn into a sector trade. They behave as bond proxies, meaning their steady cash flows and high dividends make them compete directly with Treasuries for income-focused money. When Treasuries pay more, utility dividends look less appealing.
The pressure also reaches earnings. Regulated utilities borrow heavily to fund grid upgrades, transmission lines and renewables, so higher financing costs squeeze both profits and balance sheets.
The short setup at resistance
The commentator in the source discussion called the Utilities Select Sector SPDR Fund (XLU) an attractive short. XLU bottomed a couple of weeks ago and then rallied quickly into overhead resistance that has capped prices for well over a year. Resistance is a price zone where earlier rallies stalled because sellers came in.
His reasoning rests on who owns the fund. Fast falls and fast recoveries suggest few committed holders, and owners trapped since earlier highs may sell as soon as they can break even. He also pointed out that Dow-related indexes (industrials, transports and utilities) have broken down while the Nasdaq Composite and Nasdaq 100 have not, and recalled utilities and small caps forming reversal patterns before the financial crisis.
The current XLU price and its distance from multi-year highs could not be confirmed from dated public sources, so the setup is best judged on structure rather than exact levels.
What could break the thesis
The bearish case has real opponents. Data-centre build-outs for artificial intelligence, along with electrification through electric vehicles and heat pumps, may lift power demand enough to offset the valuation drag from higher rates.
| Factor | Bearish read | Bullish read |
|---|---|---|
| Treasury yields | Higher yields make dividends less attractive | Strategists see yields easing toward 5.00% |
| Financing costs | Capital-heavy projects become more expensive | Demand growth may support returns on new spending |
| Chart structure | Rapid rebound into long-standing resistance | Broad bounce in staples and rate-sensitive names |
| Earnings outlook | Higher rates squeeze margins | AI and electrification may lift power demand |
The bounce has also been broad. McDonald’s, Pepsi, Constellation Brands (STZ) and C.H. Robinson (CHRW) were all up during the session, and the commentator observed that the bond decline appears to be slowing, though he does not expect a big rally.
That leaves the core point. The XLU short is a bet on rates as much as a chart pattern, and it fails if yields fall or if AI-driven demand outweighs the cost of capital.
Could a bigger bond move revive the Bitcoin flow story?
Bitcoin and related stocks look undecided. The hosts of the source discussion argued that a larger move in bonds could revive the story of money flowing into the asset. Michael Saylor’s daily AI-made promotional videos show that enthusiasm remains, even while prices lack direction.
Yield direction has recently moved gold and Bitcoin in the same session, with one Treasury buyback announcement in August lifting both sharply, which shows how directly bond moves can steer non-yielding assets.
Three frameworks compete:
- Headwind view: Higher real yields raise the opportunity cost of holding an asset that pays no income. Above 5%, the 10-year tightens financial conditions and drains speculative money. Some reports attribute this framing to JPMorgan and Goldman Sachs, though that has not been confirmed.
- Supportive view: If long-end yields retreat and the curve bull-flattens (long-term yields fall faster than short-term ones), risk appetite could improve and renew inflows into the US spot Bitcoin exchange-traded funds (ETFs) launched in 2024.
- Sceptical view: ETF flows reflect structural adoption, regulatory comfort and integration into wealth-management platforms more than small changes in yields.
The sceptics’ strongest point Spot Bitcoin ETF flows have at times stayed strong while yields were rising, which suggests lower yields alone do not guarantee renewed demand.
Current Bitcoin prices and ETF flow figures were not available from dated public sources. Treat falling yields as a necessary but not sufficient condition, and watch the ETF flow data rather than assuming a rally follows a bond bounce.
What does the pre-election calendar mean for yields and stocks?
With few events between now and 3 November, each scheduled release carries more weight than usual.
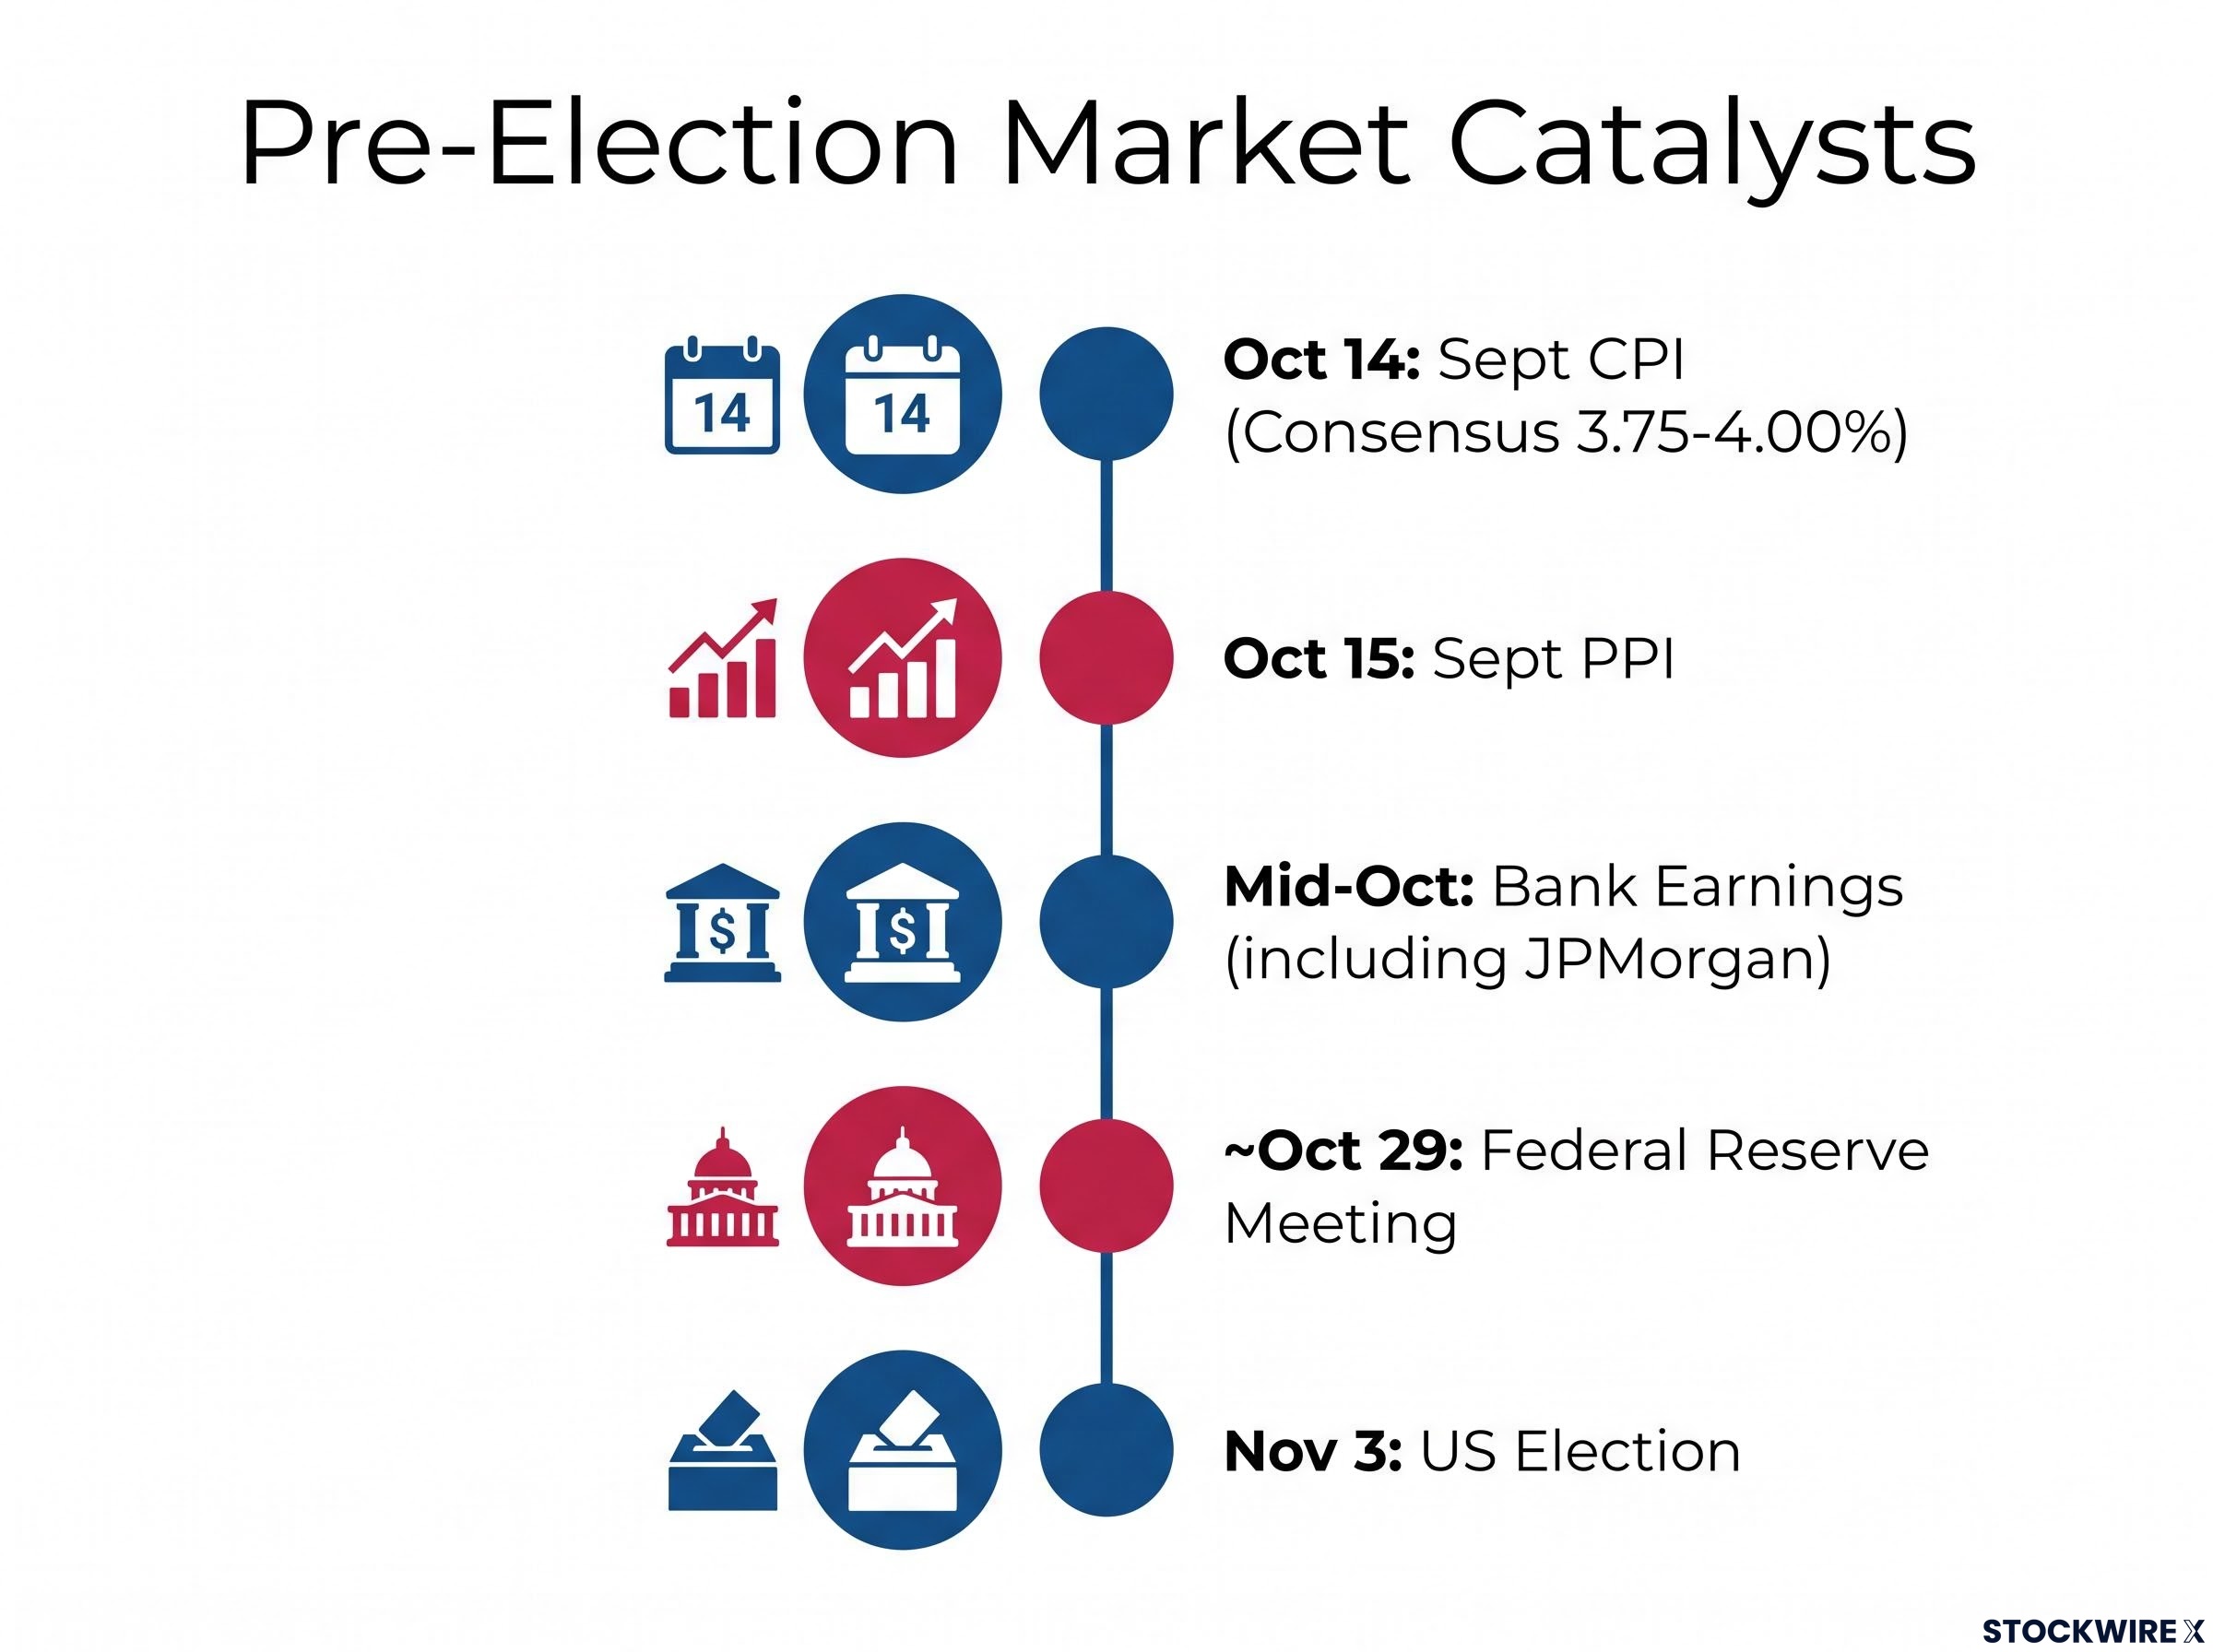
| Date | Event | Why it matters |
|---|---|---|
| Wednesday 14 October, 8:30 a.m. ET | September CPI | Last major data point before the election; consensus roughly 3.75-4.00% year on year |
| Thursday 15 October, 8:30 a.m. ET | September producer price index (PPI) | Wholesale inflation check; consensus unavailable |
| Mid-October | Bank earnings, including JPMorgan | First read on how banks handle multi-decade-high yields |
| Around 29 October | Federal Reserve meeting | Commentator expects a hold until after the election |
| 3 November | US election | Fiscal policy uncertainty |
CPI stands out. A hot reading would confirm the stubborn-inflation story driving the sell-off, while a soft one could support the strategists’ overshoot case. The current fed funds rate, a confirmed meeting date and market-implied odds of a hold could not be verified.
With CPI accelerating through 2026, bond market stress has become a stronger forcing mechanism on Washington than equity drawdowns, since rate cuts are no longer available as a circuit breaker.
Bank earnings add a second test. According to the source discussion, options imply a move of about 11 points in JPMorgan shares, roughly 3%, and one host believes that is too low. Analysts watch loan demand, credit quality and market-making revenue, alongside funding costs, unrealised losses on bond holdings, and credit risk in commercial property and leveraged finance, although that framing has not been independently confirmed.
If yields push to 5.5%, several risks could combine:
- A hot CPI print that pushes rate-cut hopes further out.
- Bank results that reveal pressure from funding costs or unrealised losses.
- Signs of election-year fiscal loosening that add to borrowing worries.
- Pressure on bond proxies already sitting at resistance.
For the week ahead, CPI is the single event most likely to move yields, and with them utilities and Bitcoin.
Past performance does not guarantee future results. Forecasts are subject to market conditions and various risk factors, and forward-looking views may change with market developments.
Reading the yield signal before the vote
Yields link the utilities setup, the Bitcoin flow debate and bank earnings. CPI on 14 October is the nearest test of which way they break.
The balance cuts both ways. A touch of 5.5% is a real risk that commentators link to a broader pullback, yet the Reuters poll median has the 10-year easing toward 5.00% by year-end. Both can be true if yields overshoot before they settle.
Three variables give you the clearest read:
- Where the 10-year trades relative to the 5.3-5.5% band
- Whether CPI lands above or below the 3.75-4.00% consensus range
- Whether XLU breaks through resistance or turns lower from it
This article is for informational purposes only and should not be considered financial advice. Investors should conduct their own research and consult with financial professionals before making investment decisions.