Every nation that has ever led the world in technology eventually believed its advantage was permanent. Every one of them was wrong. The historian Donald Cardwell spent a career documenting this pattern, and it carries a warning for anyone treating the current American lead in artificial intelligence as a settled question.
The rivalry between the United States and China is usually covered as a horse race with a finish line: who is ahead, who is catching up, who wins. That framing misreads how technological leadership actually changes hands. The more useful question is not who leads today, but what historical patterns tell us about how these transitions unfold and what signals precede them.
What follows gives you a historically grounded framework for reading the signals that matter in the US China tech race, so you can track the structural factors that determine leadership over decades rather than reacting to whichever benchmark made headlines this quarter.
What Cardwell’s Law actually says, and why it matters now
Donald Cardwell, a British historian of technology, made an empirical observation that has kept his name attached to it. Technological creativity in any given society tends to be short-lived. Roughly one century is the typical span before a leading nation begins to decline.
This is not a mystical cycle or a prophecy. It is structural. Leadership erodes when the institutions and incentive systems that produced the original advantage stop adapting, and a hungrier competitor with fresher institutions moves ahead.
Econlib’s analysis of Cardwell’s Law examines not only his core observation that no society sustains peak creativity for more than a historically short period, but also the institutional conditions that might allow a nation to extend that window, a question directly relevant to whether current US policy responses are structurally sufficient.
The historical record traces a clear line of succession:
- The Netherlands led in the 17th and 18th centuries, powered by commercial finance and open trade networks.
- Britain displaced the Dutch by the late 19th century on the strength of the Industrial Revolution and its engineering base.
- The United States displaced Britain across the 20th century, its rise accelerated by the destruction of European infrastructure across two World Wars and the migration of leading scientists and engineers to American institutions.
Each transition shared a mechanism: the incumbent’s system calcified while the challenger’s system regenerated the conditions for breakthrough.
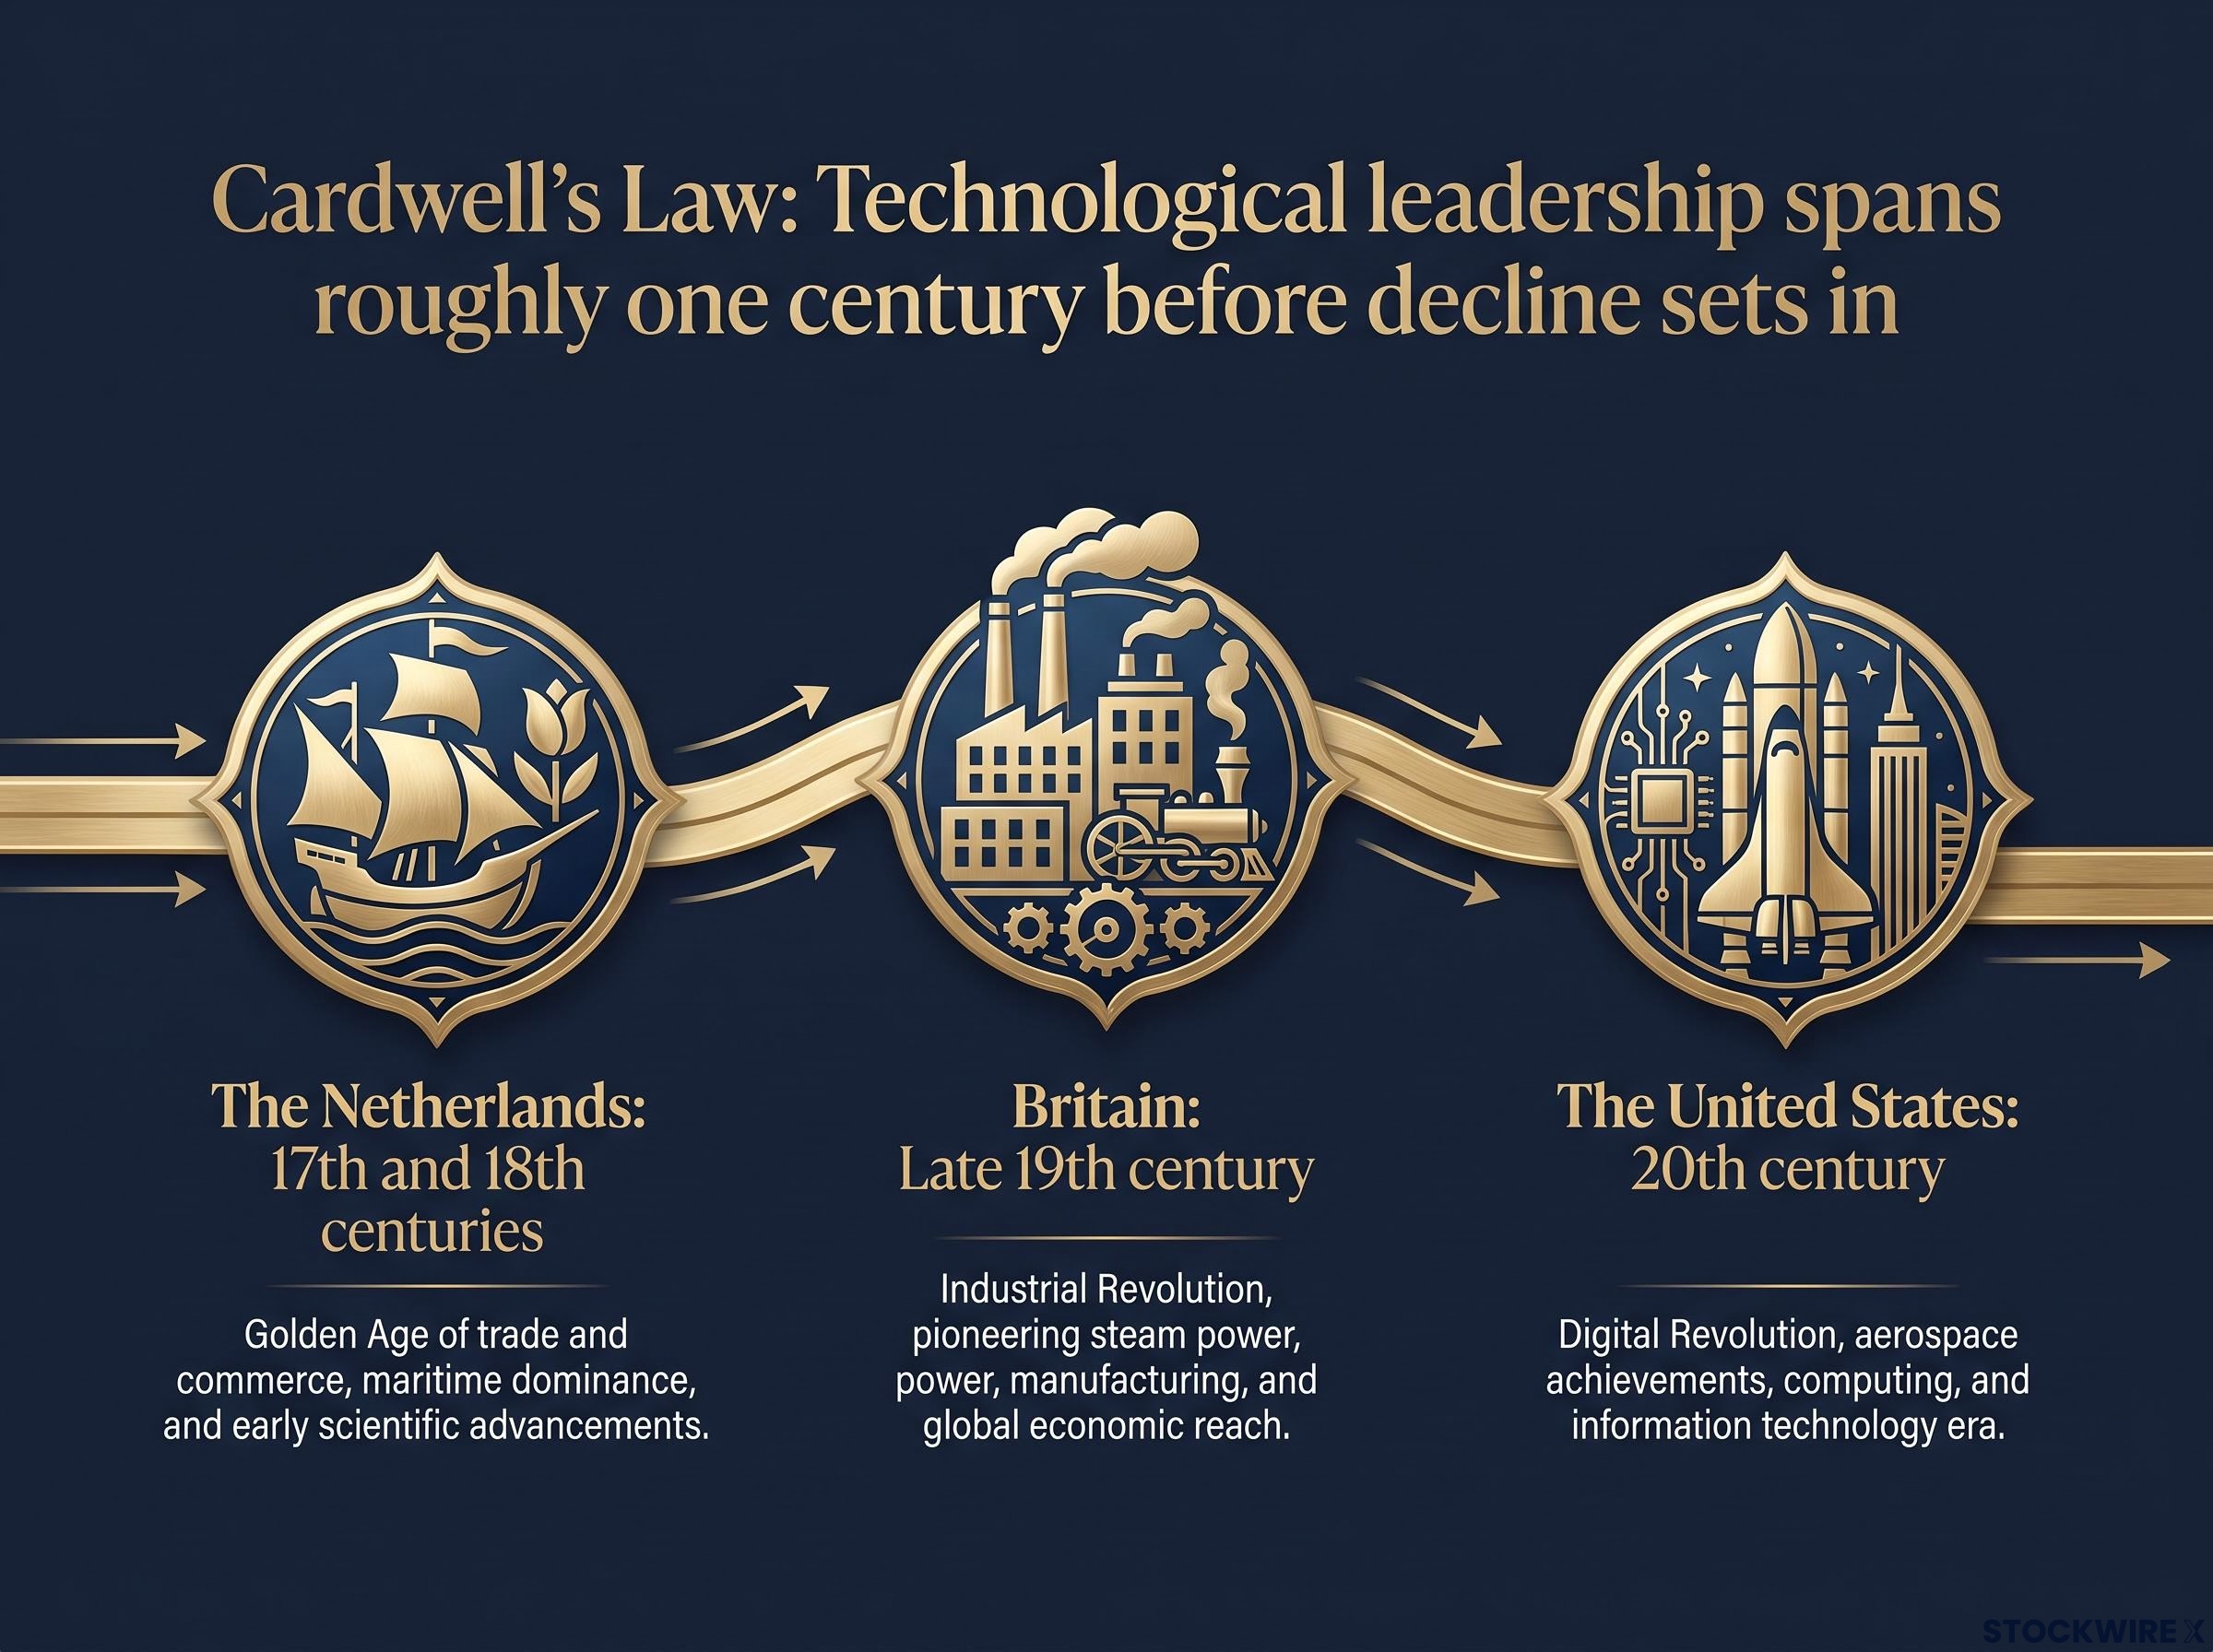
Cardwell’s Law holds that no society stays technologically creative for much more than about a century before decline sets in. American consolidation of leadership began in the early 20th century. Do the arithmetic on that timeline yourself.
Here is what this means for you as an investor. Cardwell’s Law is not a prediction that China wins. It is a warning that the United States should not assume its current advantages are self-sustaining. If you are treating American technological dominance as a permanent condition, you are pricing in an assumption the historical record does not support.
There is a second insight buried in the pattern, and it cuts against the winner-take-all framing entirely. Competition between nations for technological leadership serves a productive function. The pressure of a serious rival is often what keeps the leader innovating in the first place, which means the rivalry itself, not the outcome, may be what sustains progress on both sides.
When big ASX news breaks, our subscribers know first
Who is actually ahead, and on which metrics
Ask who is winning the technology race and you will get a different answer depending on which number you look at. That is not because the data is unreliable. It is because different metrics measure genuinely different things, and they currently point in opposite directions.
On aggregate spending, China has edged ahead. In 2024, China’s national R&D expenditure reached 3,632.68 billion yuan, growing 8.9% year-on-year and representing an R&D intensity of 2.69% of GDP. On a 2015 Purchasing Power Parity basis, which adjusts for what money actually buys in each country, that came to roughly $1.028-1.03 trillion, narrowly surpassing the US at around $1.009-1.01 trillion. Together the two nations account for about 59% of global R&D.
On research influence, China also leads. It captured 20.6% of global AI publication citations in 2024, against 12.6% for the US.
But the picture inverts the moment you look at commercial capital and frontier capability. US private AI investment reached $285.9 billion in 2025, dwarfing China’s $12.4 billion. American organisations produced about 50 notable frontier AI systems in 2025, compared with 30-35 for China. US companies captured between 53.4% and 56% of global semiconductor device revenue in 2025, driven by dominance in chip design.
| Metric | US Position | China Position | What it signals |
|---|---|---|---|
| Aggregate R&D spend (PPP, 2024) | ~$1.009-1.01 trillion | ~$1.028-1.03 trillion (leads) | Scale of national commitment |
| Private AI investment (2025) | $285.9 billion (leads) | $12.4 billion | Commercial capital depth |
| AI publication citations (2024) | 12.6% | 20.6% (leads) | Research volume and influence |
| Notable frontier AI systems (2025) | ~50 (leads) | 30-35 | Capability at the cutting edge |
| Semiconductor revenue share (2025) | 53.4-56% (leads) | ~one-third of global usage | Control of critical hardware |
| Industrial robot installations (2024) | 34,200 | 295,000 (leads) | Deployment and manufacturing scale |
Volume versus frontier: why the distinction matters
The contradiction resolves once you separate two different kinds of competitive position. Raw counts, citations, patents, robot installations, measure how much a nation is doing. Frontier capability, the models that set global benchmarks and the chips that make them possible, measures whether a nation can do the thing nobody else has done yet.
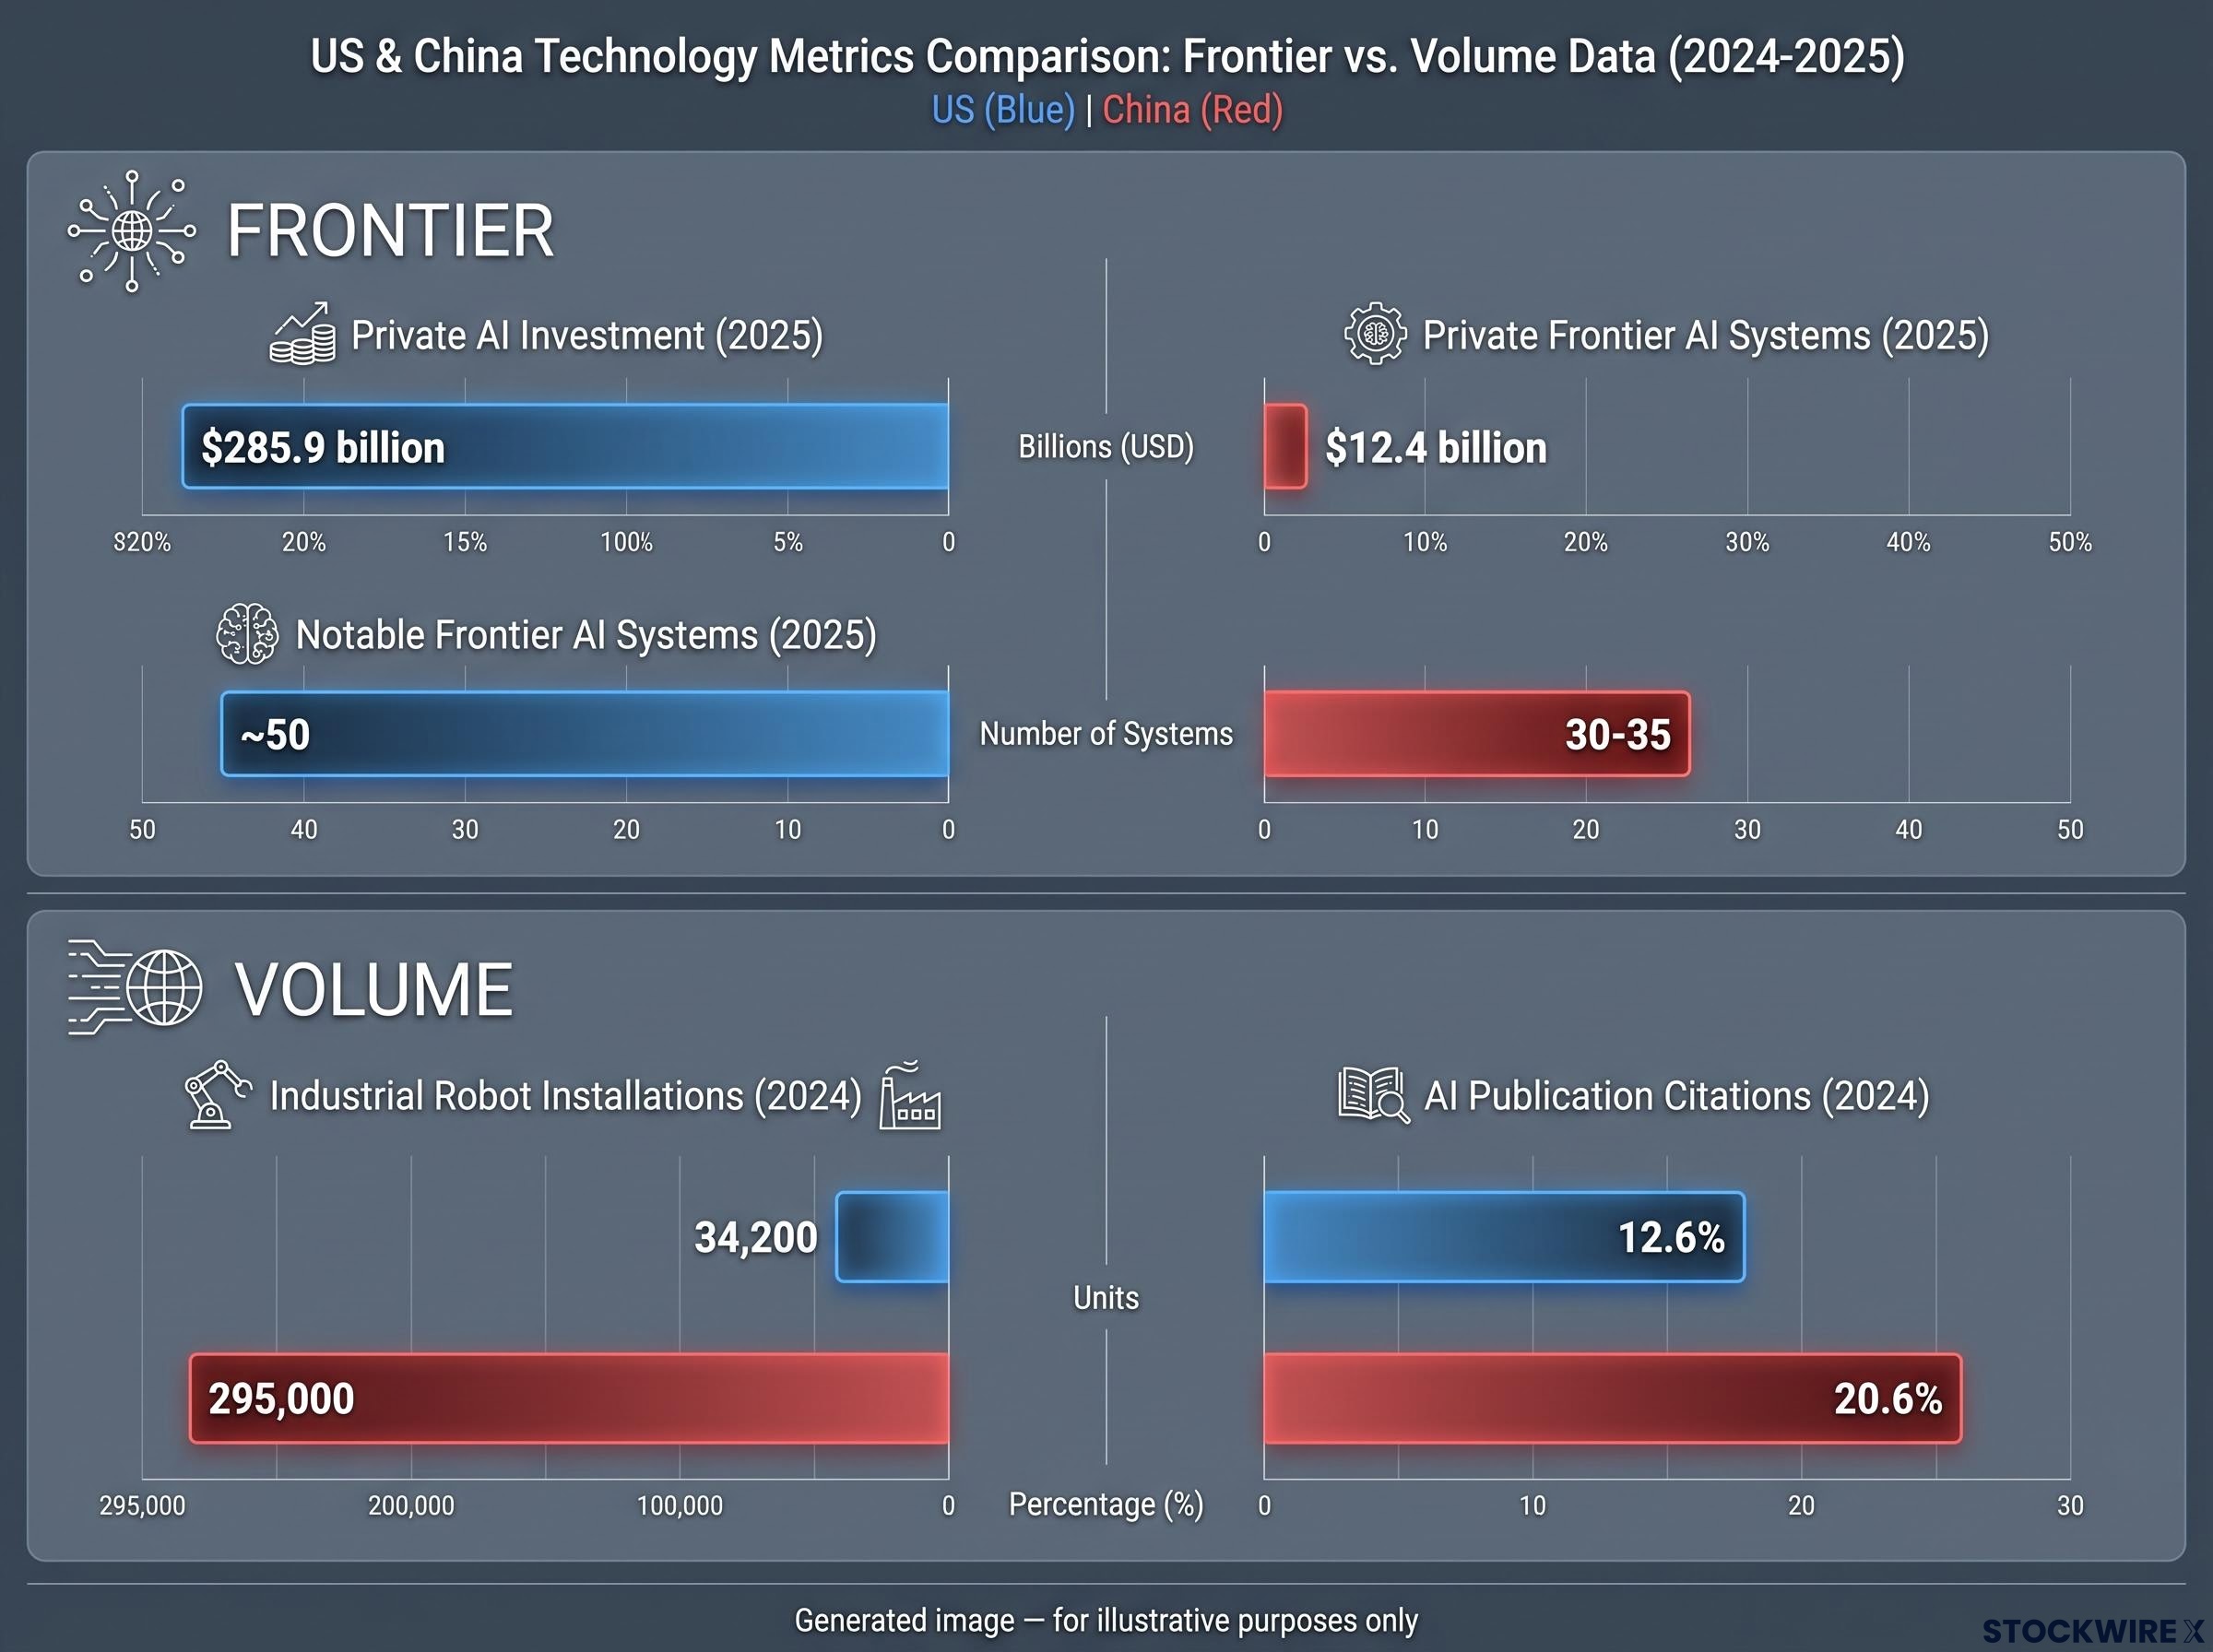
China leads decisively on volume. Its 295,000 industrial robot installations in 2024 against 34,200 in the US reflect an industrial base operating at a scale the US cannot match. But every absolute frontier model since 2023 has originated in the United States. Volume and frontier are not the same race.
China’s 295,000 annual robot installations represent more than a manufacturing statistic; they reflect a compounding physical AI advantage that the standard semiconductor-and-software scorecard systematically undercounts, as each additional hour of real-world robot operation generates training data that no benchmark test can replicate.
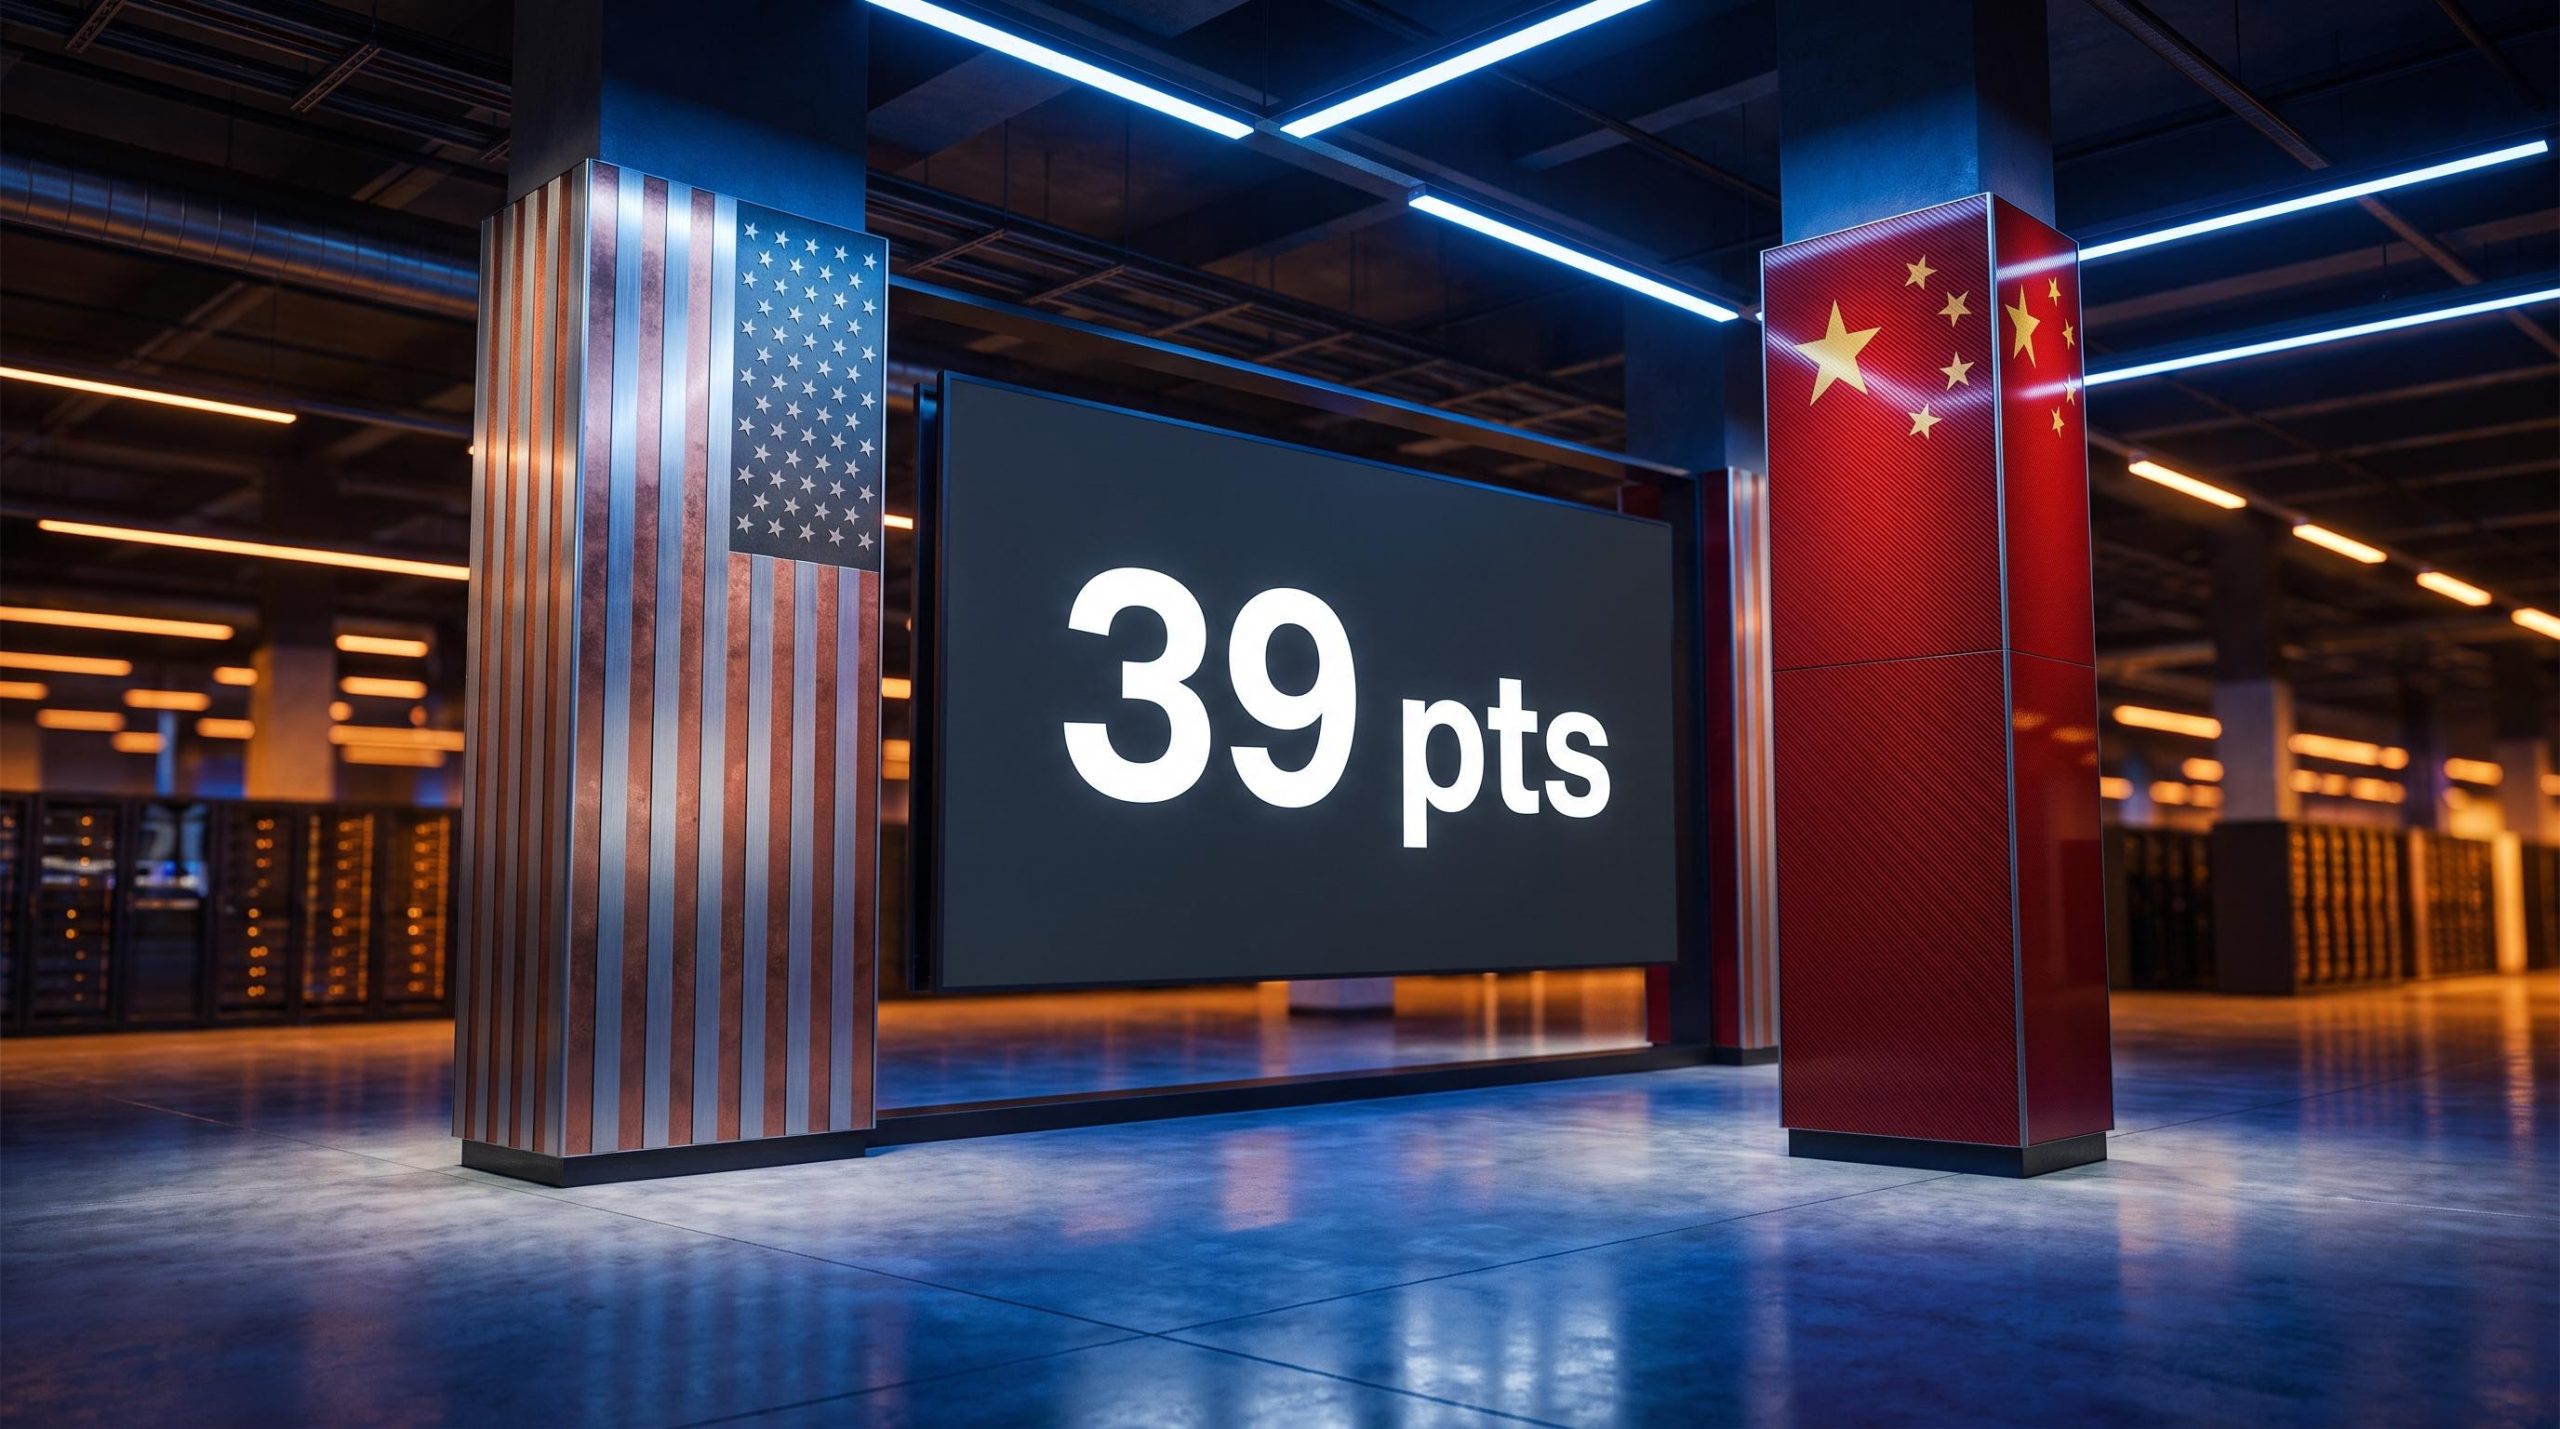
The Arena benchmark gap between the top US and top Chinese AI models narrowed to just 39 points, a 2.7% differential, as of March 2026. The current gap is small. The direction of travel, steadily narrowing, matters more than the snapshot.
The DeepSeek case makes the distinction concrete. In January 2025, the Chinese lab DeepSeek released its open-source R1 model, which matched leading US models and drew global attention. Yet reports indicated Chinese labs systematically drew on outputs from US frontier models, including Claude, GPT and Gemini, to train it. That is genuine catch-up, but it is catch-up that still depends on the frontier it is chasing.
What this tells you is that a leadership transition, if it comes, will not arrive as a single moment of overtaking. It will look like gradual erosion at the frontier. Tracking which metrics are moving, and in which direction, matters far more than any single scoreboard reading.
The structural vulnerabilities on both sides
The metrics tell you where each nation is strong. They do not tell you where each is brittle. And the fault lines that determine which system bends first under pressure are institutional, not technological. They sit almost entirely outside the headline numbers.
The cracks in the American model
The US advantage has always rested on its ability to attract and regenerate talent. That pipeline is under strain.
- The H-1B Modernization Rule, effective 17 January 2025, revised the definition of a specialty occupation and expanded protections for F-1 students, modernising the pathway even as costs rose.
- A $100,000 payment requirement took effect on 21 September 2025 for qualifying new H-1B petitions filed for workers outside the US, sharply raising the barrier to entry.
- Talent inflow to the US has declined sharply since 2017 across multiple indices.
- US life expectancy runs roughly three to four years below European averages, a broader marker of societal resilience.
- Legislative dysfunction limits the country’s capacity to adapt its institutions to new technological realities.
The cracks in the Chinese model
China’s state-directed model can mobilise resources at extraordinary speed, but that same centralisation introduces its own structural risks.
- Heavy reliance on Government Guidance Funds frequently produces overcapacity, price wars, and deflationary pressure across strategic sectors.
- Centralised direction can suppress creative risk-taking, favouring compliance over originality, a dynamic economists term innovation distortion.
- Firms are often incentivised to optimise for state approval rather than global competitiveness.
- Expanded AI safety frameworks from the Cyberspace Administration of China, issued in September 2024 and September 2025, impose heavy governance obligations.
- January 2026 amendments to the Cybersecurity Law bound AI development tightly to national ethical and safety requirements, adding friction for adoption abroad.
China’s central budgeted science and technology spending was planned to reach 398.119 billion yuan in 2025, a 10% increase, even as economists warned about overcapacity in state-led clusters.
The export control paradox
Here the American strategy has produced a result its designers did not intend. Between 2022 and 2025, successive rounds of US export controls targeted advanced AI chips, design software, and manufacturing equipment, extending in late 2024 and January 2025 to cap AI chip exports and restrict High-Bandwidth Memory.
The intent was to slow China by denying it the best hardware. The effect, at least in part, was to accelerate Chinese self-reliance. Blocked from leading Nvidia hardware, Chinese firms were forced to design domestic chips and squeeze more performance out of less compute, producing exactly the kind of algorithmic efficiency gains the DeepSeek story showcased.
AI chip export controls sit on a different legal and political foundation than tariff negotiation: grounded in national-security law with bipartisan Congressional backing, they occupy territory that trade summit communiques cannot reach, which is why investors who priced diplomatic optimism after the May 2026 Beijing summit still faced unresolved structural exposure in semiconductor portfolios.
US restrictions designed to slow China have demonstrably accelerated indigenous Chinese chip and algorithmic development, as compute constraints pushed firms toward efficiency gains they might otherwise never have pursued.
This is precisely what Cardwell observed about rivalry sustaining innovation effort, and it should reshape how you read the risk. Institutional erosion on the US side and innovation distortion on the China side are both slow-moving. Neither will show up in next quarter’s benchmark, which is exactly why they deserve more weight in a long-term risk framework than they usually get.
What the historical pattern implies for long-term portfolio risk
Put the framework and the data together and the practical takeaway shifts. The task is not to pick a winner. It is to build a way of monitoring a transition that could unfold over decades.
The logic is straightforward. If no nation sustains technological leadership indefinitely, then concentrated exposure to any single nation’s technology ecosystem carries a historical tail risk that short-term analysis simply does not capture. The Cardwell pattern is not actionable as a trade. It is actionable as a reason to question the assumption of permanence.
Market leadership rotation across historical concentration episodes, including the Nifty Fifty, Japan Inc., and the TMT bubble, produced annualised returns roughly 3-5 percentage points below the broad global market over the subsequent decade for the dominant cohort, a pattern that makes Cardwell’s century-scale observation visible in portfolio return data.
This particular rivalry is also structurally different from the transitions that came before it. The Dutch, British and American handovers each involved an incumbent and a single rising challenger arriving in sequence. Here, both nations are building semi-segregated ecosystems at once, enforced through export controls, digital standards and divergent regulation. With the two together representing roughly 59% of global R&D, a clean winner-take-all outcome looks increasingly unlikely.
The Hefei manufacturing boom captures both sides of the Chinese story in a single case. Enormous state investment built entire supply chains in electric vehicles, semiconductors and deep-tech manufacturing almost from scratch, demonstrating the speed of the model. The resulting overcapacity and deflationary pressure, which prompted warnings from central authorities, demonstrated its financial fragility just as clearly.
The US, for its part, is not relying on incumbency alone. America’s AI Action Plan, launched in July 2025, aims to attract foreign capital, drive data-centre investment and expand energy capacity, evidence that the country is actively working to sustain its structural advantage through industrial policy.
Rather than a prediction to act on, the analysis hands you variables to track:
- US talent inflow. The regenerative advantage depends on it. Watch H-1B costs, approval volumes, and the inflow indices that have fallen since 2017.
- China’s innovation distortion. Watch whether state-directed firms can produce frontier breakthroughs rather than fast followers, and whether overcapacity forces a reckoning.
- The frontier benchmark gap. The 2.7% Arena differential is small but directional. Sustained narrowing, or a Chinese-origin frontier model, would be a genuine signal.
- Regulatory friction abroad. China’s CAC frameworks and cybersecurity amendments limit global adoption of its AI outputs regardless of domestic capability, capping the reach of its gains.
The reframe is this. The relevant risk is not whether China surpasses the US within five years. It is whether the conditions that keep the US at the frontier continue to hold, and whether China’s model can overcome its structural constraints at scale.
The transition is not a moment, it is a process to watch
Leadership transitions become visible in institutional signals long before they show up in output metrics. That is the single most important lesson the historical pattern offers, and it is why the institutional signals in both nations are worth watching closely right now.
The evidence does not support either popular framing. “The US will dominate forever” ignores a century-long pattern with no known exceptions. “China is about to take over” ignores that every frontier model since 2023 remains American and that private capital still overwhelmingly favours the US. The historically grounded position sits between them: the current bipolar structure is unstable over multi-decade horizons, and when the transition comes it will likely be domain-specific rather than wholesale.
Watch the metrics that look stable but move over time. The 39-point, 2.7% Arena gap is one. On the US side, watch the talent pipeline, the $100,000 H-1B fee and the inflow decline since 2017. On the China side, watch the regulatory friction from the CAC frameworks and the January 2026 cybersecurity amendments that constrain global adoption regardless of domestic capability.
The durable position for your portfolio is neither bet. A framework built on permanent US dominance is historically unusual, but so is one that assumes an imminent Chinese takeover. Monitor the institutional variables and build exposure that does not require either assumption to hold.
For investors building a portfolio framework around multi-decade leadership transition scenarios, our dedicated guide to foreign ownership amplifier risk examines how $16.9 trillion in foreign US equity holdings, now 55% of foreign portfolios, creates a procyclical correction dynamic that would accelerate any AI-driven sentiment reversal.
And keep Cardwell’s final insight in view: the competition itself may be what sustains the pace of global innovation, regardless of who leads at any given moment.
This article is for informational purposes only and should not be considered financial advice. Investors should conduct their own research and consult with financial professionals before making investment decisions. Past performance does not guarantee future results, and forward-looking assessments are subject to change based on market and geopolitical developments.