
Life360 has delivered 38% revenue growth, pushed monthly active users toward 100 million, and posted a record first quarter for fiscal 2026. Yet the share price sits 64% below its October 2025 peak. For Australian retail investors watching ASX:360, that gap between operational momentum and market pricing is the entire question. The sell-off creates an uncomfortable tension: the operating metrics look strong while the share price tells a different story. With Q1 2026 results released on 11 May 2026 and a 10-analyst Strong Buy consensus carrying a median price target of $75.58 against a current price of $19.86, the divergence is unusually wide even by growth stock standards. What follows is a structured breakdown of what actually drove the 64% collapse, what the latest numbers reveal about the underlying business, where the competitive moat holds and where it does not, and what conditions need to be met before a credible re-rating can occur.
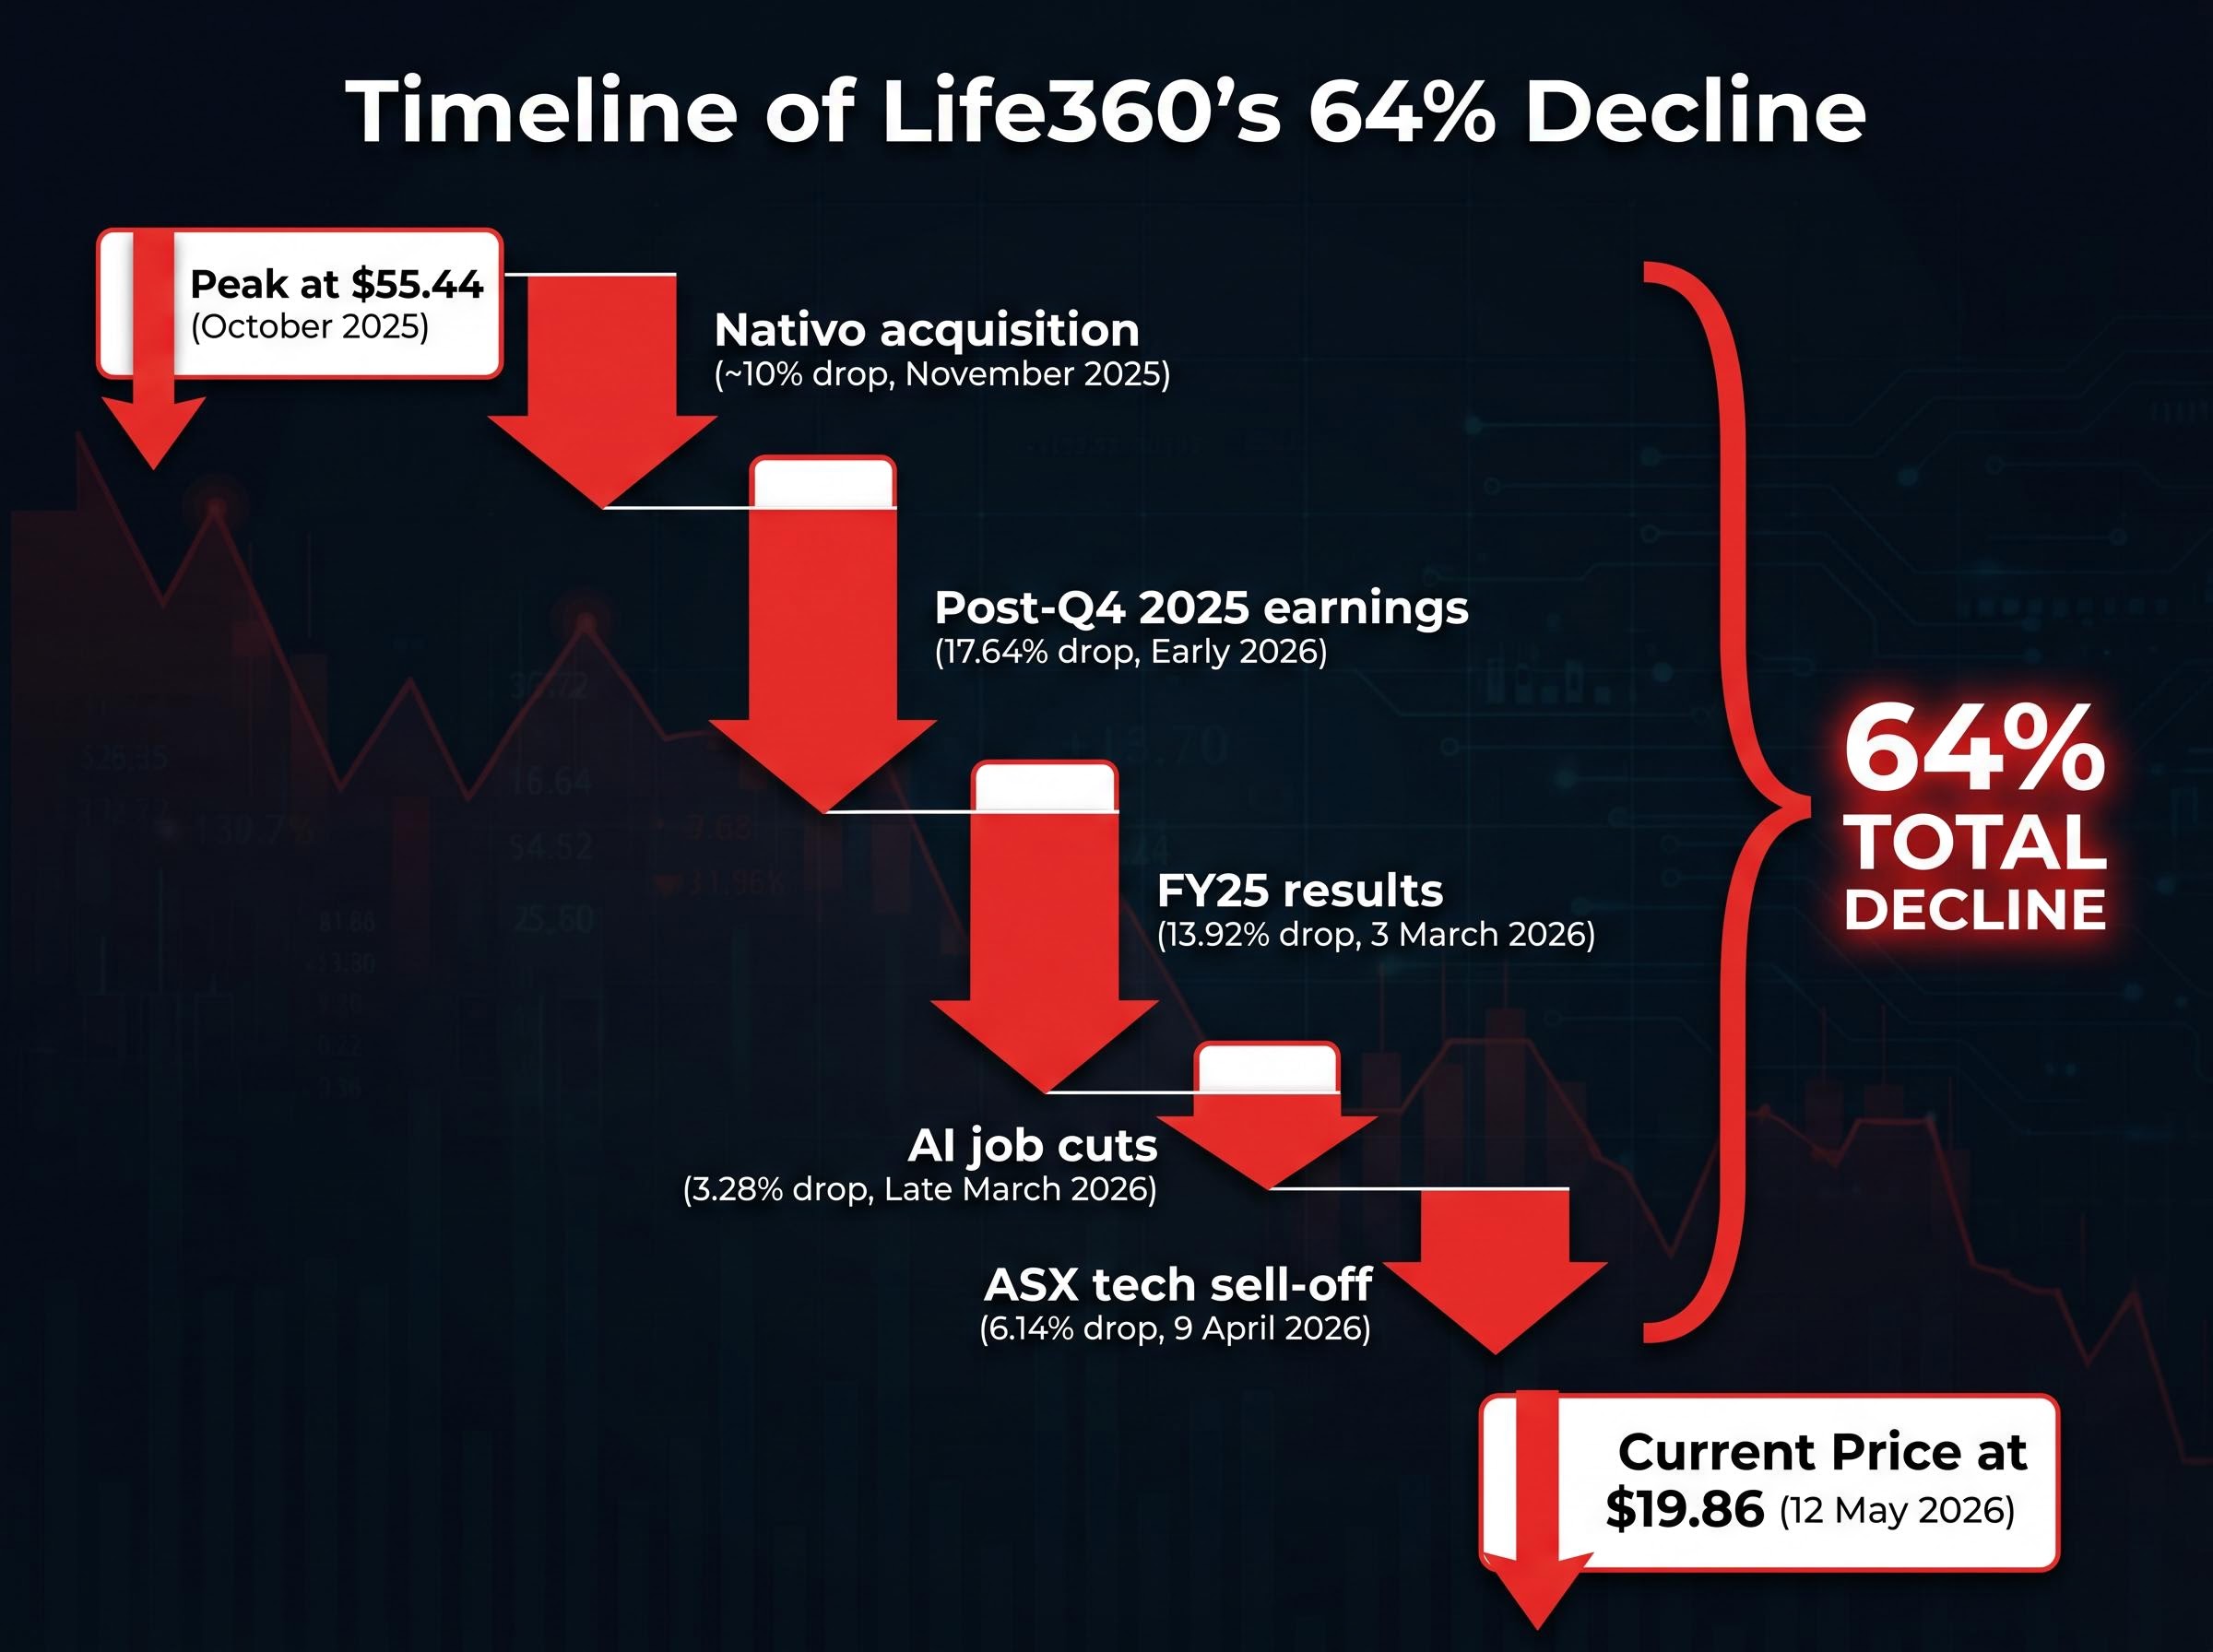
How a 64% collapse unfolded from a single peak
The decline from $55.44 in October 2025 to $19.86 as of 12 May 2026 was not a single event. It was a sequence of discrete triggers, some company-specific, some structural, each compounding the last. Separating them matters because an investor who treats the collapse as one verdict risks misreading what the market actually repriced.
Sector and index mechanics that amplified the decline
Russell index reweighting during this period forced passive fund selling of Life360 shares, a mechanical flow unrelated to any fundamental view. Broader ASX technology sector weakness added pressure, with an April 9, 2026 sell-off alone dragging the stock down 6.14%. AI-disruption sentiment, which weighed across the sector through early 2026, created an overhang that punished growth-stage software names regardless of individual operating performance.
Stock-specific triggers that drove discrete drops
Several of the sharpest single-day drops occurred despite strong results, a signal the market was resetting valuation multiples rather than punishing execution. The Nativo acquisition in November 2025 prompted an approximately 10% fall. Post-Q4 2025 earnings delivered a 17.64% decline even though the company reported 95.8 million MAUs and beat expectations. The FY25 results day on 3 March 2026 saw a further 13.92% drop despite another beat.
| Event | Date | Drop | Trigger |
|---|---|---|---|
| Post-Q4 2025 earnings | Early 2026 | 17.64% | Growth deceleration concerns despite MAU beat |
| FY25 results | 3 March 2026 | 13.92% | Valuation reset at ~150x earnings |
| Nativo acquisition | November 2025 | ~10% | Acquisition premium scepticism |
| ASX tech sell-off | 9 April 2026 | 6.14% | Broader sector weakness |
| AI job cuts announcement | Late March 2026 | 3.28% | Workforce reduction amid AI transition |
The cumulative effect: a YTD decline of 37.28% by the post-Q4 earnings date, extending to the full 64.2% drawdown from peak by mid-May.
When big ASX news breaks, our subscribers know first
What the Q1 2026 numbers actually show
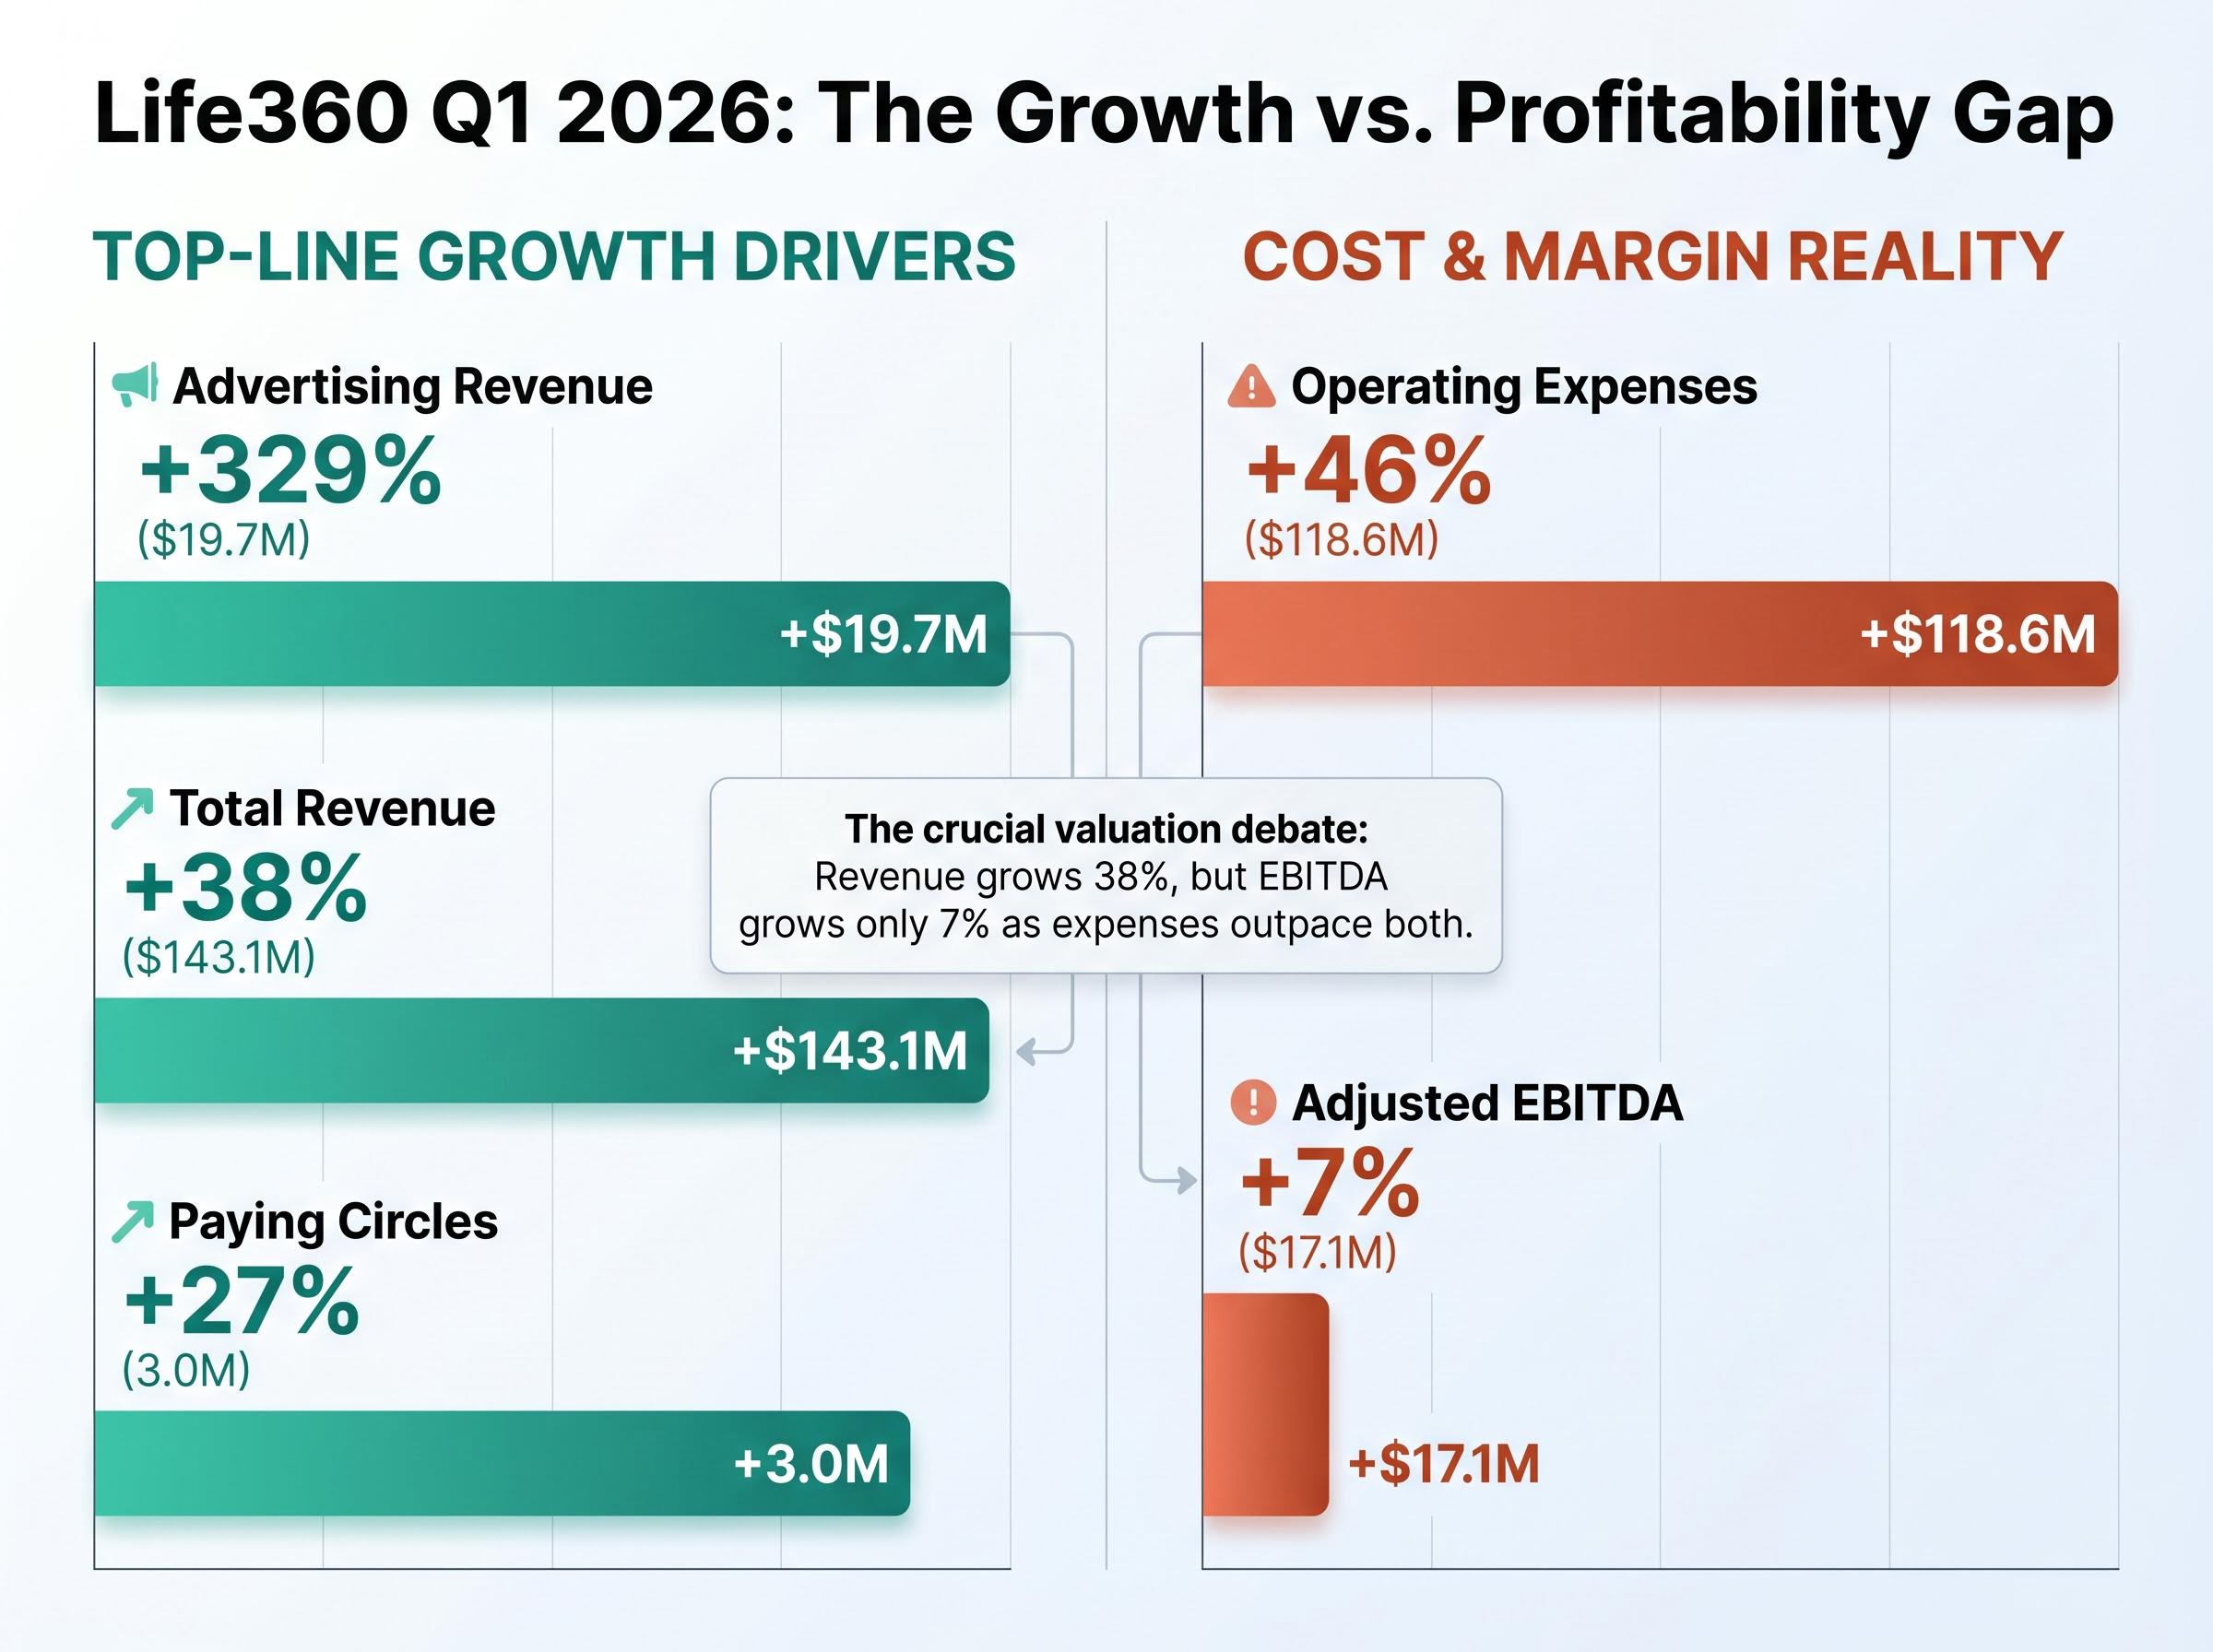
The headline result is difficult to dismiss. Life360 reported Q1 2026 total revenue of $143.1 million, up 38% year on year, its strongest quarter on record. Subscription revenue reached $108.2 million, up 32% year on year, while annualised monthly revenue hit $517.9 million, also up 32%.
User metrics reinforced the top line. Monthly active users reached 97.8 million, up 17% year on year, with 1.9 million net additions in the quarter. Paying circles grew 27% year on year to 3 million, and average revenue per paying circle rose 7% year on year.
Advertising revenue: $19.7 million, up 329% year on year. This segment was disclosed as a separate line item for the first time in Q1 2026, signalling management’s view that it has reached a scale worth reporting independently.
The profitability picture is where the tension sits. Adjusted EBITDA came in at $17.1 million, up just 7% year on year, while operating expenses grew 46% to $118.6 million. Operating cashflow improved 42% year on year to $17.2 million, and cash on hand rose to $459 million from $288.6 million in Q1 2025. Life360 raised its FY26 guidance following the beat.
| Metric | Q1 2026 | Q1 2025 | YoY Change |
|---|---|---|---|
| Total revenue | $143.1M | $103.7M | +38% |
| Monthly active users | 97.8M | 83.6M | +17% |
| Paying circles | 3.0M | 2.4M | +27% |
| Adjusted EBITDA | $17.1M | $16.0M | +7% |
| Cash on hand | $459M | $288.6M | +59% |
The gap between 38% revenue growth and 7% EBITDA growth is the crux of the valuation debate. Investors need to determine whether rising costs reflect temporary investment ahead of operating leverage, or a structurally expensive business model.
The profitability question did not arrive without warning: Life360’s first full-year profit, reported in Q4 2025, marked a structural inflection from loss-making to positive net income, with adjusted EBITDA surging 105% and operating cash flow up 172% year on year, establishing the baseline against which Q1 2026 cost growth is now being measured.
Why growth deceleration is the market’s real concern
A company can beat earnings expectations and still see its share price fall. For investors new to growth stock mechanics, this pattern can appear contradictory, but it follows a clear logic. High-multiple stocks are priced not on current earnings but on the market’s expectations for future growth. When the rate of growth slows, even if revenue and users are still increasing, the valuation multiple the market is willing to assign can compress sharply.
Three variables typically determine the multiple a growth stock commands:
- Revenue growth rate: the speed of top-line expansion, not just its direction
- Path to profitability: whether rising revenue is translating into improving margins
- Competitive moat durability: the likelihood that growth can be sustained against rivals
Life360 was trading at approximately 150x earnings after the FY25 results. At that multiple, the market was pricing in sustained acceleration. When MAU growth decelerated from 20% year on year in Q4 2025 to 17% year on year in Q1 2026, the premium embedded in the share price came under pressure, even though the absolute user base continued to grow.
Why paying circles matter more than MAU for valuation
MAU includes all users, free and paid. Paying circles represent the monetised relationships that directly drive subscription revenue. In Q1 2026, paying circles grew 27% year on year, materially faster than the 17% MAU growth rate. Net additions of 1.9 million paying circles matched the total net MAU additions for the quarter, meaning the company converted its entire new user growth into monetised relationships.
For valuation purposes, paying circles growth is a more direct signal of revenue sustainability. Analysts cite the 27% figure as evidence that the monetisation engine is strengthening even as free user acquisition moderates.
Where the competitive moat is strong, and where it is not
Life360’s primary moat derives from network effects within family groups. Once a household is enrolled and sharing location data, switching costs are high because coordination requires every family member to move simultaneously to a different platform. That friction is real and measurable: it shows up in the 27% paying circles growth despite the broader user acquisition slowdown.
Academic research on digital lock-in and platform switching costs identifies the combination of network effects and coordination friction as the primary mechanism that sustains competitive moats in mobile platform businesses, which maps directly onto Life360’s family-group model where a single defector can strand the remaining household members on the platform.
Cross-platform accessibility strengthens the position further. Unlike Apple Find My, which is limited to Apple devices, Life360 operates across iOS and Android, giving it reach into mixed-device households. The Uber integration announced in March 2026 extends the platform’s presence in the location-based services ecosystem, relevant for Australian users who combine ride-sharing with family safety features. A pet-tracking GPS feature launched in 2025 expanded the addressable market beyond human location sharing.
Moat strengths:
- Network effects within family groups create high switching costs
- Cross-platform accessibility covers mixed-device households
- Integrated ecosystem partnerships (Uber, pet tracking) broaden use cases
- Paying circles monetisation growing faster than the overall user base
Moat vulnerabilities:
- Apple Find My holds a platform-native advantage with zero incremental cost for Apple households
- Competitors including Garmin, FamSafe, and Glympse offer overlapping features
- AI disruption poses a longer-horizon structural risk to location and safety software
- A premium valuation multiple leaves no margin for error if growth continues slowing
Network-effect platform moats have proven more resilient to AI disruption than technology-dependent competitors across the ASX, with Morningstar’s review of 132 companies finding that participation-based networks retain competitive advantages even as AI tools reshape the products sitting on top of them, a dynamic that applies directly to Life360’s family-group coordination model.
Analyst assessments place the competitive moat at approximately 5 out of 10, a moderate rating. The network effect is genuine but not unassailable. For ASX investors, the moat question reduces to whether Life360’s family-app stickiness is durable enough to resist being outflanked by a well-resourced platform competitor.
What would need to happen for the share price to re-rate
The 10-analyst Strong Buy consensus carries a median target of $75.58 against a current price of $19.86, implying approximately 280% upside. The high target sits at $95.00; the low at $32.20. Even the most bearish analyst on the coverage list implies meaningful upside from current levels.
Consensus price target: $75.58 vs current price: $19.86. The implied upside of approximately 280% is among the widest gaps between analyst consensus and market pricing on the ASX.
That gap does not close on its own. Three conditions, drawn from the analyst commentary and the operational data, would need to materialise for a credible re-rating:
- EBITDA margin expansion: Revenue growing at 38% while operating expenses grow at 46% is unsustainable for valuation recovery. The market needs to see operating leverage, not just top-line acceleration.
- MAU trajectory stabilisation: The deceleration from 20% to 17% year on year needs to either stabilise above a floor or demonstrate that paying circles growth compensates for a structurally lower MAU growth rate.
- Advertising platform scaling: At $19.7 million in Q1 2026 and growing 329% year on year, the advertising segment is a structurally new revenue driver. Continued scaling would diversify the revenue base and improve the margin profile.
CEO Chris Hulls has guided for accelerating revenue growth in the second half of 2026, driven by subscription strength and peak advertising seasonality. That makes the H2 2026 reporting period the next concrete test of whether the re-rating thesis holds.
Investors wanting to build their own fair value range for Life360 rather than relying solely on analyst consensus targets will find our dedicated guide to ASX stock valuation methods useful; it walks through P/S, P/E, DCF, and DDM with a live ASX case study, including the sensitivity analysis that shows how margin assumptions alone can shift a DCF output by several dollars per share.
A 64% discount to analysts does not make a stock cheap
The tension at the centre of Life360’s investment case is genuine on both sides. Revenue growth of 38%, paying circles growth of 27%, a raised FY26 guidance, and $459 million in cash are not the profile of a broken business. The analyst consensus reflects that, with all 10 covering analysts maintaining a Strong Buy.
The bear case is equally grounded. A 150x earnings multiple at its post-FY25 level, EBITDA growth lagging revenue growth by a factor of five, and MAU deceleration from 20% to 17% are the mechanics of a valuation reset in progress, not a temporary dip.
Bull case requires:
- EBITDA margin expansion as operating expenses moderate relative to revenue
- Advertising revenue continuing to scale as a structurally new margin contributor
- Paying circles growth compensating for MAU deceleration
- H2 2026 results confirming CEO guidance on revenue acceleration
Bear case watch points:
- Operating expenses continuing to outpace revenue growth
- MAU growth decelerating further below 17%
- Advertising segment failing to sustain its current trajectory
- Competitive pressure from Apple Find My or AI-native alternatives
The H2 2026 reporting period, where Chris Hulls has guided for accelerating growth, is the next empirical inflection point. Until then, the 64% discount to peak and the 280% gap to analyst consensus coexist with a margin profile that has not yet proven it can scale.
This article is for informational purposes only and should not be considered financial advice. Investors should conduct their own research and consult with financial professionals before making investment decisions. Past performance does not guarantee future results. Financial projections are subject to market conditions and various risk factors.