Life360 reported Q1 2026 revenue of $143.12 million on 12 May 2026 (AEST), a 38% year-over-year increase that beat consensus estimates by roughly 4%. The Life360 share price opened softer on the ASX despite the headline strength, a reaction that pointed less to the top-line beat and more to the cost story sitting beneath it. Operating expenses grew 46% year-over-year, well ahead of the revenue growth rate, compressing adjusted EBITDA margins to approximately 12%.
With the stock already down more than 60% from its October 2025 peak, every earnings release carries outsized weight for holders and observers. What follows is a breakdown of what the headline numbers actually mean: where the 38% revenue growth is coming from, why the profitability gap matters, what a 329% advertising revenue surge signals about the business model, and what management’s raised guidance implies for the second half of 2026.
What Life360 actually reported: the headline numbers in full
Life360 released its Q1 2026 results on 11 May 2026 (US Eastern time), with ASX investors digesting the figures on the morning of 12 May. Revenue of $143.12 million represented 38% year-over-year growth and came in roughly 4% above the consensus estimate of approximately $137.26 million.
The verified headline figures:
- Total Q1 2026 revenue: $143.12 million, up 38% year-over-year
- Consensus estimate: approximately $137.26 million; beat of roughly 4%
- Annualised monthly revenue (AMR): $517.9 million, up 32% year-over-year
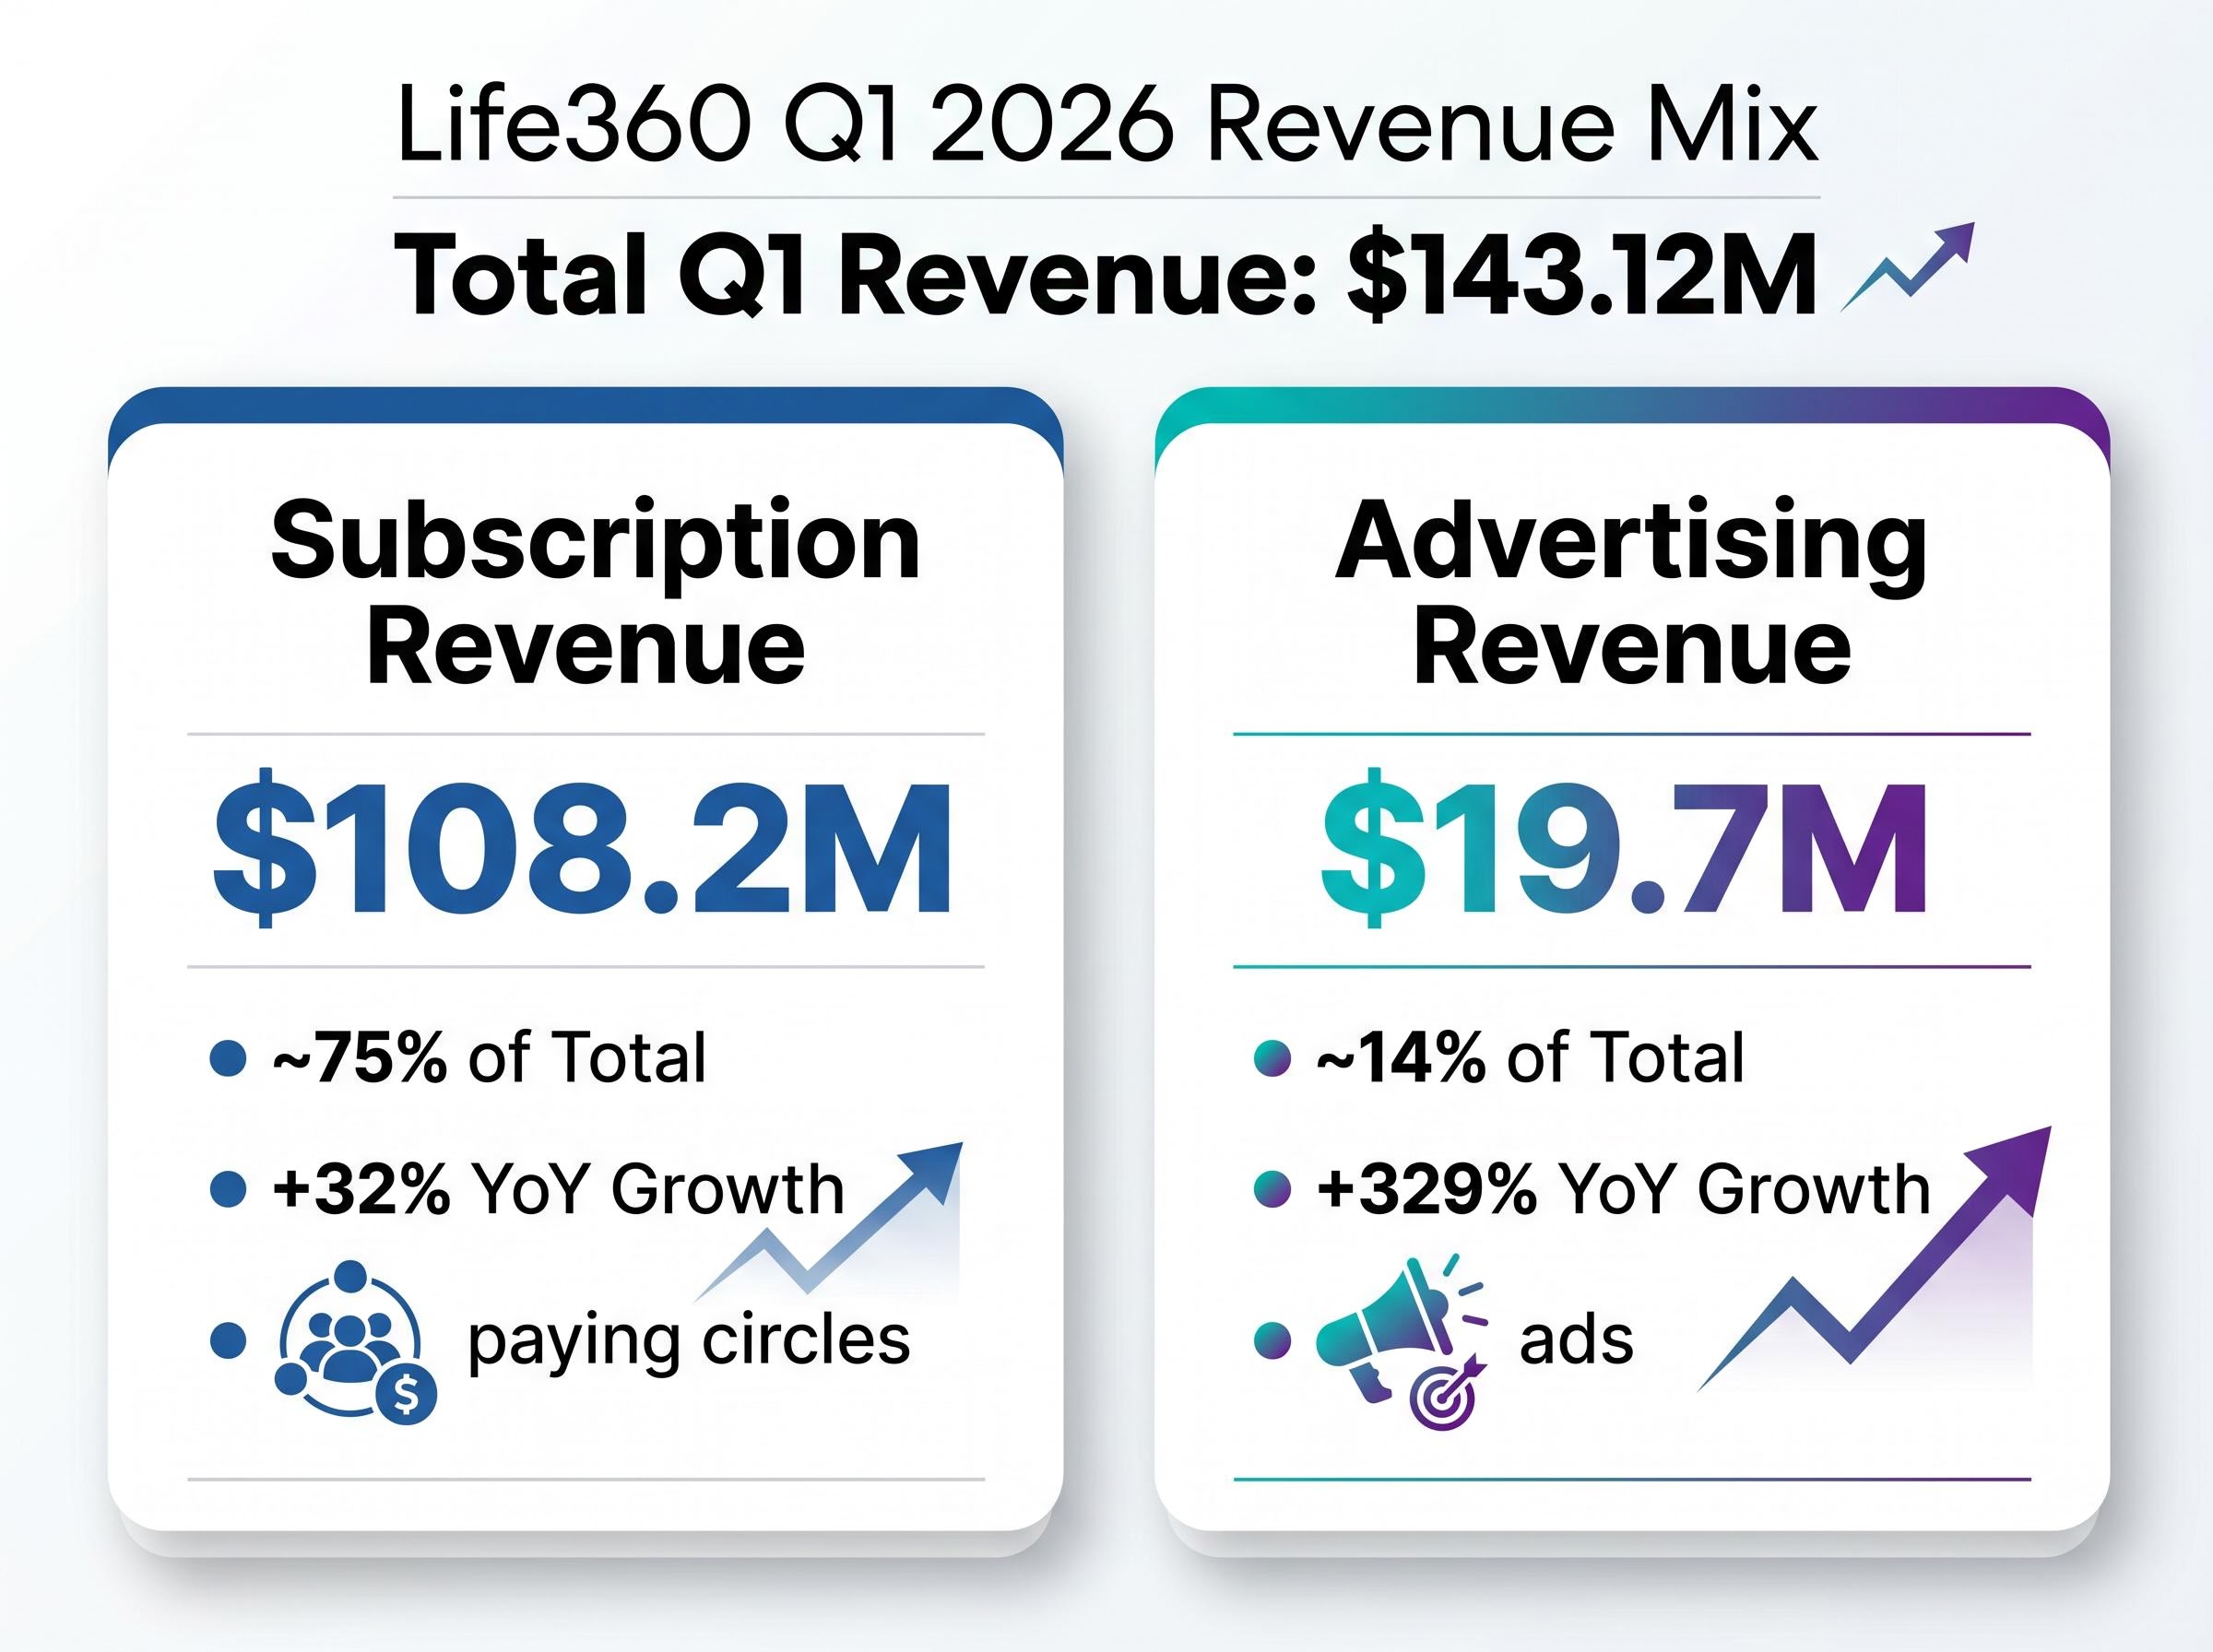
- Subscription revenue: $108.2 million, up 32% year-over-year
A point of clarity: the 38% figure refers to the year-over-year growth rate, not the magnitude of the beat against analyst expectations. The actual consensus beat was closer to 4%, a distinction that matters when calibrating expectations against the market’s muted reaction.
When big ASX news breaks, our subscribers know first
The advertising revenue story: 329% growth and what it means for the business model
329% year-over-year advertising revenue growth: Life360 reported $19.7 million in Q1 2026 ad revenue, disclosed as a standalone line item for the first time.
The figure is striking on its own. What makes it strategically significant is the composition: approximately half of the 329% growth was organic, with the remainder attributable to the Nativo acquisition. That split matters because it indicates the advertising revenue acceleration is not purely an acquisition artefact.
Beat source analysis is what separates a genuinely strong quarter from a numerically strong one: approximately half of Life360’s 329% advertising revenue growth was organic, with the remainder attributable to the Nativo acquisition, a split that matters because acquisition-driven beats do not recur the following year once the comparison base normalises.
What Nativo actually added to Life360’s advertising capability
Nativo, a programmatic advertising technology platform, was acquired on 5 January 2026 for approximately $120 million (structured as 65% cash and 35% stock). The deal brought three inventory types into Life360’s monetisation infrastructure: in-app advertising, connected TV (CTV), and publisher network placements.
Programmatic advertising, in simple terms, is the automated buying and selling of ad space. Rather than negotiating individual deals, advertisers bid in real time to place ads in front of specific audiences. Life360’s approximately 97.8 million monthly active users (MAUs) represent the audience inventory that Nativo’s technology can now monetise at scale.
Broader industry trends support the revenue trajectory Life360 is pursuing, with programmatic advertising growth in connected TV accelerating as streaming platforms absorb linear TV’s share of advertiser budgets, a shift that expands the addressable inventory available to platforms with large audience bases like Life360.
Management has projected 100%+ full-year ad revenue growth once the Nativo integration completes by Q3 2026. If that trajectory holds, advertising revenue is on a path to rival the subscription base over the medium term, a structural shift in how Life360 generates income.
Why Life360’s 38% revenue growth story comes with a profitability asterisk
Operating expenses came in at approximately $118.6 million, up roughly 46% year-over-year. Revenue grew 38%. The gap between those two figures is the single most important number in the Q1 result.
Life360’s Q4 2025 results established the baseline from which this Q1 comparison draws meaning: the prior year quarter delivered $146 million in revenue, a 105% EBITDA surge, and the company’s first full-year net income, making the current margin compression a genuine regression from the trajectory management had been signalling.
The cost story in one line: operating expenses grew 46% year-over-year while revenue grew 38%, creating a margin compression that reduced adjusted EBITDA growth to just 7%.
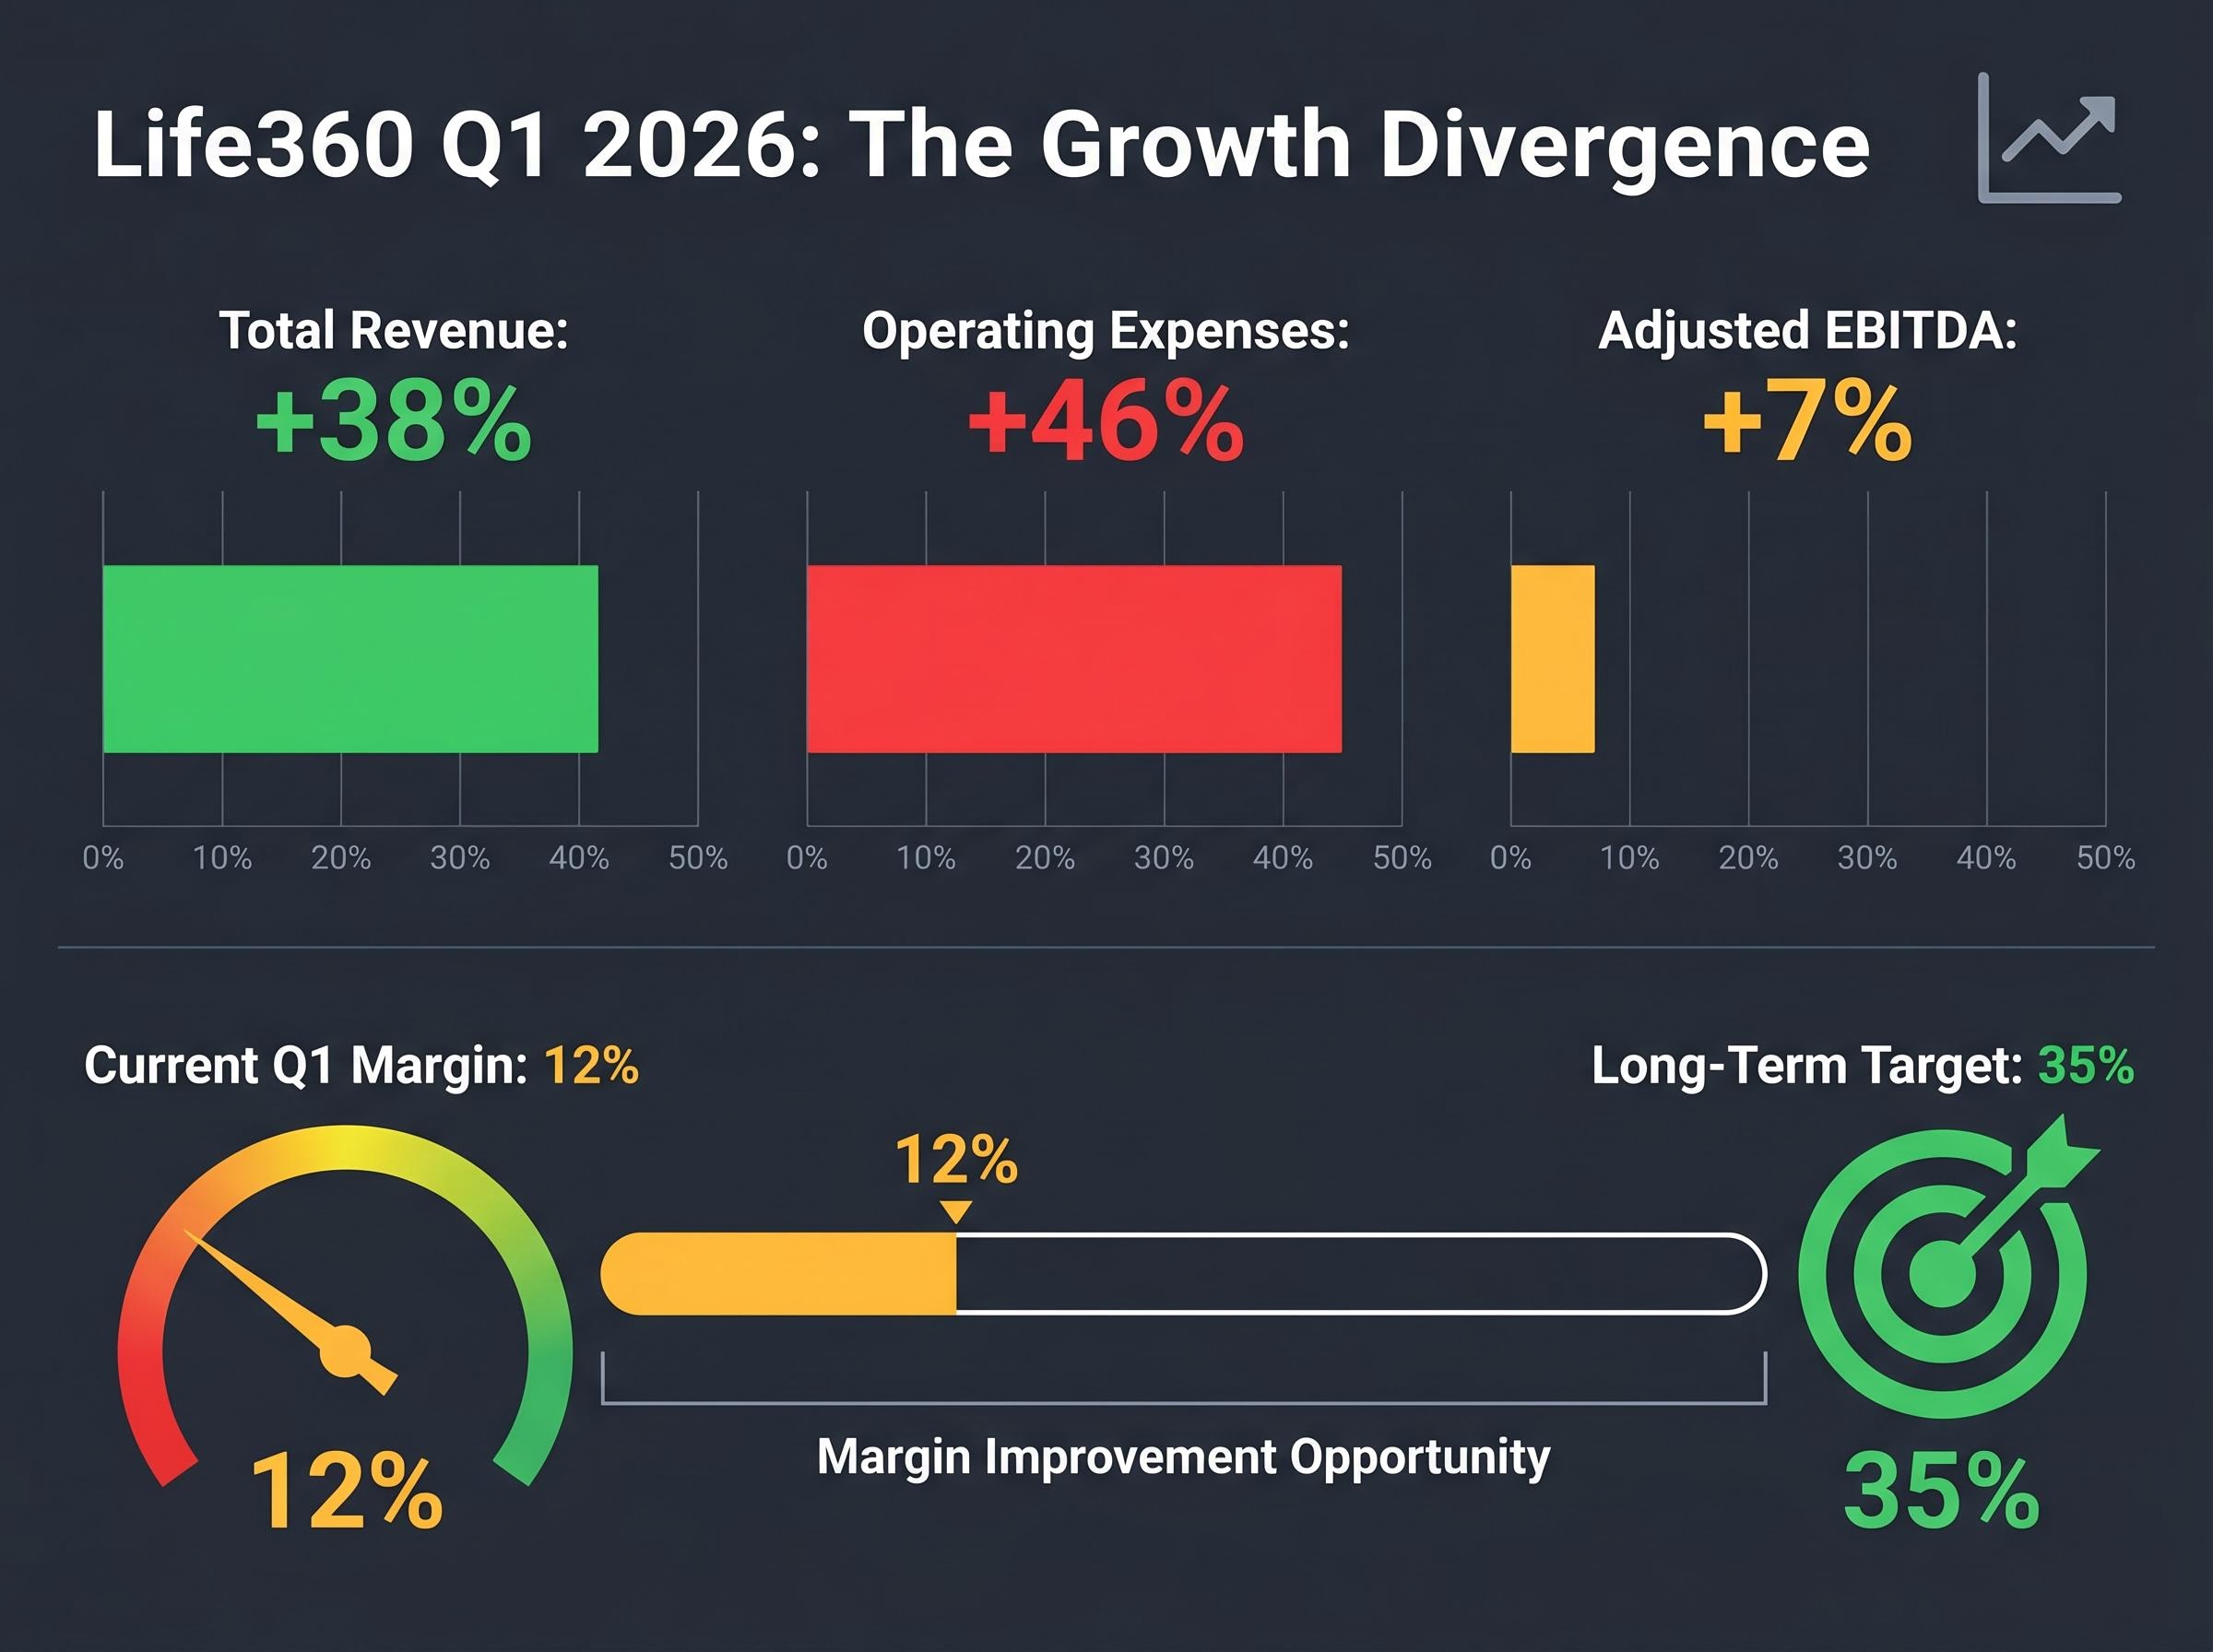
Adjusted EBITDA of approximately $17.1 million represented a margin of roughly 12%, well below the company’s stated long-term target of approximately 35%. Management attributed the cost surge to Nativo integration expenses, AI talent hiring, and growth media spend. These are plausible explanations, but they remain claims that require future validation through margin improvement in subsequent quarters.
For investors wanting to stress-test the adjusted EBITDA figure independently, our full explainer on reading adjusted EBITDA disclosures walks through the GAAP reconciliation table, identifies the categories most commonly excluded from adjusted figures, and explains why a large and growing GAAP-to-non-GAAP gap across multiple quarters is one of the most reliable red flags in any earnings report.
| Metric | Q1 2026 Result | Year-over-Year Growth | Context Note |
|---|---|---|---|
| Total Revenue | $143.12M | +38% | Beat consensus by ~4% |
| Subscription Revenue | $108.2M | +32% | ~75% of total Q1 revenue |
| Ad Revenue | $19.7M | +329% | First standalone disclosure |
| Operating Expenses | ~$118.6M | +46% | Nativo, AI hiring, media spend |
| Adjusted EBITDA | ~$17.1M | +7% | Margin ~12% vs ~35% long-term target |
A partial offset: positive operating cash flow of $17.2 million, up 42% year-over-year, and a cash position of $459 million at the end of Q1 2026 (up from $288.6 million a year earlier). The balance sheet provides runway, but it does not close the margin gap.
What 97.8 million MAUs and 3 million paying circles actually tell us (and the Android caveat)
The paying circles milestone is the cleaner story. Life360 reached 3 million paying circles in Q1, up 27% year-over-year, with 1.9 million net additions during the quarter, described by management as a record. Average revenue per paying circle (ARPPC) rose 7% year-over-year, driven by premium tier migration.
The key subscriber and user metrics:
- Total paying circles: 3 million, up 27% year-over-year
- Q1 net additions: 1.9 million (record, per management)
- Global MAUs: approximately 97.8 million, up 17% year-over-year (global figure could not be independently verified)
- US MAUs: surpassed 50 million (independently confirmed)
- ARPPC: up 7% year-over-year
The MAU figure carries a caveat. The global 97.8 million number could not be independently verified through external sources. More significantly, management acknowledged softness in MAU growth attributed to Android and lower-end device issues, characterising the drag as temporary with resolution expected by Q3 2026. Investors should treat that timeline as a watch item rather than a settled matter.
Understanding Life360’s dual business model: subscriptions, advertising, and the path to margin
How the subscription model generates revenue
Life360’s subscription business operates through “paying circles,” which are family groups that upgrade from the free tier to a premium membership. The premium tiers offer features such as location history, driving safety reports, and emergency assistance. When a circle upgrades, it generates recurring subscription revenue.
ARPPC (average revenue per paying circle) is the lever that determines how much each paying group contributes. The 7% year-over-year ARPPC increase in Q1 reflects a mix shift toward higher-value premium tiers, particularly in international markets. Subscription revenue of $108.2 million accounted for approximately 75% of total Q1 revenue.
How the advertising model generates revenue
The advertising model works differently. Life360 sells access to its user base as audience inventory through programmatic advertising technology. Advertisers bid in real time to reach specific segments of Life360’s approximately 97.8 million MAUs. Nativo’s infrastructure enables this across in-app placements, connected TV, and publisher channels.
At $19.7 million, advertising revenue represented approximately 14% of Q1 revenue. For the long-term margin target of roughly 35% to become achievable from the current 12%, three conditions would need to be met:
- Advertising revenue must continue scaling at or near current growth rates, bringing higher-margin programmatic income into the revenue mix
- Nativo integration costs must normalise after completion (expected Q3 2026), removing the one-off expense drag
- Operating leverage on the subscription base must improve, with headcount growth decelerating relative to revenue expansion
Earnings materials cited a 50% year-over-year improvement in developer productivity attributed to AI tooling, which management positioned as a medium-term cost efficiency lever. That figure is management-reported and should be treated accordingly.
Raised guidance, analyst targets, and what the second half of 2026 needs to deliver
Management raised FY2026 revenue guidance to $650-685 million, a signal of confidence that sits above the Q1 annualised run-rate of $517.9 million. Reaching the midpoint would require meaningful acceleration in the second half, particularly from the advertising segment as Nativo integration completes and seasonal ad spending peaks.
| Broker | Rating | Price Target (AUD) |
|---|---|---|
| Bell Potter | Buy | $35.50 |
| Macquarie | Outperform | $32.20 |
| Consensus Average | Buy-weighted | ~$34.36 |
The consensus average of approximately $34.36 implies roughly 70%+ upside from the verified price range of $19.86-$20.11, with no Sell ratings in available coverage. That analyst skew is notable, though the more than 60% decline from the October 2025 peak suggests the market has been pricing in execution risk the brokers have not.
Three specific conditions need to materialise in H2 2026 for the bullish thesis to hold:
- MAU recovery on Android and lower-end devices by Q3 2026
- Nativo integration completing on schedule by Q3 2026, normalising the associated cost drag
- Advertising revenue benefiting from seasonal H2 spending peaks, validating the 100%+ full-year growth projection
The number that will determine whether Q1’s optimism was warranted
The Q1 result delivered genuine top-line strength. 38% revenue growth, a 329% advertising revenue surge, and a raised full-year guidance range all point to a business gaining commercial momentum.
The profitability story tells a different version. Adjusted EBITDA grew just 7% against that 38% revenue expansion, a divergence that cannot persist into the second half without undermining the investment case.
The core tension: revenue grew 38% year-over-year while adjusted EBITDA grew 7%. That gap is manageable if the second-half catalysts materialise on schedule. If they do not, it becomes the defining feature of the result.
No Sell ratings exist in verified broker coverage. Full-year EBITDA guidance has been cited in some reports as $130-140 million, but this figure could not be independently confirmed and should be treated as unverified.
The variable that will settle the debate is the EBITDA margin trajectory in Q2 and Q3. The long-term target sits at approximately 35%. The current margin is 12%. Whether the more than 60% share price decline from October 2025 represents a buying opportunity or a fair re-rating depends almost entirely on which direction that margin moves next.
ASX return concentration data adds a structural lens to the share price decline context: research into 15 years of ASX 300 performance shows that only 36% of Australia’s largest listed companies beat the index over that period, a base rate that frames the challenge of assessing whether a more than 60% drawdown from peak represents mispricing or a return to fair value.
This article is for informational purposes only and should not be considered financial advice. Investors should conduct their own research and consult with financial professionals before making investment decisions. Past performance does not guarantee future results. Financial projections are subject to market conditions and various risk factors.