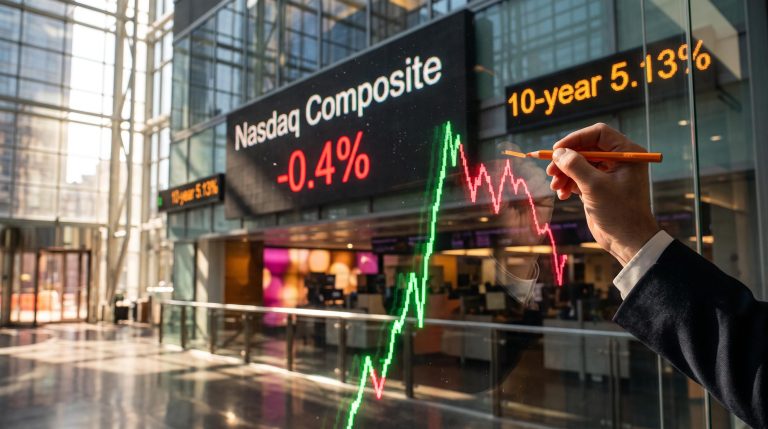
The S&P/ASX 200 slipped 0.71% on Friday, the kind of move most investors would scroll past. Underneath the index, though, the session was far weaker. Across the wider ASX 300, decliners outnumbered advancers by roughly five to one, and small caps fell more than twice as hard. This is how rising bond yields can hit ASX portfolios without much showing up in the headline number.
The trigger came from the US. October core inflation rose 0.3% for the month against a 0.2% forecast, the US 10-year Treasury yield pushed towards 5%, and traders leaned harder into a December rate hike by the Federal Reserve. If you hold gold miners, uranium producers or property trusts, it matters whether you misread a day like this as a company problem or a rates problem.
Here is how to read a rate-driven rotation, using this one session as the worked example.
Why did a 0.7% fall hide a much broader sell-off?
The benchmark closed down 64.6 points at 9,082.2. It still finished the week 61.4 points (0.7%) higher. Both numbers suggest a calm market.
The sector scoreboard tells a different story. ABC News reported that nine of 11 sectors finished lower. The end-of-session figures from Market Index’s Evening Wrap, written by Carl Capolingua, show where the damage landed.
| Sector | Move | Rate-sensitivity link | Key stock example | Direction vs. yields |
|---|---|---|---|---|
| Utilities | +1.28% | Regulated, contracted cash flows | APA +1.6% | Held up |
| Comm Services | +0.19% | Defensive subscription revenue | Telstra +0.2% | Held up |
| Financials | -0.44% | Mixed; late buying narrowed losses | CBA -0.5% | Mild pressure |
| IT | -0.78% | Long-dated growth earnings | No single driver cited | Pressured |
| Real Estate | -1.34% | Bond-like income, discount rates | Lendlease -8.4% | Hit hard |
| Materials | -1.61% | Gold’s opportunity cost, commodities | Resolute -4.8% | Hit hard |
ABC’s figures, taken at 2:01pm AEDT, differ from the closing set because they were taken at a different time. The direction is the same: utilities up, materials and real estate at the bottom.
The gap that matters ASX 200: -0.71%. ASX 300 advancers 47, decliners 236.
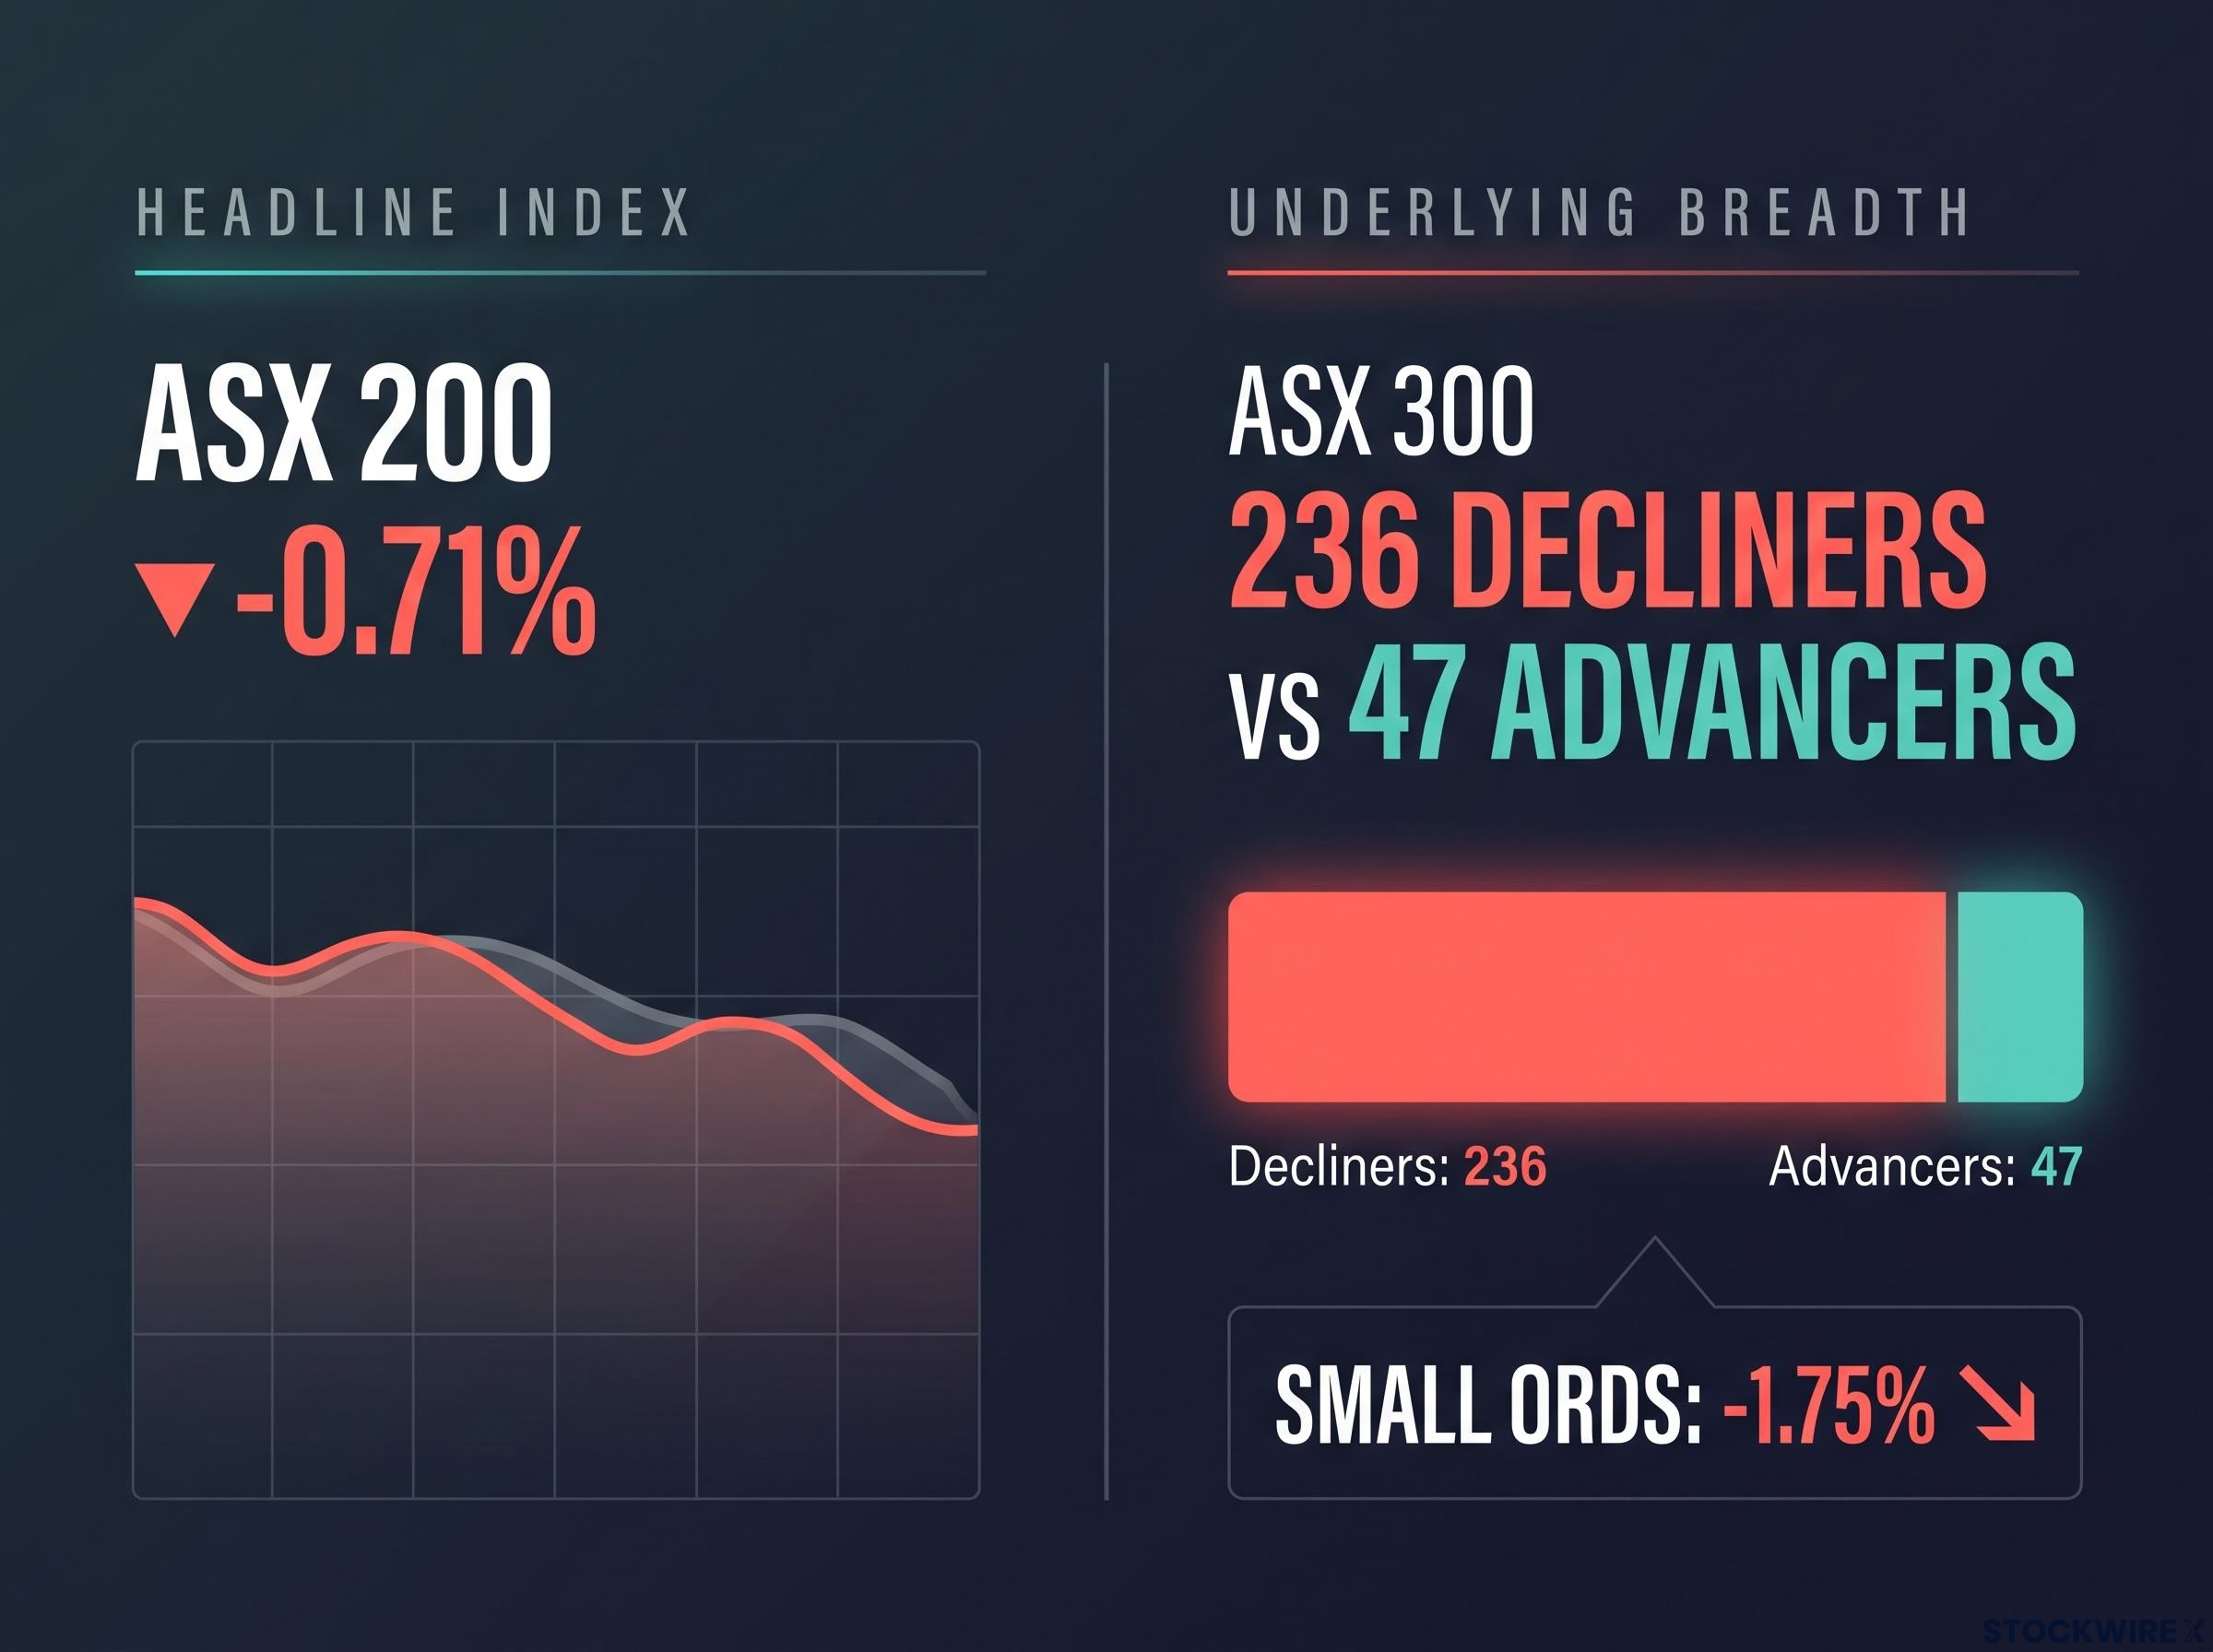
The headline ASX 200: -0.71% masked severe weakness, shown by the ASX 300: 236 Decliners vs 47 Advancers and the Small Ords: -1.75%.
The pattern was not random selling. Money left assets whose value depends on interest rates or commodity prices and moved into steadier earners. The chain of events was clear. Reuters reported the US 10-year yield jumped 12.55 basis points to 4.988% on 10 November after the inflation release, and ABC’s Friday morning snapshot had it near 5.1%. A basis point is one hundredth of a percentage point. Fed Governor Christopher Waller had already said a 0.3% core reading would make him consider a half-point hike at the 8-9 December meeting.
Local rates add pressure. The Reserve Bank of Australia (RBA) lifted the cash rate to 4.85% earlier this month, and ABC put the Australian 10-year yield at 5.13% at 3pm AEDT. Perpetual CT Markets recorded 5.04% at a different time on the same day.
The cause was the price of money, not a sudden change in company earnings. For your portfolio, the useful question is which of your holdings are priced off interest rates.
The discount-rate channel explains why valuations can compress even when earnings are unchanged: a higher yield shrinks the present value of every future dollar of profit, and the longer the cash flows run, the larger the markdown.
When big ASX news breaks, our subscribers know first
Why do gold miners and property trusts fall when yields rise?
The screen showed the losers clearly. Gold miners dropped, uranium stocks fell and Lendlease plunged. Two mechanisms explain most of it, and once you understand them you can apply them in the next rate scare.
Gold and uranium: the opportunity-cost problem
The Gold Sub-Index fell 2.5%. Resolute and Black Cat each lost 4.8%, Genesis fell 4.7% and Evolution 2.9%. ABC reported spot gold dropped about 2.65% to roughly US$3,881 in the morning before it recovered.
Gold pays you no coupon and no dividend. Opportunity cost is the return you give up by choosing one asset over another. When real yields rise, meaning bond returns after inflation, a government bond pays you better for holding it, so gold looks less attractive. A stronger US dollar adds pressure because gold is priced in dollars. Morningstar Australia noted on 12 November that gold was around 10% lower as real rates climbed.
The link is not mechanical. Safe-haven buying, purchases by central banks and geopolitical risk can push gold higher even when yields rise. This week the inflation surprise lifted the dollar and rate expectations together, which was a poor mix for bullion.
Uranium needs more care. Paladin Energy fell 17.6% at the close, according to the Evening Wrap. ABC reported a fall of about 14%, and Capital Brief recorded -14.8% at 2:47pm. On the same day, Paladin completed a fully underwritten $525 million equity raising at $7.80 a share. The URNM uranium ETF lost about 5% overnight even though COMEX uranium rose 0.2% to US$90.70/lb.
A-REITs: why property trusts trade like bonds
Australian real estate investment trusts (A-REITs) are listed vehicles that own property and pass most of the rent to you. Their rental income is predictable, they pay out a high share of earnings and their cash flows stretch decades ahead. Investors therefore value them against government bonds. The sector fell 1.3%, with GPT down 2.3% and Goodman down 2.0%.
Higher yields reach A-REITs in three steps:
- Discount rate: future rent is worth less today, so investors pay less per dollar of earnings.
- Cap rate: the capitalisation rate is a property’s yearly income divided by its value. If cap rates rise while income stays flat, valuations fall.
- Refinancing cost: more expensive debt squeezes the cash available to cover distributions.
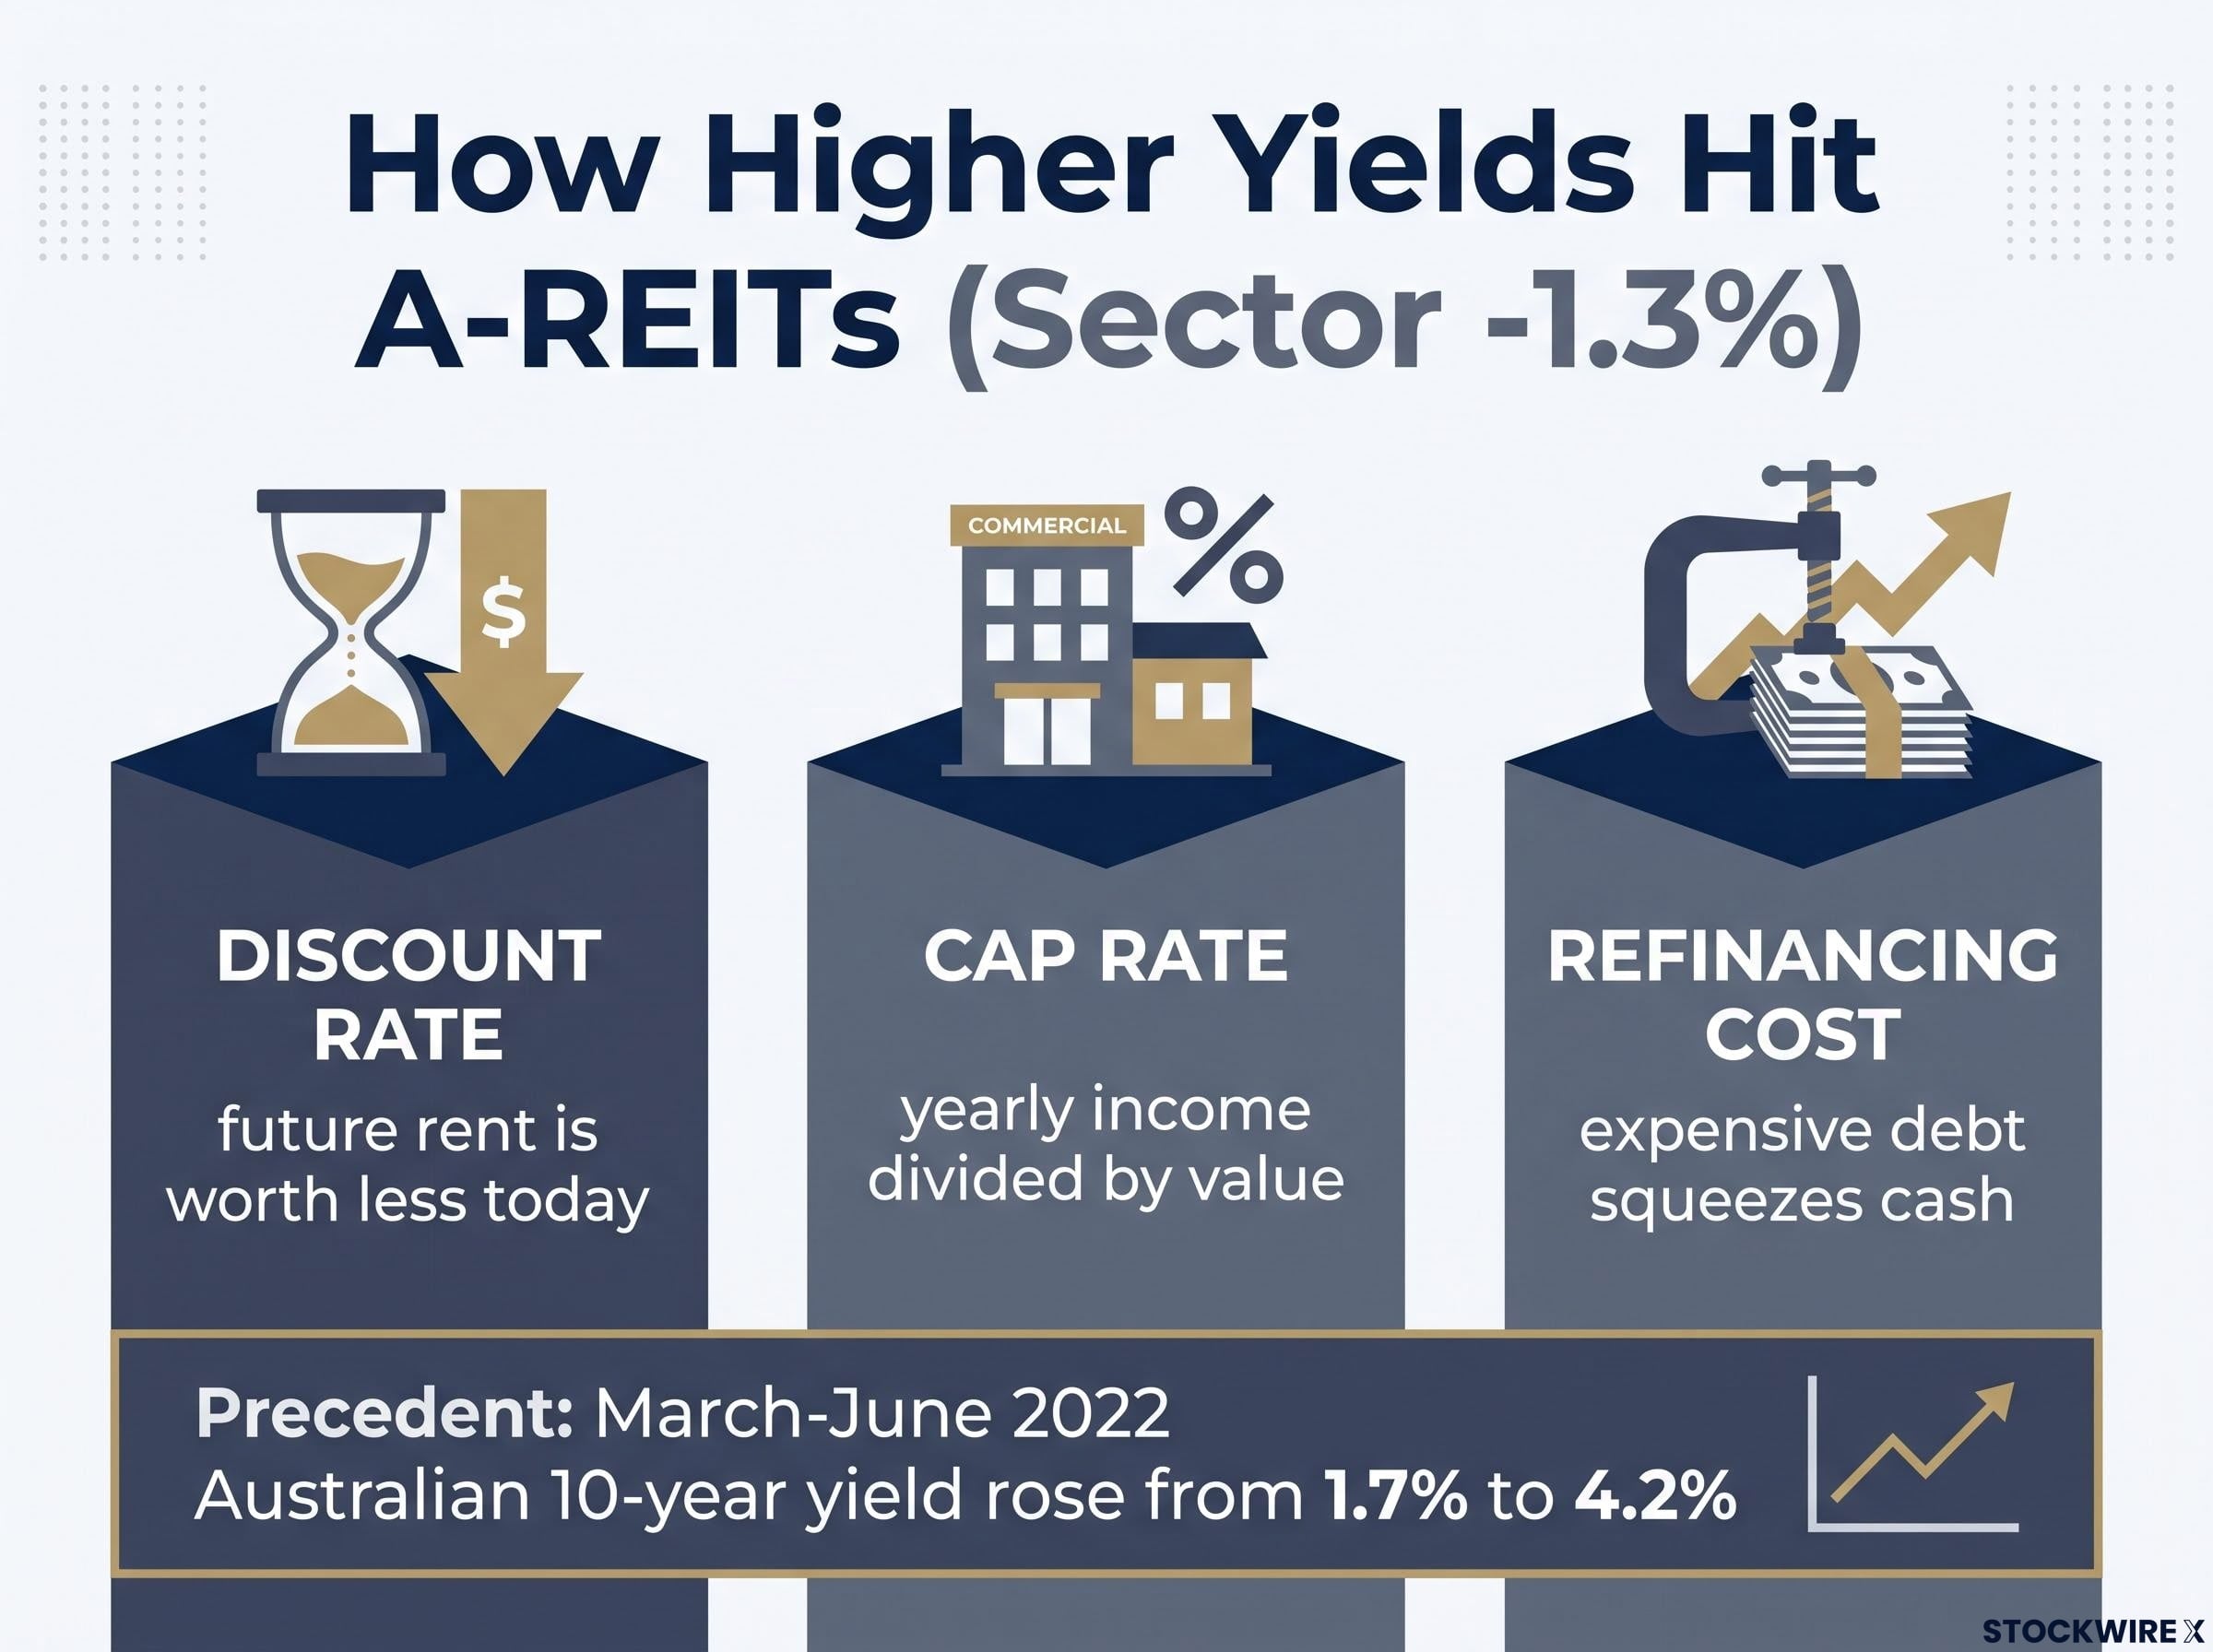
The A-REIT Sector -1.3% drop reflects higher yields, matching the March-June 2022 precedent when the 10-year yield rose from 1.7% to 4.2%.
There is a precedent. The AFR reported that between March and June 2022 the Australian 10-year yield rose from roughly 1.7% to 4.2% and the sector sharply underperformed. VanEck noted that REITs then traded below their net tangible assets. Trusts with fixed-rate debt and strong balance sheets coped better than highly geared ones.
The three steps above sit within a wider set of four rate transmission channels, which also include the economic outlook signal and direct yield competition with government bonds, and all of them reverse when rates fall.
Before you blame yields for a fall, check the stock-specific news:
- Paladin: the equity raising, not only yields.
- Lendlease: a bond redemption process covering about $1.22 billion of bonds.
- Charter Hall (-1.3%): a first strike on its remuneration report, which is not a rates story.
Why did utilities and telcos hold up, and how far does that protection go?
Money that left gold and property had to go somewhere. Much of it went to companies whose earnings you can see years ahead.
What held up
Utilities rose 1.28%. APA gained 1.6%, Origin 1.2% and AGL 0.9%. Telstra and TPG each edged up 0.2%, while Graincorp jumped 5.3% and a2 Milk added 1.0%.
The logic is straightforward. Regulated or contracted revenue, basic services and low commodity exposure give investors predictable cash flows. Redwheel describes utilities as bond proxies for that reason, and Morningstar rates telcos as defensive relative to the market.
Offshore markets have seen a similar defensive rotation, with capital moving in phases from rate-sensitive property into staples and healthcare, and bond-proxy defensives with stretched valuations proving to carry rate risk of their own.
The pattern was mixed. In health care, Healius rose 6.5% and ResMed 1.4%, but CSL fell 0.8% and Cochlear 1.1% after strong recent runs. Financials narrowed their losses and rose in the closing auction, possibly from compulsory flows such as super contributions. CBA finished 0.5% lower but about 2% up for the week. ABC’s intraday figures (Utilities +0.6%, Energy +0.3%) agree on direction.
Where the defensive shield thins
That protection only goes so far. Five caveats apply:
- Gearing: large infrastructure programmes need heavy borrowing, and Morningstar flags highly geared utilities such as APA as exposed to higher borrowing costs.
- Reset lag: regulated returns adjust to higher rates only after a delay.
- Discount-rate risk: contracted cash flows still lose present value when rates rise.
- Yield competition: with bonds near 5%, you may stop paying a premium for utility or telco dividends.
- Operational factors: power prices, weather, maintenance, churn and regulation can outweigh the defensive effect.
On days like this, defensive stocks gave you a relative cushion, not a guarantee. If you own a utility, check its gearing and when its regulated returns reset.
How do you read breadth to tell a rotation from a rout?
The index and breadth answer different questions. The ASX 200 measures the combined value of its members, so a few large banks and miners can move it heavily. Breadth counts how many stocks rose against how many fell, which shows how far the selling spread.
On Friday the two measures diverged sharply. The Small Ords fell 1.75%, Emerging Companies 1.11% and the All Ords 0.75%, against 0.71% for the ASX 200. ABC’s opening count showed 145 ASX 200 stocks down, 41 up and 14 unchanged. That snapshot is not directly comparable with the ASX 300 close, and no closing ASX 200 count was found.
| Evidence | Bearish reading | Restrained reading | What would confirm it |
|---|---|---|---|
| 47 advancers, 236 decliners | Broad de-risking hidden by the index | A one-session positioning shift | Weak breadth repeating across sessions |
| Small Ords -1.75% | Risk appetite fading | Small caps feel rate moves first | Small caps lagging after yields settle |
| Week +0.7%, late financials rally | Large caps masking damage | Buyers still active | Follow-through in the next week |
| AUD/USD 0.6795 (-0.20%) | Global tightening pressure | Modest currency move | A sustained slide in the dollar |
Both readings are reasonable on the evidence. The deciding factor is what comes next. Markets have fully priced a 25 basis point Fed hike at the 8-9 December meeting, according to CME FedWatch via ABC, and the odds of 50 basis points are rising.
Compressed equity risk premia add to the concern: with real bond yields around 2%, shares offer less compensation for volatility just as macro uncertainty rises, which leaves little buffer if the Fed surprises again in December.
You can run this checklist on the next rate-driven session:
- Check yields and the dollar: did both rise together?
- Compare the sector pattern with rate sensitivity: did gold, property and long-duration names fall while utilities rose?
- Compare the index with breadth and small caps: a wide gap signals hidden selling.
- Separate stock-specific news: remove raisings, bond moves and AGM votes before you draw conclusions.
One session of weak breadth is a prompt to check your rate-sensitive holdings. It is not proof of a lasting bear market.
What this session means for your portfolio before the next Fed decision
Friday showed a clear rate-driven rotation and unusually weak breadth, but not conclusive evidence of a lasting downturn. Gold miners and property trusts fell because of their link to yields, and defensive stocks gained mainly relative to the rest of the market.
The variables to watch are the Fed’s 8-9 December decision and the inflation prints that follow. A half-point move or another hot core reading could extend the rotation. Softer data could reverse it.
Until then, three questions help frame your exposure: how much of your portfolio depends on long-duration cash flows, how geared your income holdings are, and whether their yields still compete with bonds near 5%.
This article is for informational purposes only and should not be considered financial advice. Investors should conduct their own research and consult with financial professionals before making investment decisions.