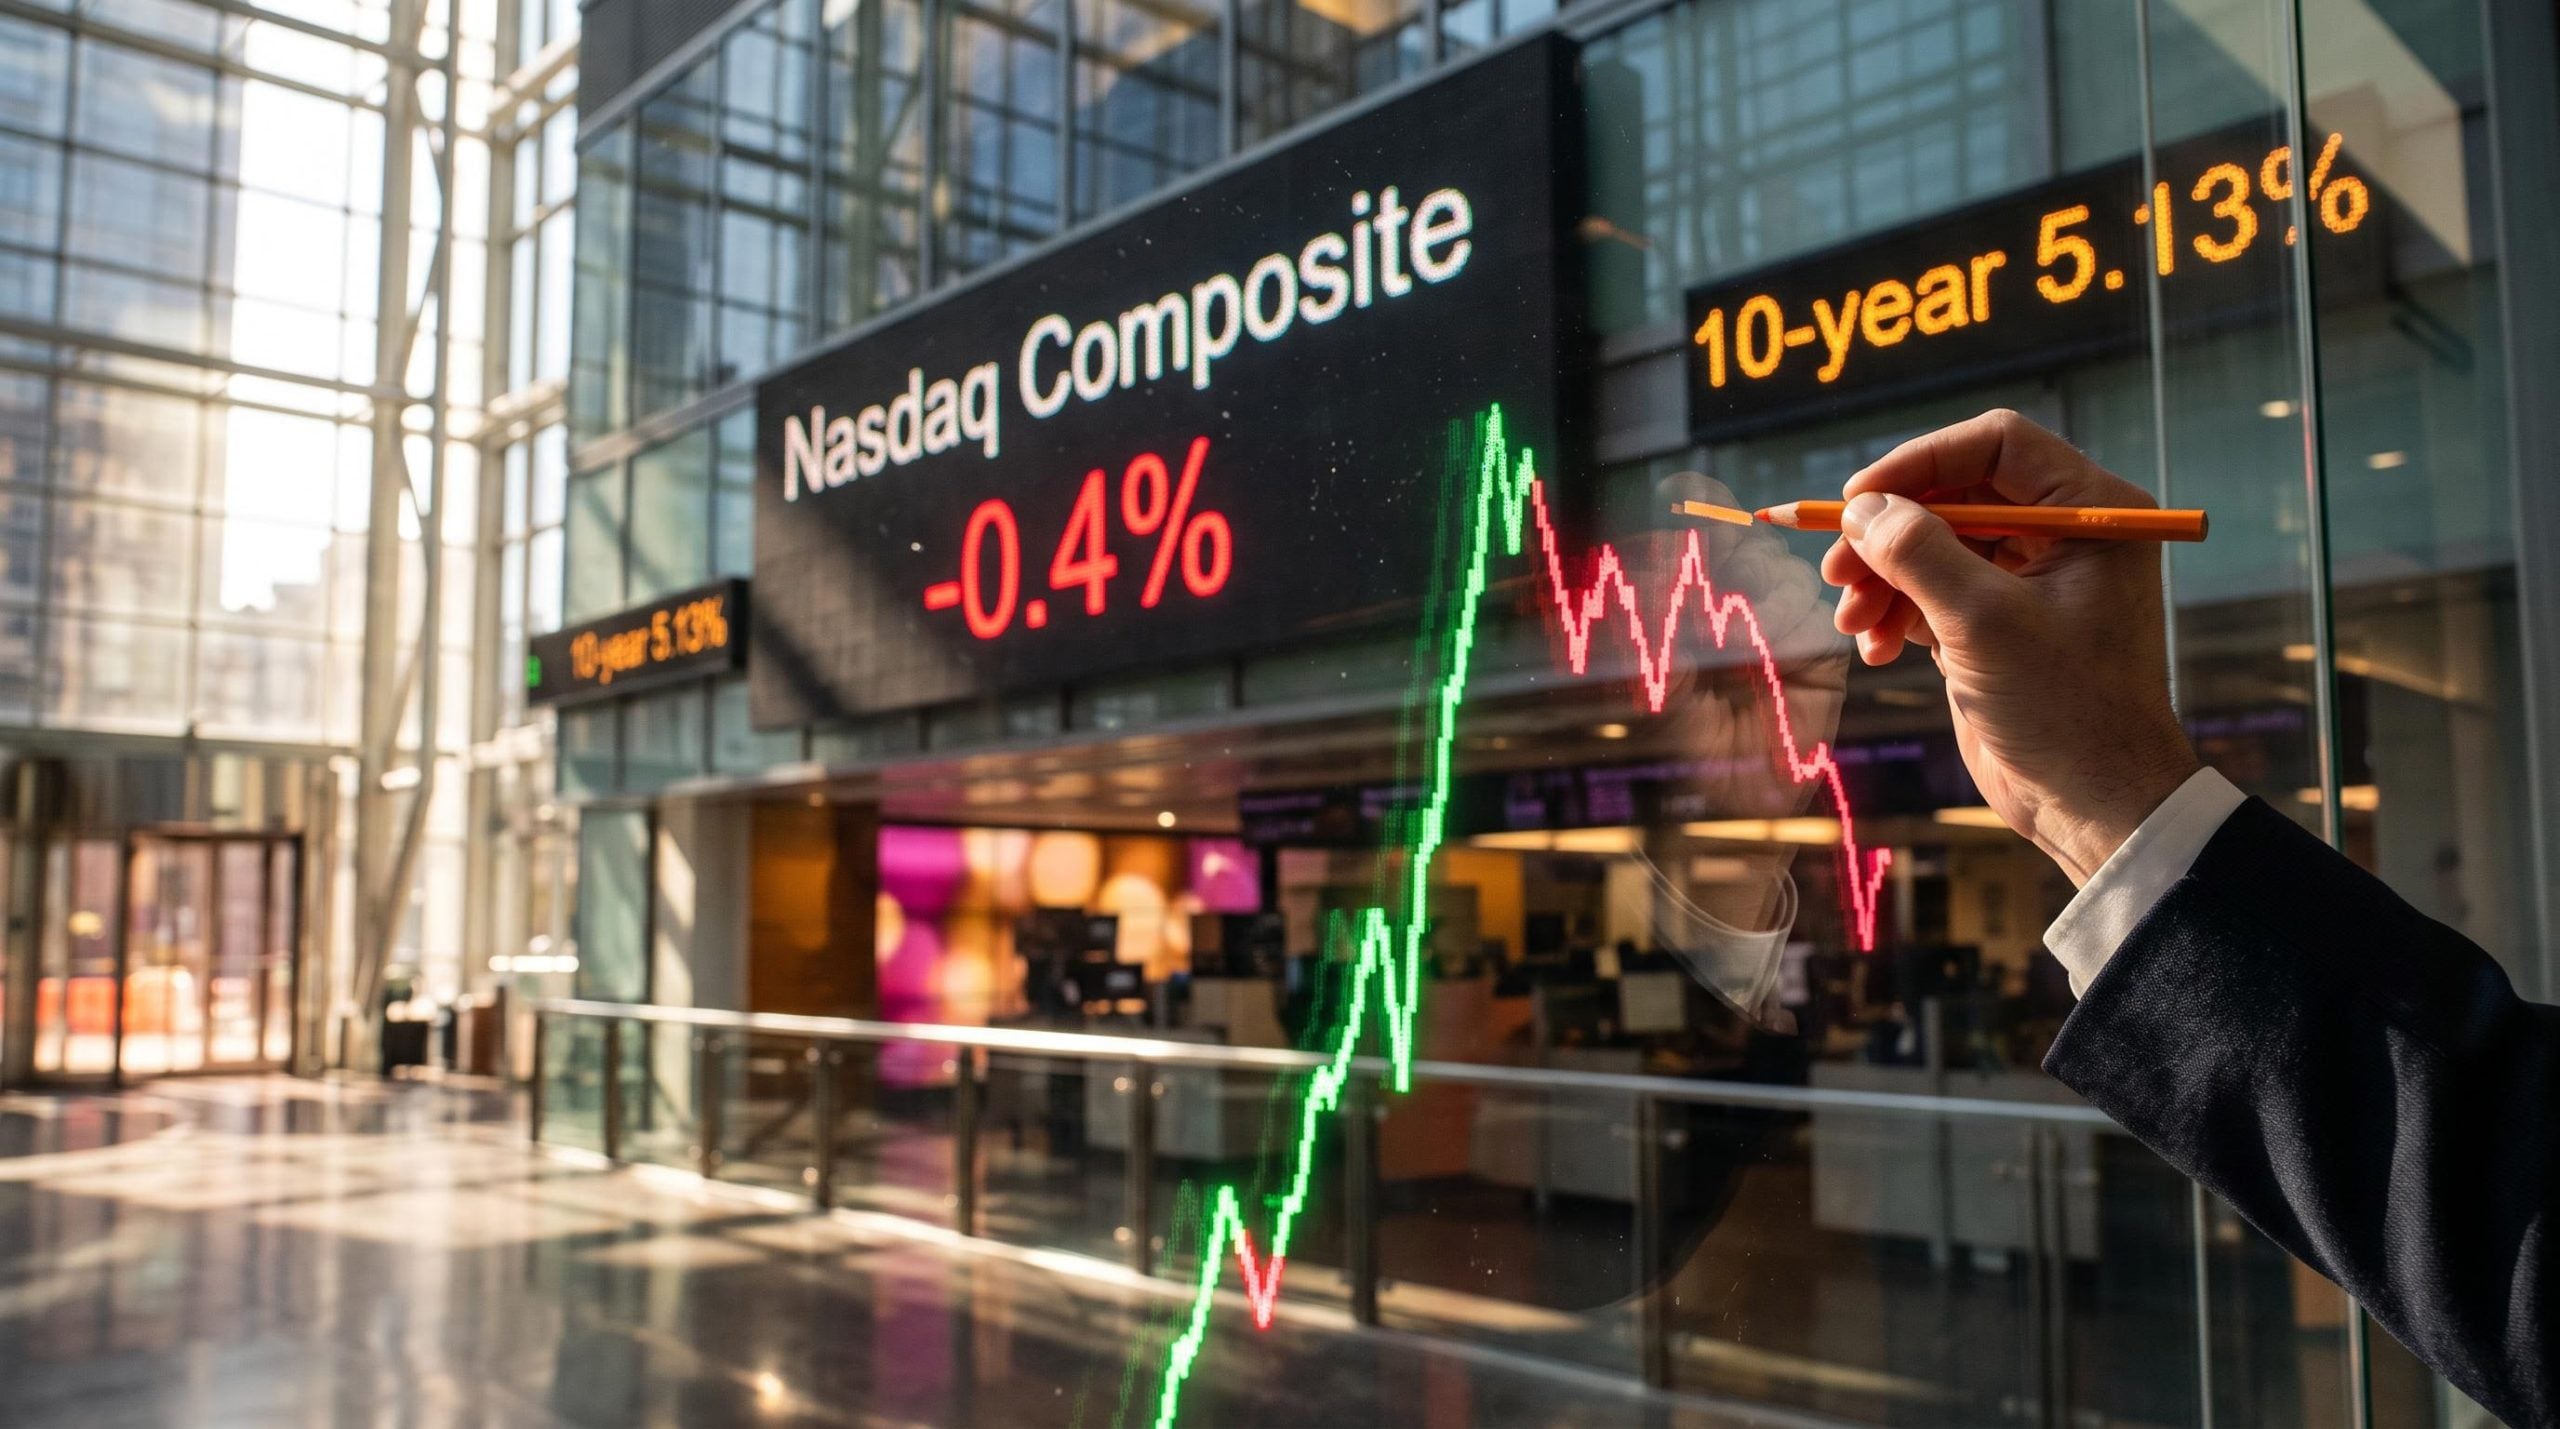
The Nasdaq Composite gave back 0.4% on 12 November, a day after rebounding. The 10-year Treasury yield pushed back above 5% to roughly 5.13%. A tech bounce violent enough to feel like a fresh uptrend is already wobbling. Some of the sharpest rallies in market history have happened inside bear markets, not at their ends.
Options trader Todd “Bubba” Horowitz, founder of bubbrading.com, made that case on Tasty Live. He argues the recent surge is short covering inside a bear market rally, and that the Nasdaq’s decline is not finished.
His call matters now because three pressures are building at once. October inflation came in hot. Futures markets are pricing a December rate hike. The AI trade rests on trillions of dollars in commitments that rarely show up on balance sheets.
Here is his case, the strongest arguments against it, and the specific signals that would separate a relief rally from a genuine recovery.
What makes this bounce look like a bear market rally rather than a new uptrend?
How short covering works
Short sellers borrow shares and sell them, hoping to buy them back cheaper. When prices rise quickly, they have to buy back those shares to cap their losses. That buying pushes prices higher still. Stop-loss orders, margin calls and systematic trading models then force more buying.
The result can be a steep rally with no improvement in earnings, credit conditions or anything else fundamental. Horowitz predicted exactly this kind of violent squeeze the week before, and it arrived even through Nvidia-related troubles.
Andrew Lapthorne of Société Générale described the mechanics in recent commentary, as reported. Crowded positions in AI and oil reversed. Long-short funds were forced to sell tech and buy back their defensive shorts, which amplified the swing in both directions.
Horowitz is not selling into the bounce yet. His plan is to sell strength and re-establish short positions once the market becomes overbought again, meaning prices have risen too far, too fast, relative to recent trading.
What history shows
Horowitz likens today’s setup to a blend of 2001 and 2008. The precedents below are reported figures that have not been independently confirmed. Even so, they show how often large rebounds have failed.
| Period | Approximate rally size | What followed |
|---|---|---|
| 2001 (dot-com bear) | ~19% | Bear market continued to the October 2002 low |
| November 2008 | ~18.5% | New lows followed |
| 2022 | ~17.4% (one of roughly four relief rallies) | S&P 500 fell about 25.4% peak to trough |
Horowitz said the VIX, Wall Street’s main gauge of expected volatility, spiked to nearly 25 on the prior Friday. Independent readings located for November were lower, between 16.61 and 18.26.
The speed of a rebound tells you how the market was positioned, not whether conditions have improved. On its own, the size of this bounce is weak evidence. Market breadth (how many stocks are rising), credit spreads, earnings revisions and a break above the prior high are better confirmation.
A Nasdaq dead cat bounce has historically been followed by a further 5% decline within a month in more than half of past sharp drops, which is why the size of an early rebound says so little about direction.
When big ASX news breaks, our subscribers know first
What is the AI financing risk, and how much of it sits off the balance sheet?
How the obligations work
An off-balance-sheet obligation is a financial commitment that does not appear as debt on a company’s main accounts. In AI, a special-purpose entity (a separate company set up for one project) might borrow against chips or data centres. The chip supplier then offers support: residual-value guarantees, minimum-revenue guarantees, leases or take-or-pay contracts, which oblige a buyer to pay whether or not it uses the capacity.
Circularity adds a second layer. A chip company invests in a customer, the customer uses that money to buy the company’s chips, and the resulting revenue justifies further investment. Growth can look stronger than end demand really is.
According to reported analysis, a weak AI end market could send losses back to suppliers through four channels at once:
- Falling demand for chips and hardware.
- Guarantees that pay out if assets lose value or customers default.
- Purchase commitments for cloud capacity that may no longer be needed.
- Equity investments in AI labs that lose value.
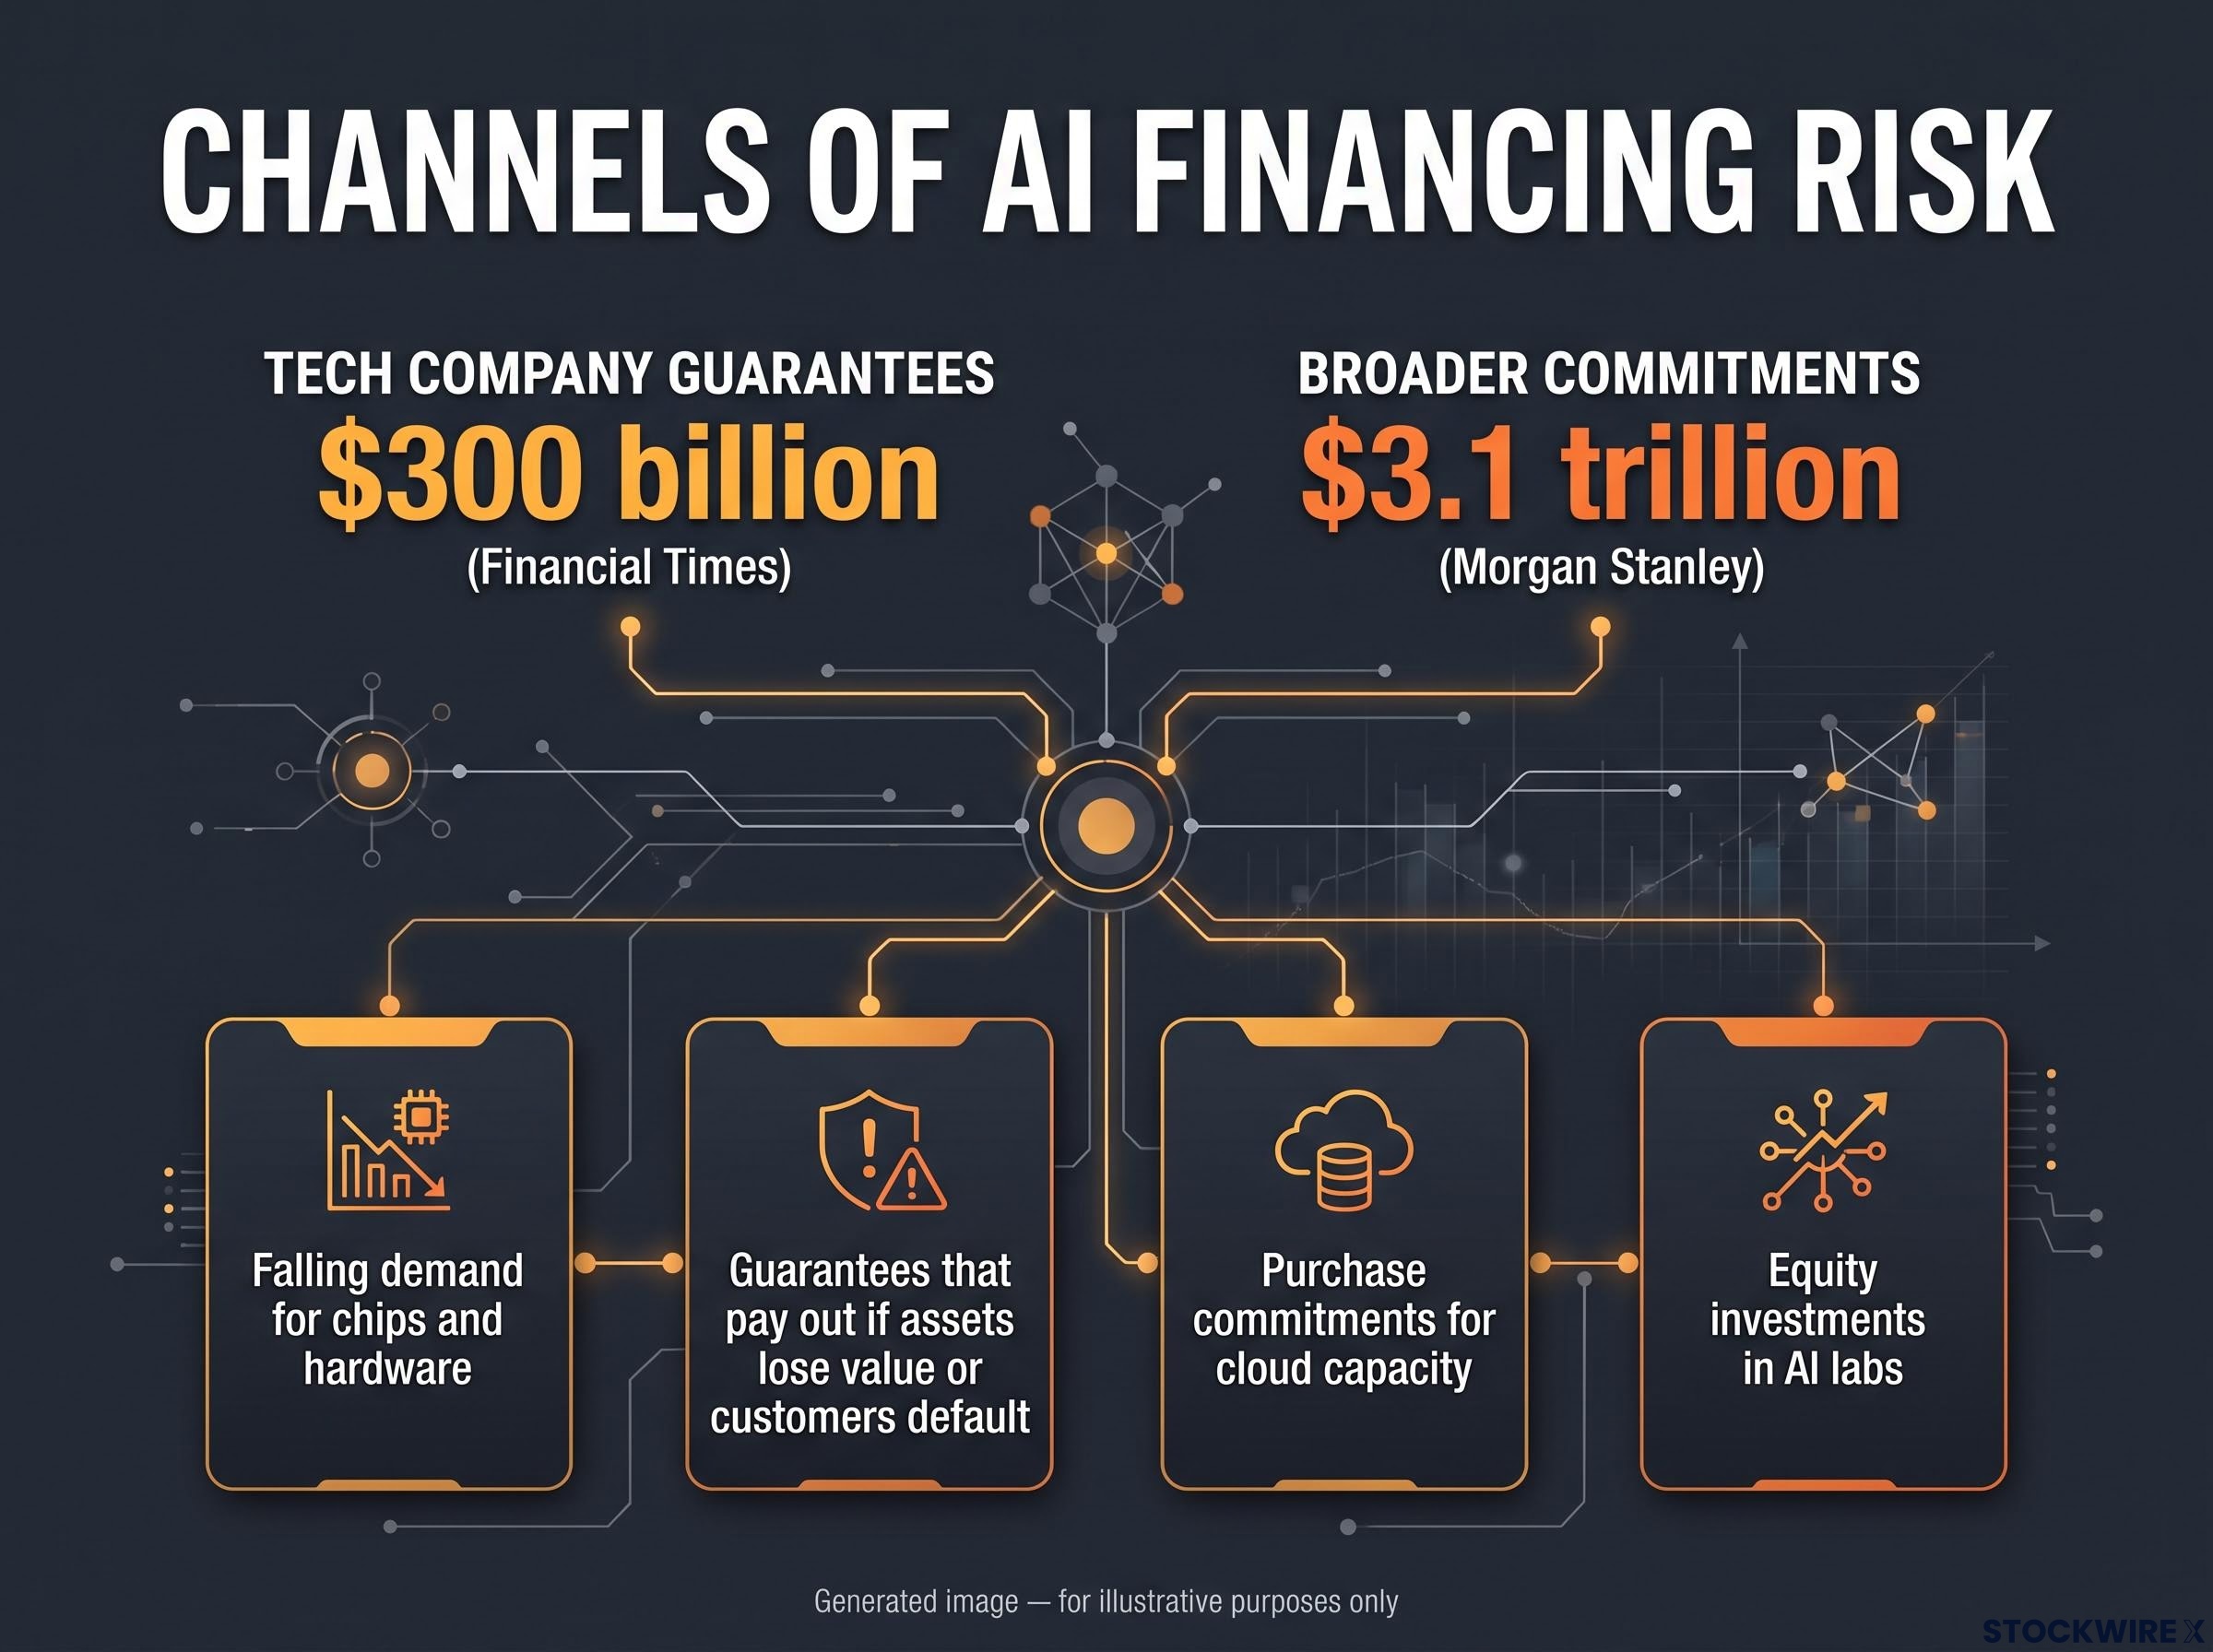
The Financial Times estimates $300 billion in tech company guarantees, while Morgan Stanley estimates $3.1 trillion in broader commitments.
The Financial Times, as summarised in secondary coverage, estimated tech companies have provided as much as $300 billion in guarantees for AI data centres and chips. Morgan Stanley put broader commitments and credit support across seven major cloud and chip companies above $3.1 trillion. Neither figure has been independently confirmed, and they define exposure differently.
Horowitz calls the sector’s off-balance-sheet debt “trillions”. He still regards AI as a promising technology, but argues consumers cannot afford it and that AI-driven job losses are a real problem.
The counterarguments
The defence is substantial. Commitments take different forms and are unlikely to come due at once, if ever. AI hardware can keep its resale value because demand is broad, so one failed customer does not make the equipment worthless. The $3.1 trillion figure is not direct debt.
Strategists at Morgan Stanley and JPMorgan go further, arguing that a quick punishment of excess could strengthen the AI cycle over time. Bubble views are split even among industry leaders. Emmanuel Roman of PIMCO and John Connaughton of Bain Capital have warned of capital misallocation.
Two views on AI bubble risk Citadel’s Ken Griffin has said the industry is almost certainly heading toward bubble conditions. Blackstone’s Jon Gray has said investors need not assume a bubble.
The headline numbers measure different things. When you see the next AI financing figure, ask whether losses could actually flow back to suppliers, not how large the number is.
Why does Nvidia’s balance sheet matter as an implicit market support?
That question of who absorbs losses leads straight to Nvidia. The Tasty Live host argued that Nvidia uses its balance sheet for strategic investments and complex supplier financing. That acts as an implicit support for the whole AI trade. By the host’s count, Nvidia has invested about $300 billion over the past two to three years.
Reported components, none independently confirmed, include:
- Nearly $50 billion invested in frontier AI labs
- Up to $36 billion in cloud service commitments
- Up to $105 billion guaranteed for an Ohio data-centre project tied to OpenAI and SB Energy
- Up to $125 billion backstopping a proposed $500 billion financing programme
Estimates of the total vary widely depending on what is counted.
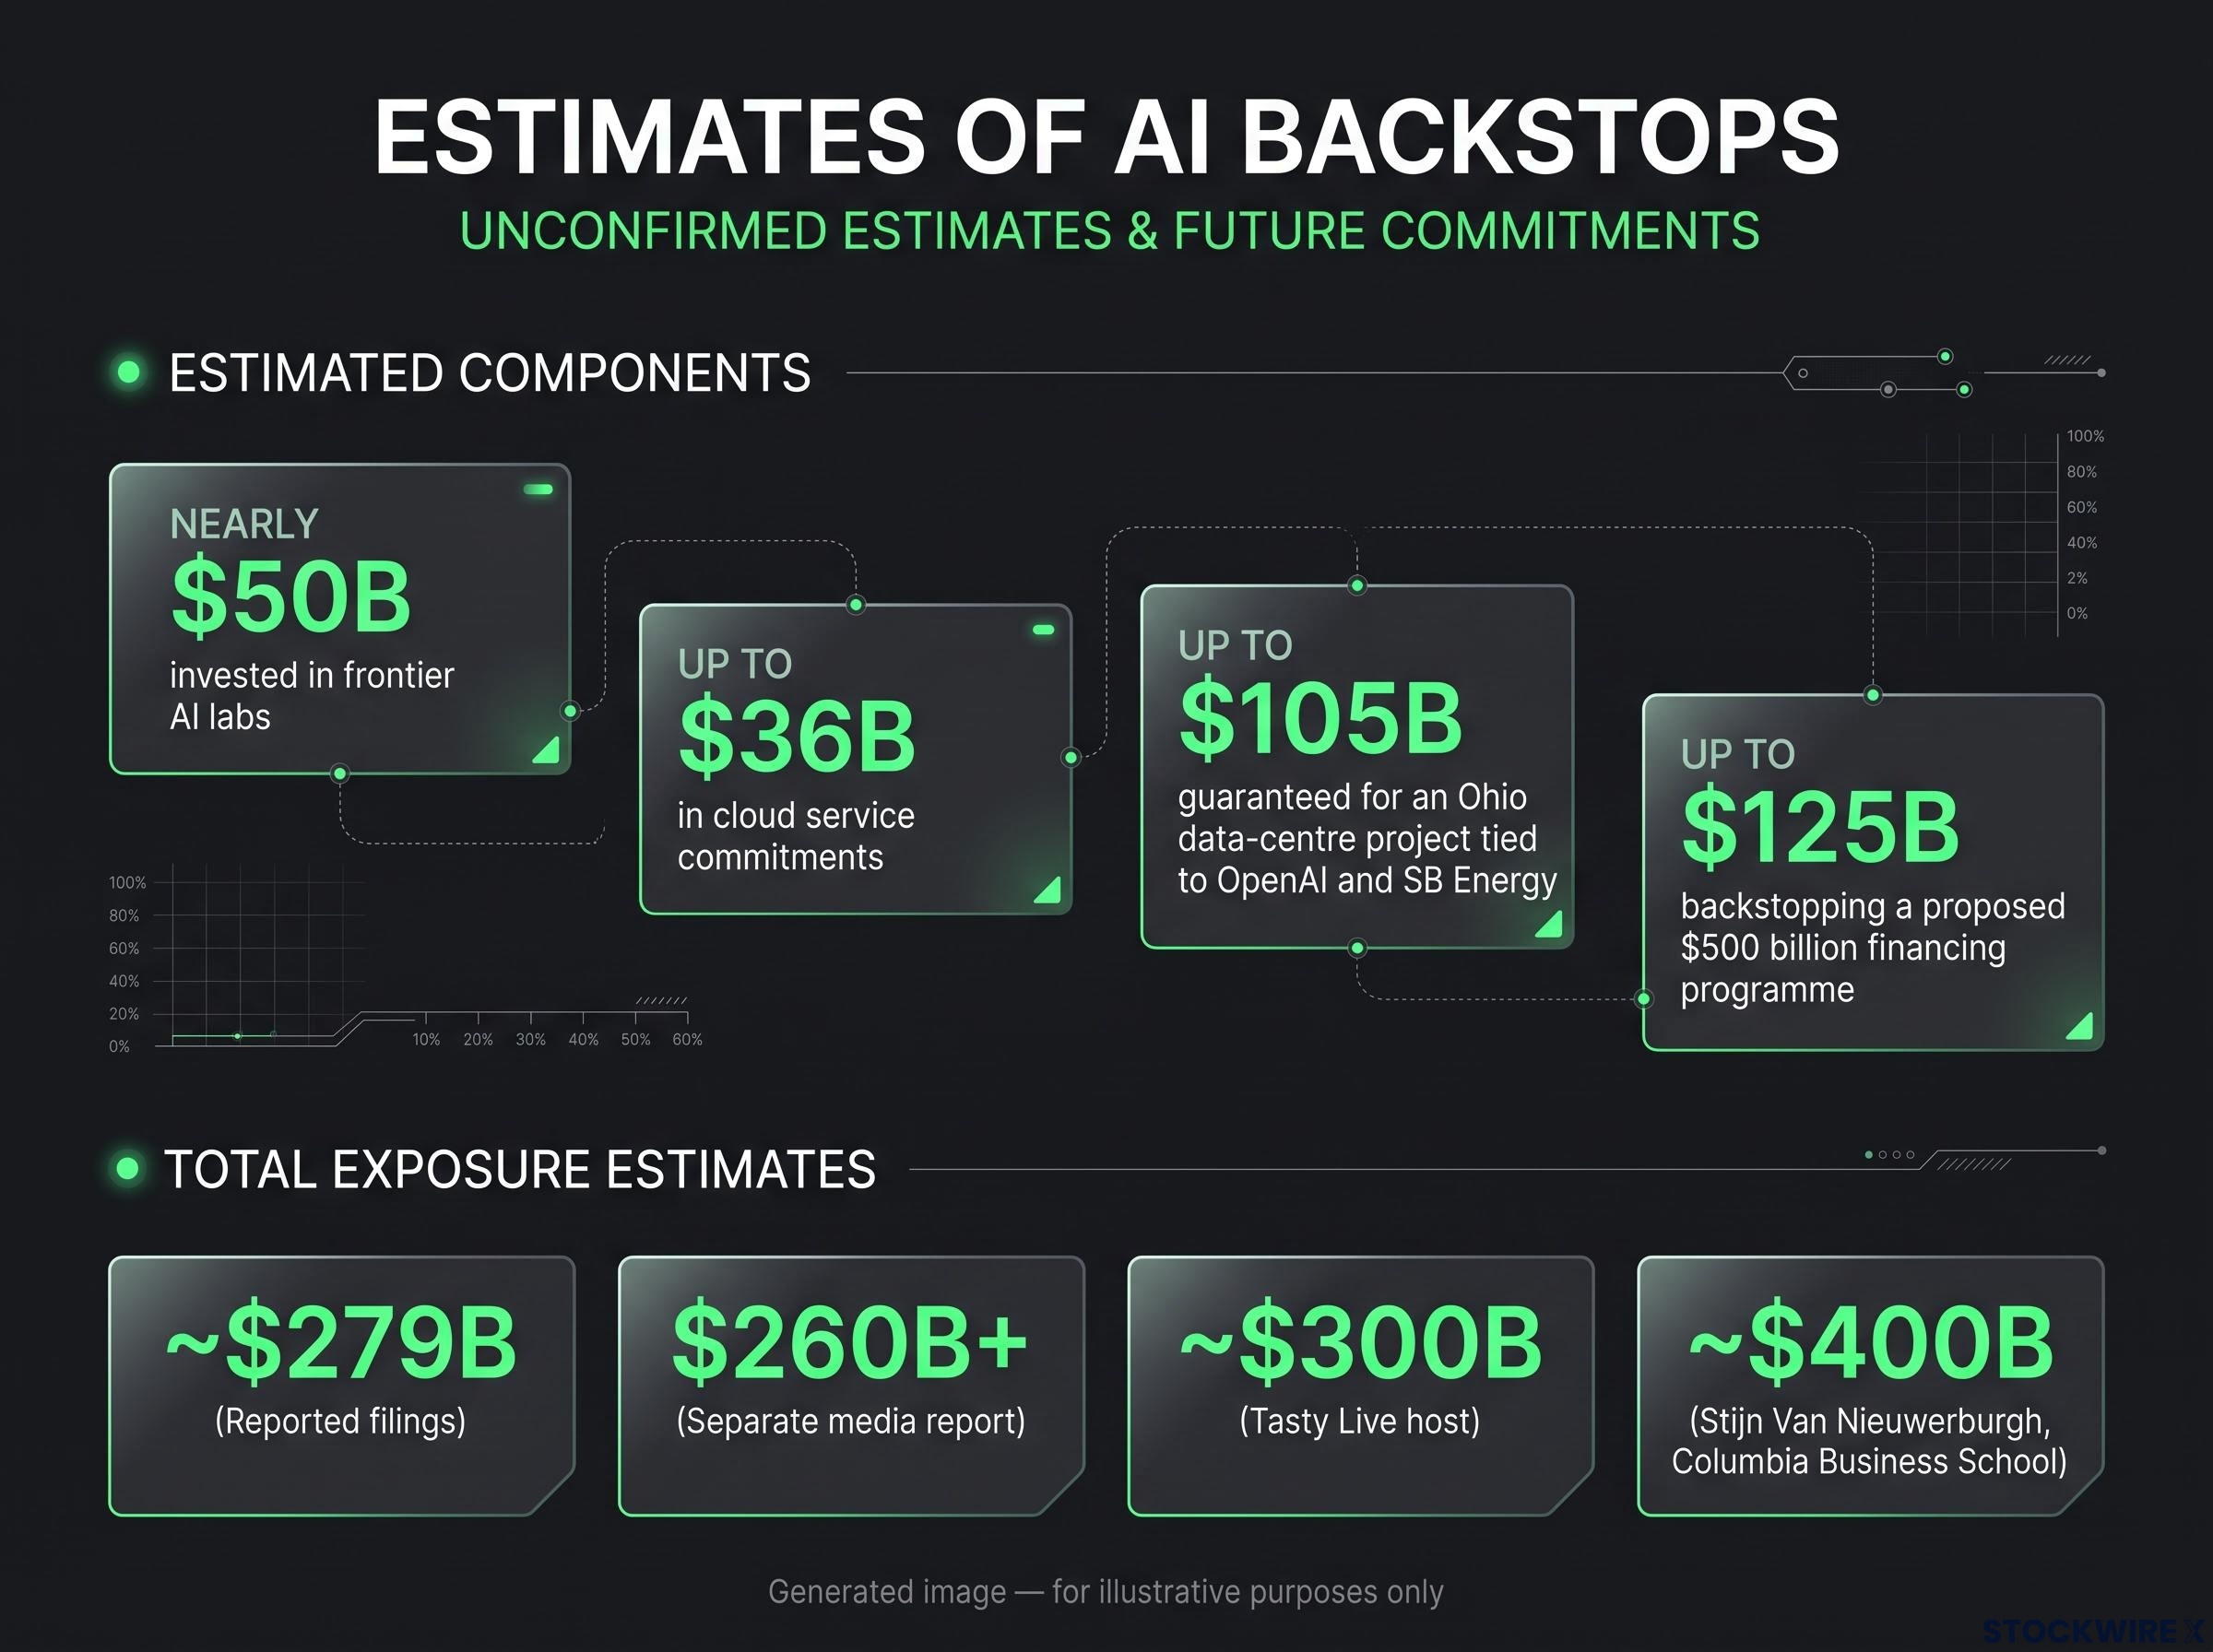
Estimates for Nvidia’s AI exposure range from $260B+ to ~$400B, built on billions in investments, cloud commitments, and data-centre guarantees.
| Source | Figure | What it covers | Status |
|---|---|---|---|
| Tasty Live host | ~$300B | Investment over two to three years | Host estimate |
| Separate media report | $260B+ | Investments, new commitments, potential exposure | Unconfirmed |
| Reported filings | ~$279B | Supply obligations | Unconfirmed |
| Stijn Van Nieuwerburgh, Columbia Business School | ~$400B | Aggregate obligations | Unconfirmed |
AMD and Broadcom might fill supply Nvidia cannot meet, but they do not replicate the backstop. Broadcom has reportedly provided about $29 billion of maximum backing for AI-rack leases tied to Anthropic. No Nvidia-equivalent mix of lab stakes, cloud purchases and project guarantees has been reported for either company.
That is where support becomes exposure. A company that is both the market’s biggest supplier and a financier of its customers can stumble in two ways at once. A setback at Nvidia would hit sentiment and the financing chain together. A reported CEO-exit story was cited as a major factor in the 12 November decline, though the details were not located.
AI capital spending is a related pressure point, with hyperscalers reportedly directing up to 90% of operating cash flow toward the buildout and relying on large debt issuance to close the remaining funding gap.
Horowitz believes the support is currently absent. He still holds Nvidia, has traded around the recent moves and calls it a good company worth buying at lower levels.
Can hot inflation and Fed hikes coexist with falling oil and stressed banks?
The inflation and Fed channel
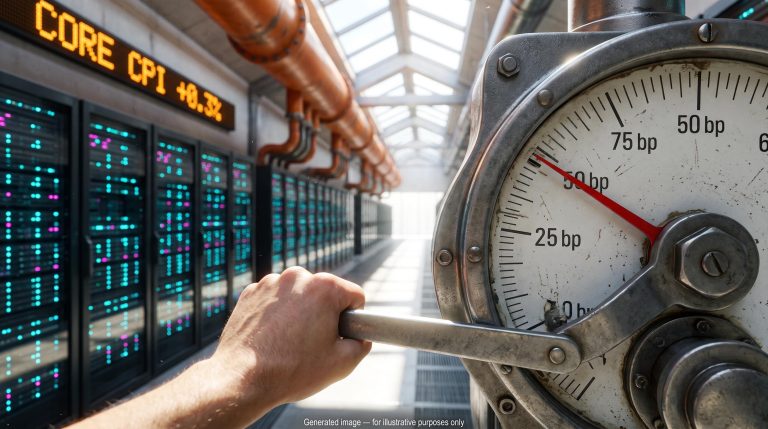
The Bureau of Labor Statistics (BLS) reported on 10 November that October CPI rose 0.4% for the month, with core CPI up 0.3%. After a lapse in government funding, the BLS could not publish standard year-on-year comparisons for many October series.
The 10-year yield climbed above 5%. CME FedWatch reportedly showed 88-89% odds of a 25 basis point December hike and 11-12% odds of 50 basis points, from a current fed funds range of 3.75%-4.00%. Horowitz expects at least two hikes by March, possibly 50 basis points in December.
Banking stress, oil and the dollar
This is where the signals start contradicting each other. Horowitz had expected the 10-year to reach 6% by year-end, but saw a sharp V-shaped reversal from about 5.35%. He argues banking stress is holding yields down. No specific new bank event has been verified.
Reuters reported Brent crude down more than a fifth from late October to about $90, on hopes of an Iran agreement. Horowitz’s source cited a November decline of over 10%, which uses a different starting point. The Dollar Index reached about 102.8, above its prior one-year high of 102.6. Horowitz also points to falling foreign markets such as Korea’s Kospi as a fear signal, though no precise figure was located.
| Indicator | Latest reading | Horowitz’s read | Alternative read |
|---|---|---|---|
| 10-year yield | ~5.13% | Held down by banking stress | Rising on hot inflation |
| Brent crude | ~$90 | A short as the fear premium fades | Easing inflation pressure |
| Dollar Index | ~102.8 | Fear signal | Reflects higher hike odds |
| Kospi | Not located | Fear signal | Local factors |
Horowitz reads the contradictions as a warning. If yields fall because credit is deteriorating, equities may get brief relief, but the cause is weakness, not healthy disinflation.
When yields or oil drop, the reason matters more than the direction. Treat every decline as a question before you treat it as good news.
Which signals separate a bear market rally from a new uptrend?
Horowitz’s main tripwire is a lower high. He expects dip buyers to step in, but if the Nasdaq’s rebound stalls below its prior swing high and turns down, the downtrend has not been repaired. The Nasdaq-100 was reported in a technical correction (a fall of 10% or more from its peak). The reported index levels have not been independently confirmed.
Seasonality offers little comfort either way. A Santa Claus rally is usual, but Horowitz points to the poor 2018 Christmas period as a possible repeat. No reliable probability for a 2026 year-end rally was found.
The midterm election stock market rally offers a useful contrast, since options skew stayed elevated even as the Dow surged, showing that downside protection remained expensive beneath a strong headline move.
The constructive camp makes a credible case. Michael Wilson of Morgan Stanley sees the correction entering its final phase and keeps an 8,000 S&P 500 target. Mislav Matejka of JPMorgan does not treat AI as a continuing sell trade.
Two readings of the same tape Horowitz: a lower high would confirm the bear market is intact. Wilson: if recent lows hold, a retest could set up a year-end rally.
These are opinions and forecasts, subject to change as market conditions develop. Watch these signals, roughly in the order they will be tested:
- VIX behaviour: Horowitz notes one-day jumps of 60-70% typically reverse.
- Last week’s lows: a hold supports Wilson; a break supports Horowitz.
- Yield direction: rising on inflation, or falling on stress.
- Lower high versus higher high on the Nasdaq.
- The December Fed decision.
Until the prior high is cleared or fails, the same data can support both camps.
Weighing the evidence: a rally to respect, not yet a trend to trust
The evidence fits a high-volatility relief rally, driven by short covering and Nvidia-linked support. Hot inflation, rising yields and opaque AI credit structures still stand between this bounce and a durable uptrend.
That is not a settled verdict. If last week’s lows hold and the Nasdaq clears its prior high, Wilson’s year-end recovery case gains real weight. Expect uncertainty to last until one of those tests resolves.
The practical step is to decide now what would change your view. Pick the level, the yield move or the Fed outcome that would confirm or break each thesis. Then let the market show you, rather than reacting to the next headline.
This article is for informational purposes only and should not be considered financial advice. Investors should conduct their own research and consult with financial professionals before making investment decisions. Past performance does not guarantee future results. Financial projections are subject to market conditions and various risk factors.