Nvidia has lost roughly a third of its value since its 6 October peak. Reuters puts the fall at more than 30%, with about $1.8 trillion of market value gone in five weeks. Yet one short-biased trader argues the selling has further to run, and that sharpens a question you may already be asking: is this a washout, or only the first leg down?
The pressure is not limited to one stock. Nvidia, the VanEck Semiconductor ETF (SMH) and the leveraged “neocloud” data-centre operators have all sold off together. Jensen Huang has resigned as CEO. Fiscal Q3 2027 results land after the close on Tuesday, 17 November.
This analysis examines that trader’s view; it is not a forecast. Here is the strongest version of the Nvidia stock bear case, the evidence that supports or weakens each argument, and the specific event that will test it next week.
What does the bear case on Nvidia actually argue?
The presenter, a self-described bear, opened his session with a blunt claim: Nvidia is down 33% in a month, about $1.8 trillion of shareholder value erased, and the stock is “not a real business.” His thesis rests on four pillars:
- Financed demand: Nvidia acts as both banker and supplier to an AI industry that needs constant cash injections.
- Inventory and channel stuffing: Echoing commentator Ed Zitron, he alleges that customers are pushed to accept chips early. Channel stuffing means shipping more product to customers than they can use, so that sales look stronger than real demand.
- Customer concentration: A small number of buyers account for much of revenue.
- Leadership uncertainty: Huang’s exit removes the central figure behind Nvidia’s strategy.
His decline figures sit within the reported range. CNBC-TV18 measured about 35% and $2.2 trillion, but against a different peak series ($239.24, versus $243.37 per ET Now).
Claims versus what the evidence shows
The receivables data give the bear case its firmest footing. Days sales outstanding, the average number of days a company waits to be paid, rose from 45 to 60. Supply commitments climbed from $119 billion to $279 billion. Zitron’s commentary says about 70% of first-half receivables came from five companies, and one customer made up 16% of revenue.
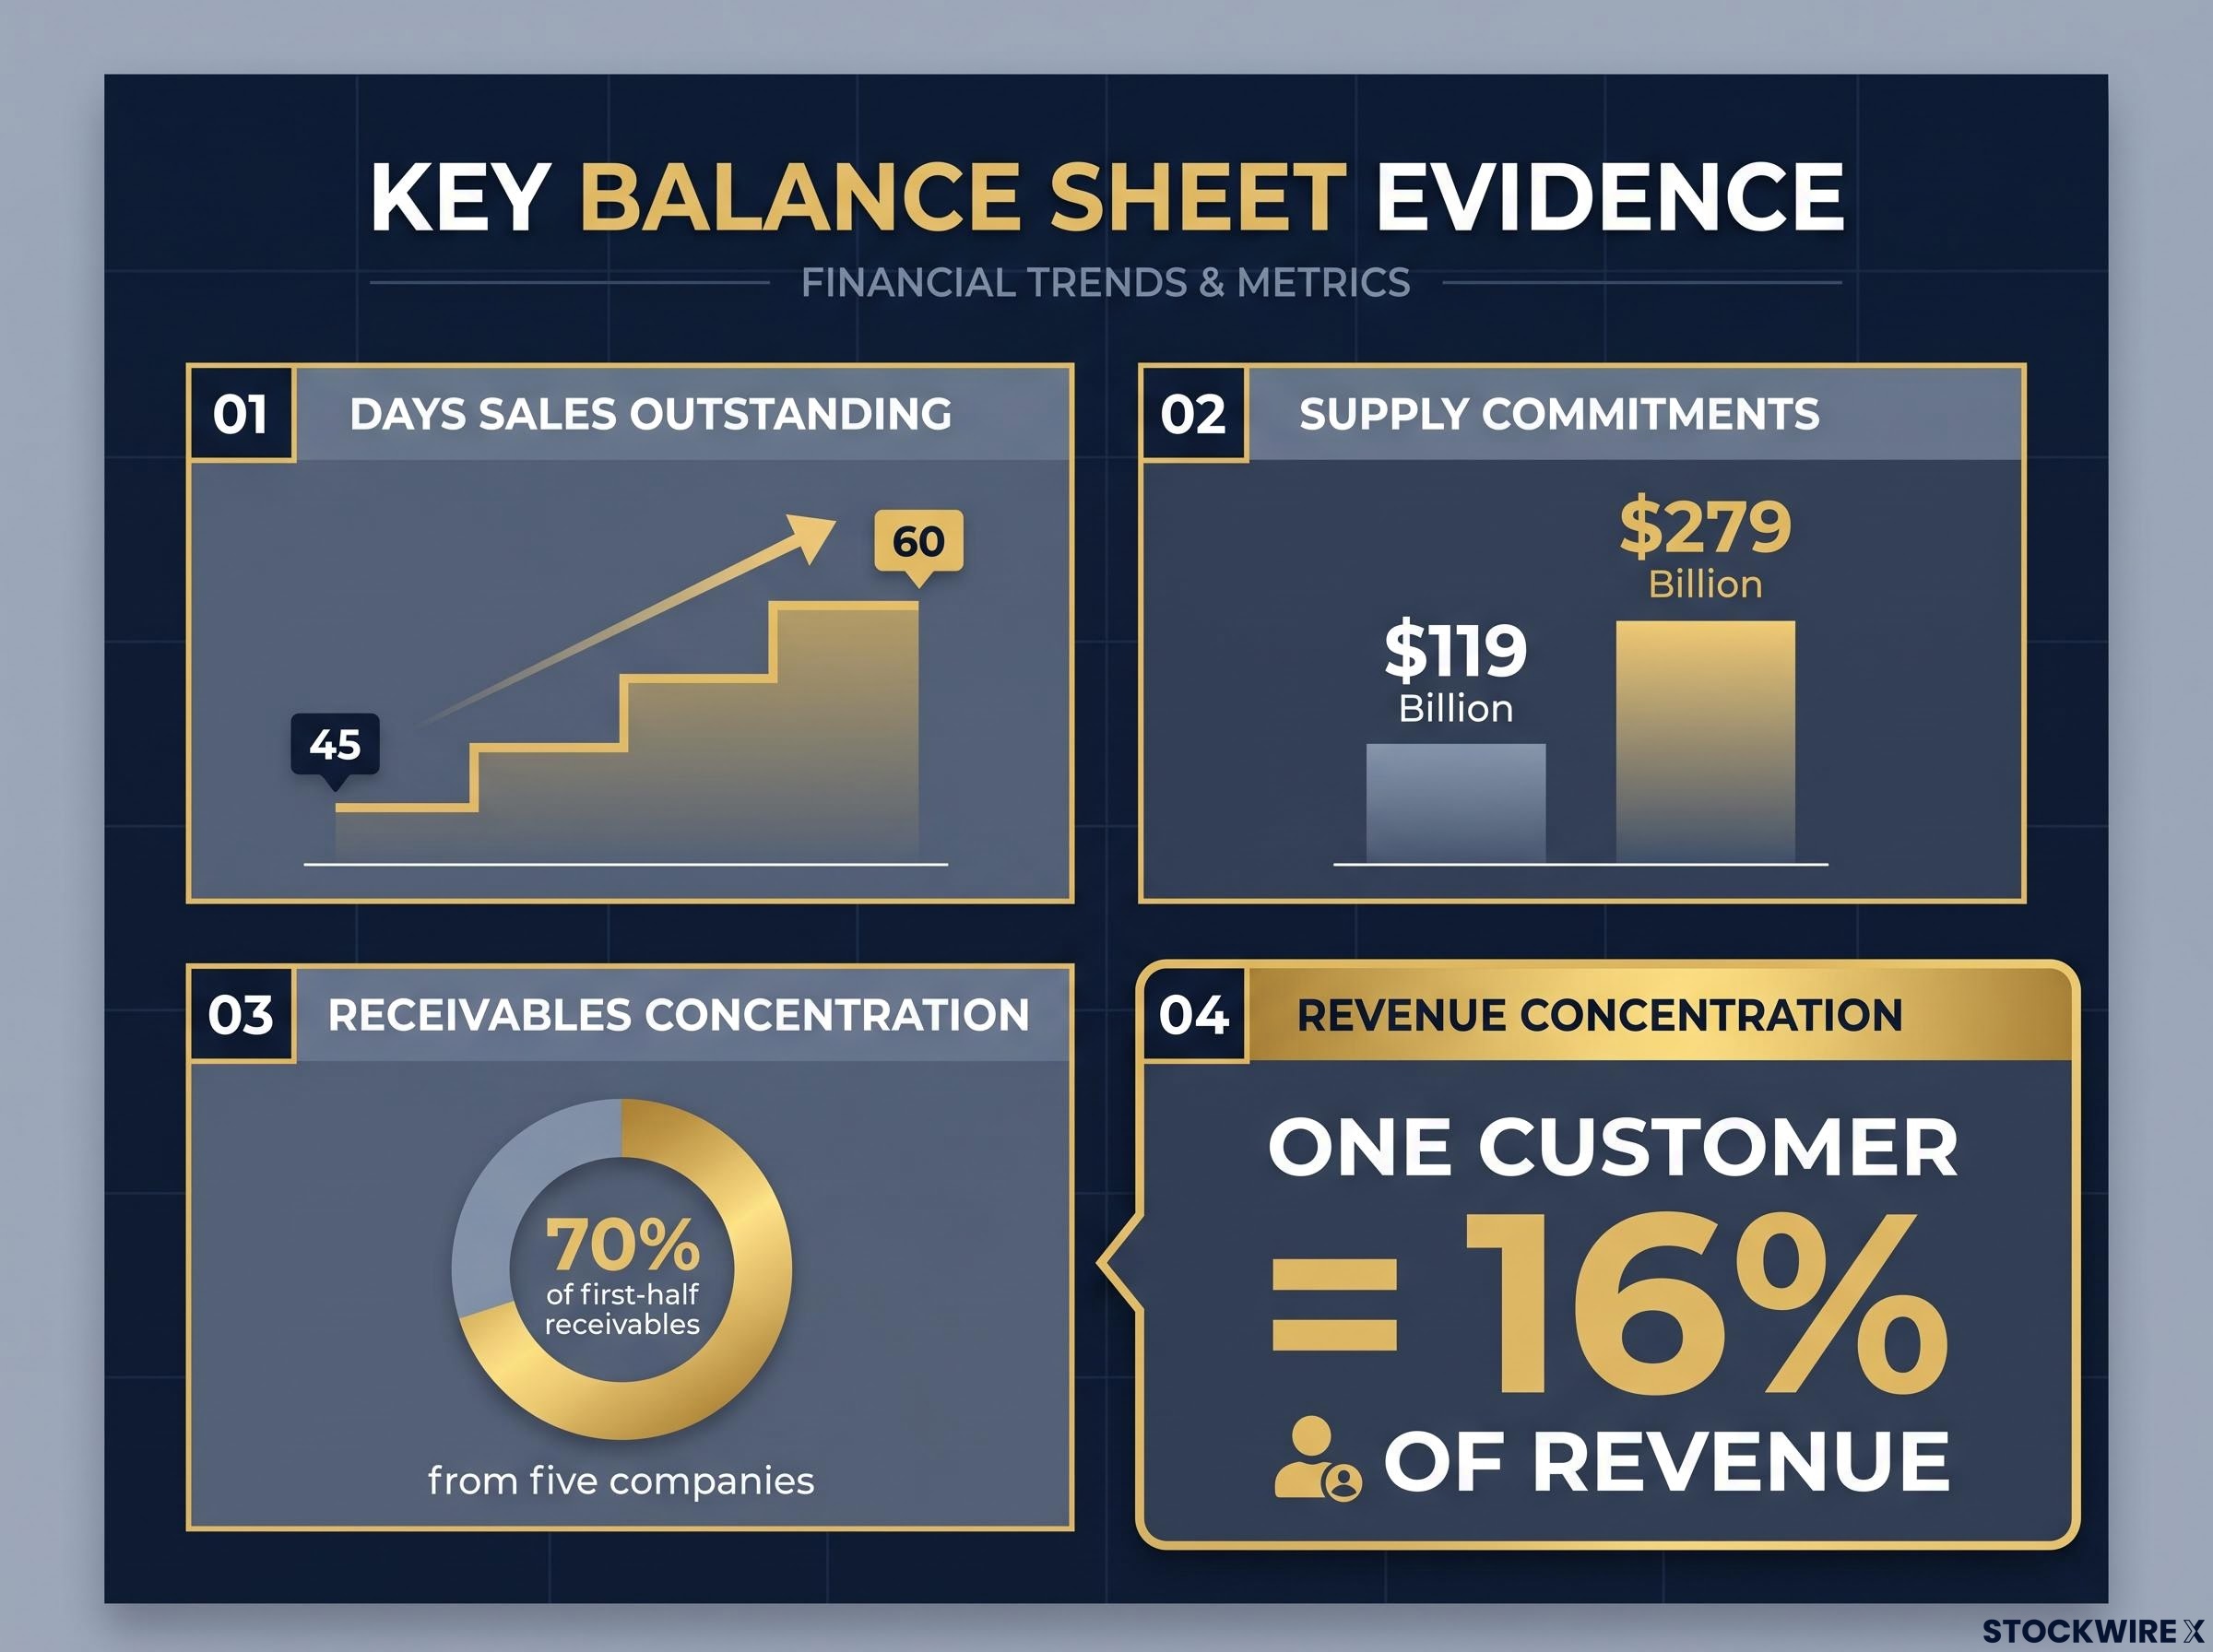
The bear case points to days sales outstanding rising to 60, supply commitments hitting $279 billion, and 70% of receivables coming from five companies.
Nvidia’s CFO, Colette Kress, has linked the longer payment terms to large multiquarter deals with investment-grade customers. She also acknowledged that critics might call them “circular financing.”
The channel-stuffing claim is weaker. Business Insider reported that AWS planned to take delivery of Nvidia GB300 racks while some equipment sat in warehouses because its sites lacked power. Amazon described staging equipment near sites as a “best business practice,” and the reporting did not show that Nvidia forced the deliveries. The presenter’s description of goods “stuck in warehouses” is his own characterisation.
Studio Global’s read (12 November) The evidence supports early delivery and delayed deployment, but does not prove artificial scarcity or forced inventory.
On leadership, Kress is now interim CEO while remaining CFO. The board’s independent investigation found no reason to believe national-security information or company secrets were compromised.
The board’s independent investigation into whether Huang was targeted by a foreign-intelligence effort has so far produced no finding of wrongdoing, and the open question of a named successor may weigh on the stock more than the probe’s verdict.
What this tells you is that the bear case rests partly on balance-sheet evidence you can check in the filings. The “not a real business” language is opinion, and you should weigh it separately.
When big ASX news breaks, our subscribers know first
Where do the chart levels point, and what do they not prove?
The presenter builds his technical case from the semiconductor ETF. In his reading, SMH was rejected at the midline of its price channel near 6 October. A price channel is a pair of parallel lines that contain a stock’s recent highs and lows. He expects any bounce to fail.
If it does, the next stop on his map is a price gap near 400, about 20% lower. A gap is a range where the price jumped without trading, and these zones often attract buyers when price returns to them.
- SMH rejected at its channel midline near 6 October
- Expected failure of the current bounce
- Next major support at the gap near 400
- Nvidia intraday low in the 140s before buyers pushed it back to the 160s
His 35% SMH decline does not match the market data, however.
| Instrument | Presenter’s figure | Verified or reported figure | Note |
|---|---|---|---|
| SMH | Down about 35% | About 24% below peak (Nasdaq); high $559.19 on 21 October, close $501.73 on 12 November | Treat 35% as his claim |
| Nvidia | Intraday dip into the 140s | Close of $168.89 on 10 November | Intraday low versus close, likely different dates |
| CoreWeave | Down almost 8% in session | Down about 49.9%, 6 October to 6 November | Different measurement windows |
| Nebius | Down 18% in session | Down about 47.7%, 6 October to 6 November | Fell 14% on 12 November |
The neoclouds are the weakest part of the AI complex. These are companies such as CoreWeave, Nebius and IREN that rent out AI computing capacity and rely heavily on debt. IREN has fallen at least 40% from its high. That steeper drop reflects repricing of financing risk, not just the Nvidia shock.
Neoclouds are trying to narrow the neocloud funding gap with customer prepayments, which can shorten GPU payback sharply, though they cover chips rather than buildings, power or existing debt.
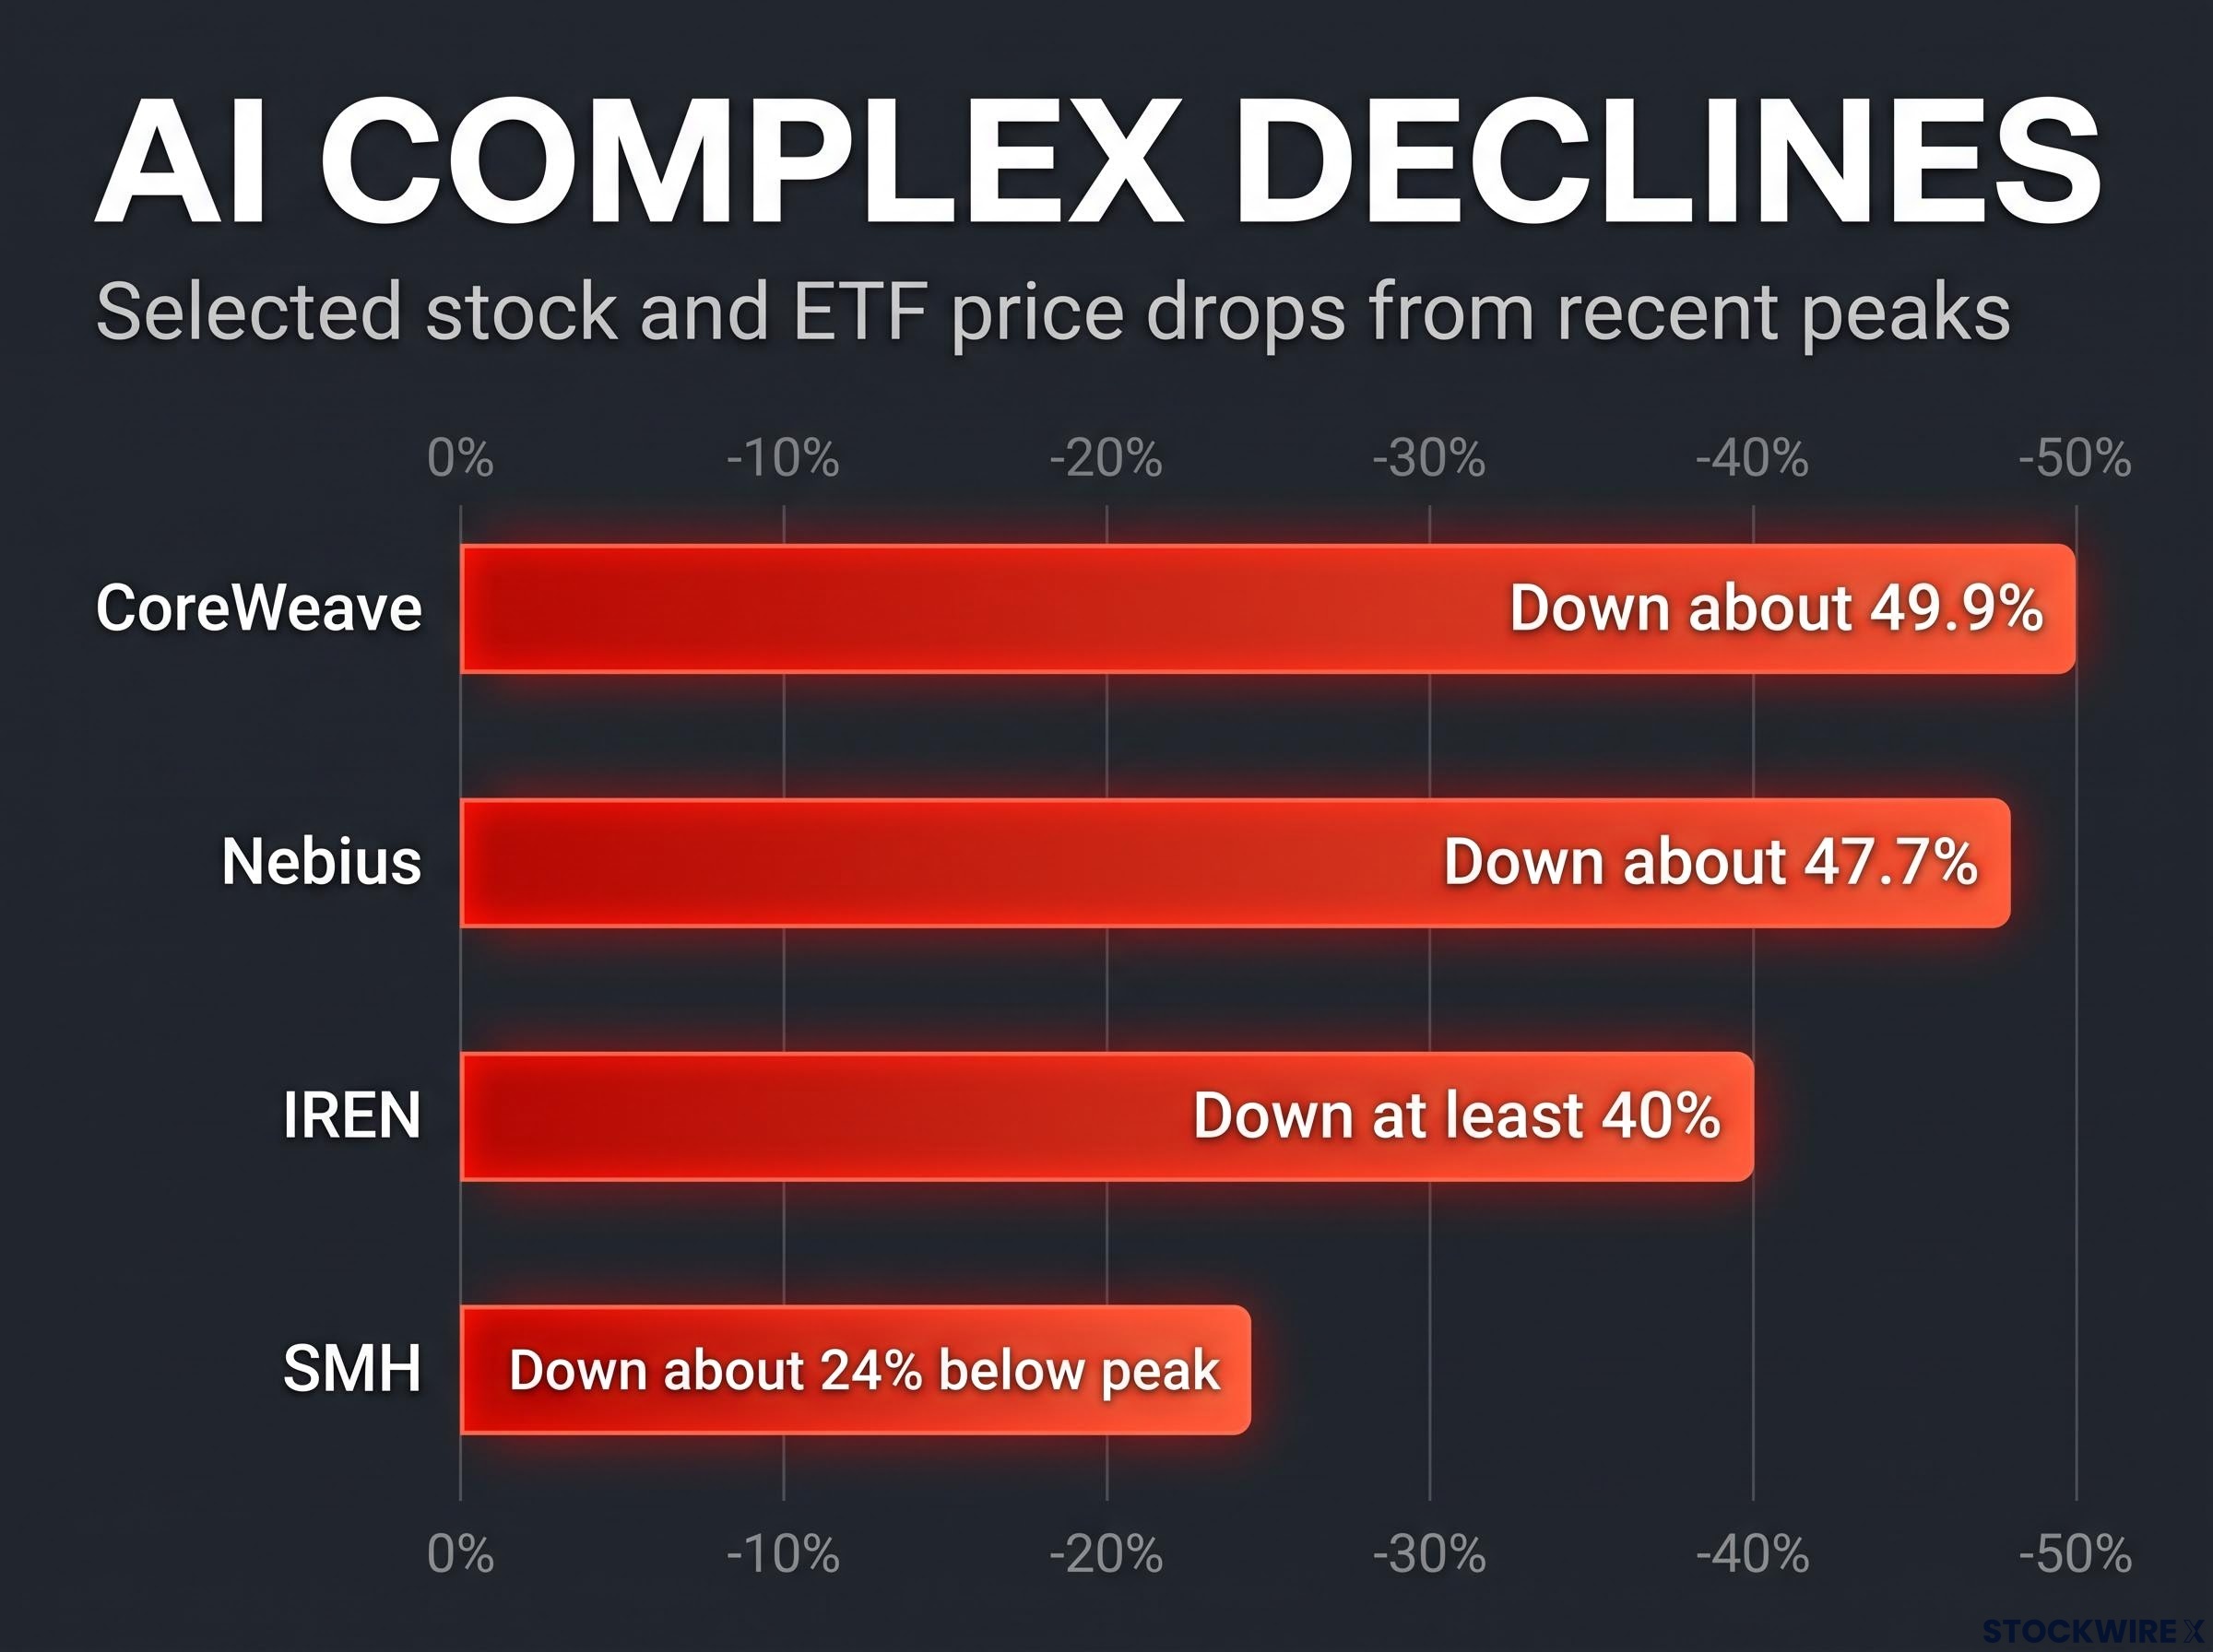
Leveraged neoclouds suffered steep drops, with CoreWeave down about 49.9% and Nebius down about 47.7%, compared to SMH being down about 24% below peak.
His positioning matches the view. He sold December puts after a gain of more than 50% and bought smaller January puts. His Micron short was working, down about 2.5% in the session.
A gap near 400 tells you where a bear expects the next test. It says nothing about whether AI demand is sound.
Does the bear case stretch to bonds, crypto, and metals?
The Nvidia call sits inside a much larger worldview. The presenter calls the past 17-18 years an “everything bubble” sustained by heavy government spending. On that reading, Nvidia is a symptom rather than an isolated problem.
His positioning follows that logic across asset classes:
- Treasuries: The 10-year yield rose to about 5.07% on 12 November. TLT fell 1.31% and his IEF puts show large gains.
- Bitcoin: He puts the peak near 87,000 and the price around 70,000. Investing.com recorded $71,393, down 3.41%, while another report put it at $73,000-$73,500, a gap that reflects timing. His inverse fund BITI is up about 25% in a month, and he holds a Coinbase short.
- Gold and silver: Gold sat below $4,100 an ounce and silver fell more than 3%. His target near $3,500 is a projection from a symmetric-triangle break, a chart pattern of converging trendlines. He is nonetheless staying out of metals shorts.
- Equities: His short book has grown to 40 positions, including Carnival, Lennar, Rivian and Palo Alto Networks. He is also watching a possible head-and-shoulders top in the biotech ETF XBI near 143.
That metals call shows where his positioning turns inconsistent. He sees downside in gold but has stopped shorting it out of loyalty, so his own price projection is not something he is trading.
The presenter’s prediction If markets fall sharply, he expects authorities to take extreme steps such as a short-selling ban.
No such restriction has been identified in this episode. Historically, short-selling bans have reduced visible short pressure without fixing valuation or financing stress. These statements are speculative and subject to change based on market developments.
Seeing one trader short equities, bonds and crypto at once tells you this is a macro conviction. Judge it as a single bet on a bubble unwinding, not as several independent signals confirming each other.
How do the bulls answer, and what is the November 17 earnings test?
The other side is neither quiet nor fringe. Goldman Sachs reiterated its Buy rating and $300 target. Morgan Stanley and UBS both called the sell-off overdone. Morgan Stanley argued that data-centre projects are more likely to slip from 2028 to 2029 than be cancelled.
Wall Street’s chief executives sound the same note. Morgan Stanley CEO Ted Pick says the buildout is in its “second or third inning.” Goldman CEO David Solomon says compute demand still substantially exceeds supply, although he expects bumps along the way.
Hyperscaler AI capex, projected near $725 billion for 2026, is the demand base the bulls lean on, and the ratio of AI revenue to that spending is the sustainability measure to follow.
Structural pressure or cyclical selling?
The split matters for how you read the decline. The structural concerns are financing dependence, customer concentration, power constraints and AI-lab economics. Bernstein has flagged weaker AI recurring revenue on that last point. The cyclical forces are different: Goldman says leveraged-ETF liquidations and negative dealer gamma amplified the fall. Negative dealer gamma means options dealers must sell into a falling market to stay hedged.
Hedge funds also sold AI shares for five consecutive days in October. The 2022 chip slump offers a precedent, when rates and inventory compressed valuations while long-term demand drivers stayed intact. The fairest reading is that concerns about delivery timing, receivables and leverage are supported, but fabricated demand is not proven.
| Issue | Bear reading | Bull reading | What to watch |
|---|---|---|---|
| Receivables | Nvidia funds its own buyers | Terms suit investment-grade multiquarter deals | Days sales outstanding trend |
| Deliveries | Channel stuffing | Rational staging near sites | Inventory and commitments |
| Demand | Financed, not durable | Exceeds supply | Guidance |
| Leadership | Succession risk | Investigation found no compromise | Interim CEO’s tone |
Results arrive after the close on Tuesday, with the call around 5:00 p.m. ET. Consensus sits near $108.84-$108.99 billion in revenue and $2.47-$2.49 in EPS. The presenter expects the numbers to be “dressed up” and will be watching Kress. He also puts the chance that Anthropic delays its release, due a week out, at about 7%, which is his estimate only.
- Receivables: whether days sales outstanding keep rising.
- Supply commitments: whether they grow faster than revenue.
- Guidance: next-quarter revenue against consensus.
- Customer commentary: any signs of capex delays or cancellations.
Earnings will not settle the debate. These numbers will show you whether the financing concerns are widening or easing.
Weighing one trader’s view against the evidence before November 17
The bear case has real, checkable support. Rising receivables, heavy customer concentration and steep neocloud losses are documented. Its price targets, its bubble framing and its prediction of a short-selling ban are opinion.
This is one trader’s view, not a forecast. A technically severe decline does not by itself prove that the business has deteriorated.
Your decision point arrives on Tuesday. Watch the receivables trend, the guidance figure, any capex commentary and how Colette Kress sounds as interim CEO. If those numbers hold steady, the financing worry loses force. If they weaken, the bear argument gains evidence it currently lacks.
Past performance does not guarantee future results. Financial projections are subject to market conditions and various risk factors.
This article is for informational purposes only and should not be considered financial advice. Investors should conduct their own research and consult with financial professionals before making investment decisions.