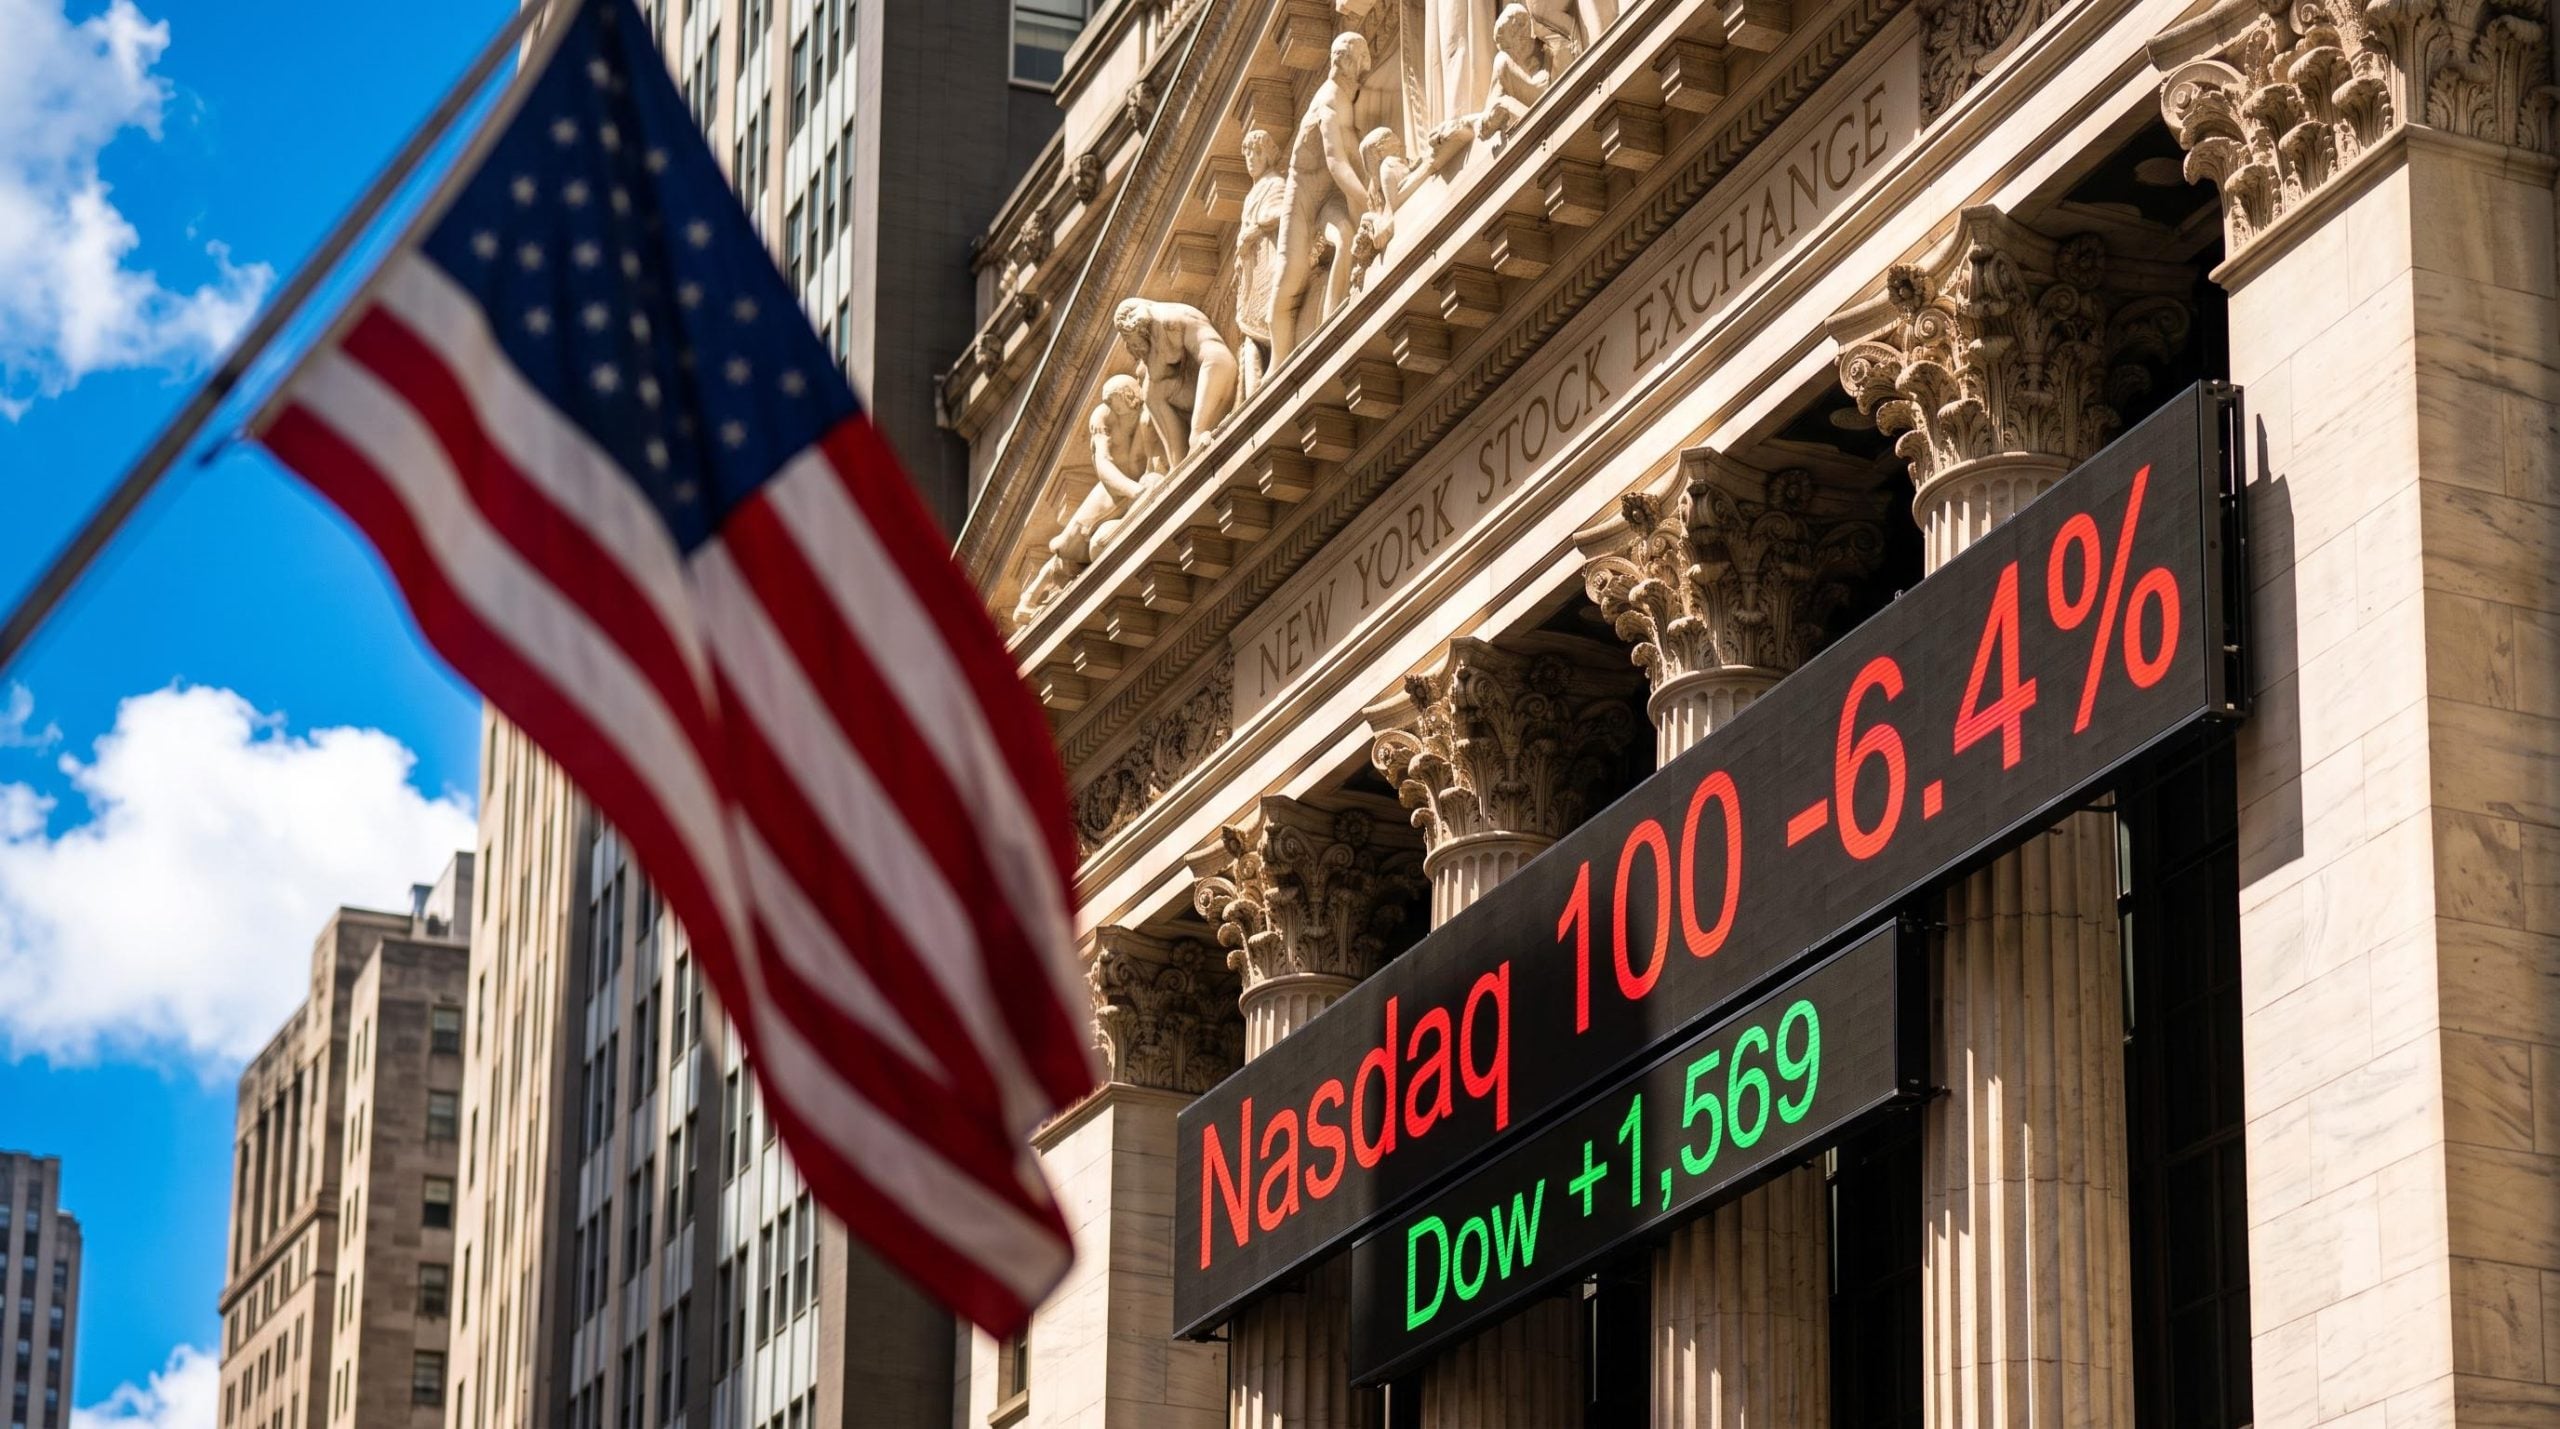
The Dow Jones Industrial Average jumped 1,569 points, about 3%, on 4 November. According to CFRA Research, that was its strongest post-midterm session since 1982. One day later, the Nasdaq 100 fell 6.4%, leaving it nearly 15% below its 6 October record.
The two moves point in opposite directions, and both came from the same election result.
The post-midterm market outlook now depends on which signal investors trust. One market commentator, presenting on Marcus Today, argues the setup is constructive for equities. The thesis rests on four supports: a weaker presidential agenda, falling oil, peaking bond yields and a softer US dollar.
The argument is tidy, and parts of it hold up. Other parts run into US inflation data and an AI financing bill that keeps growing.
Here is what the evidence supports, where US data cut against the bullish case, and which signals will settle the argument over the coming weeks.
Does a weaker presidential agenda really lower political risk?
The commentator’s case starts with the scoreboard. Democrats won both the House and the Senate. On this view, the two riskiest market factors of the past two years, tariffs and Middle East escalation, now lack congressional backing.
The commentator adds that the president’s response to the result has been notably subdued, and suggests markets may start ignoring a lame duck’s posts. The S&P 500 rose roughly 1.5% to 1.6% on 4 November, which suggests investors bought at least part of that story.
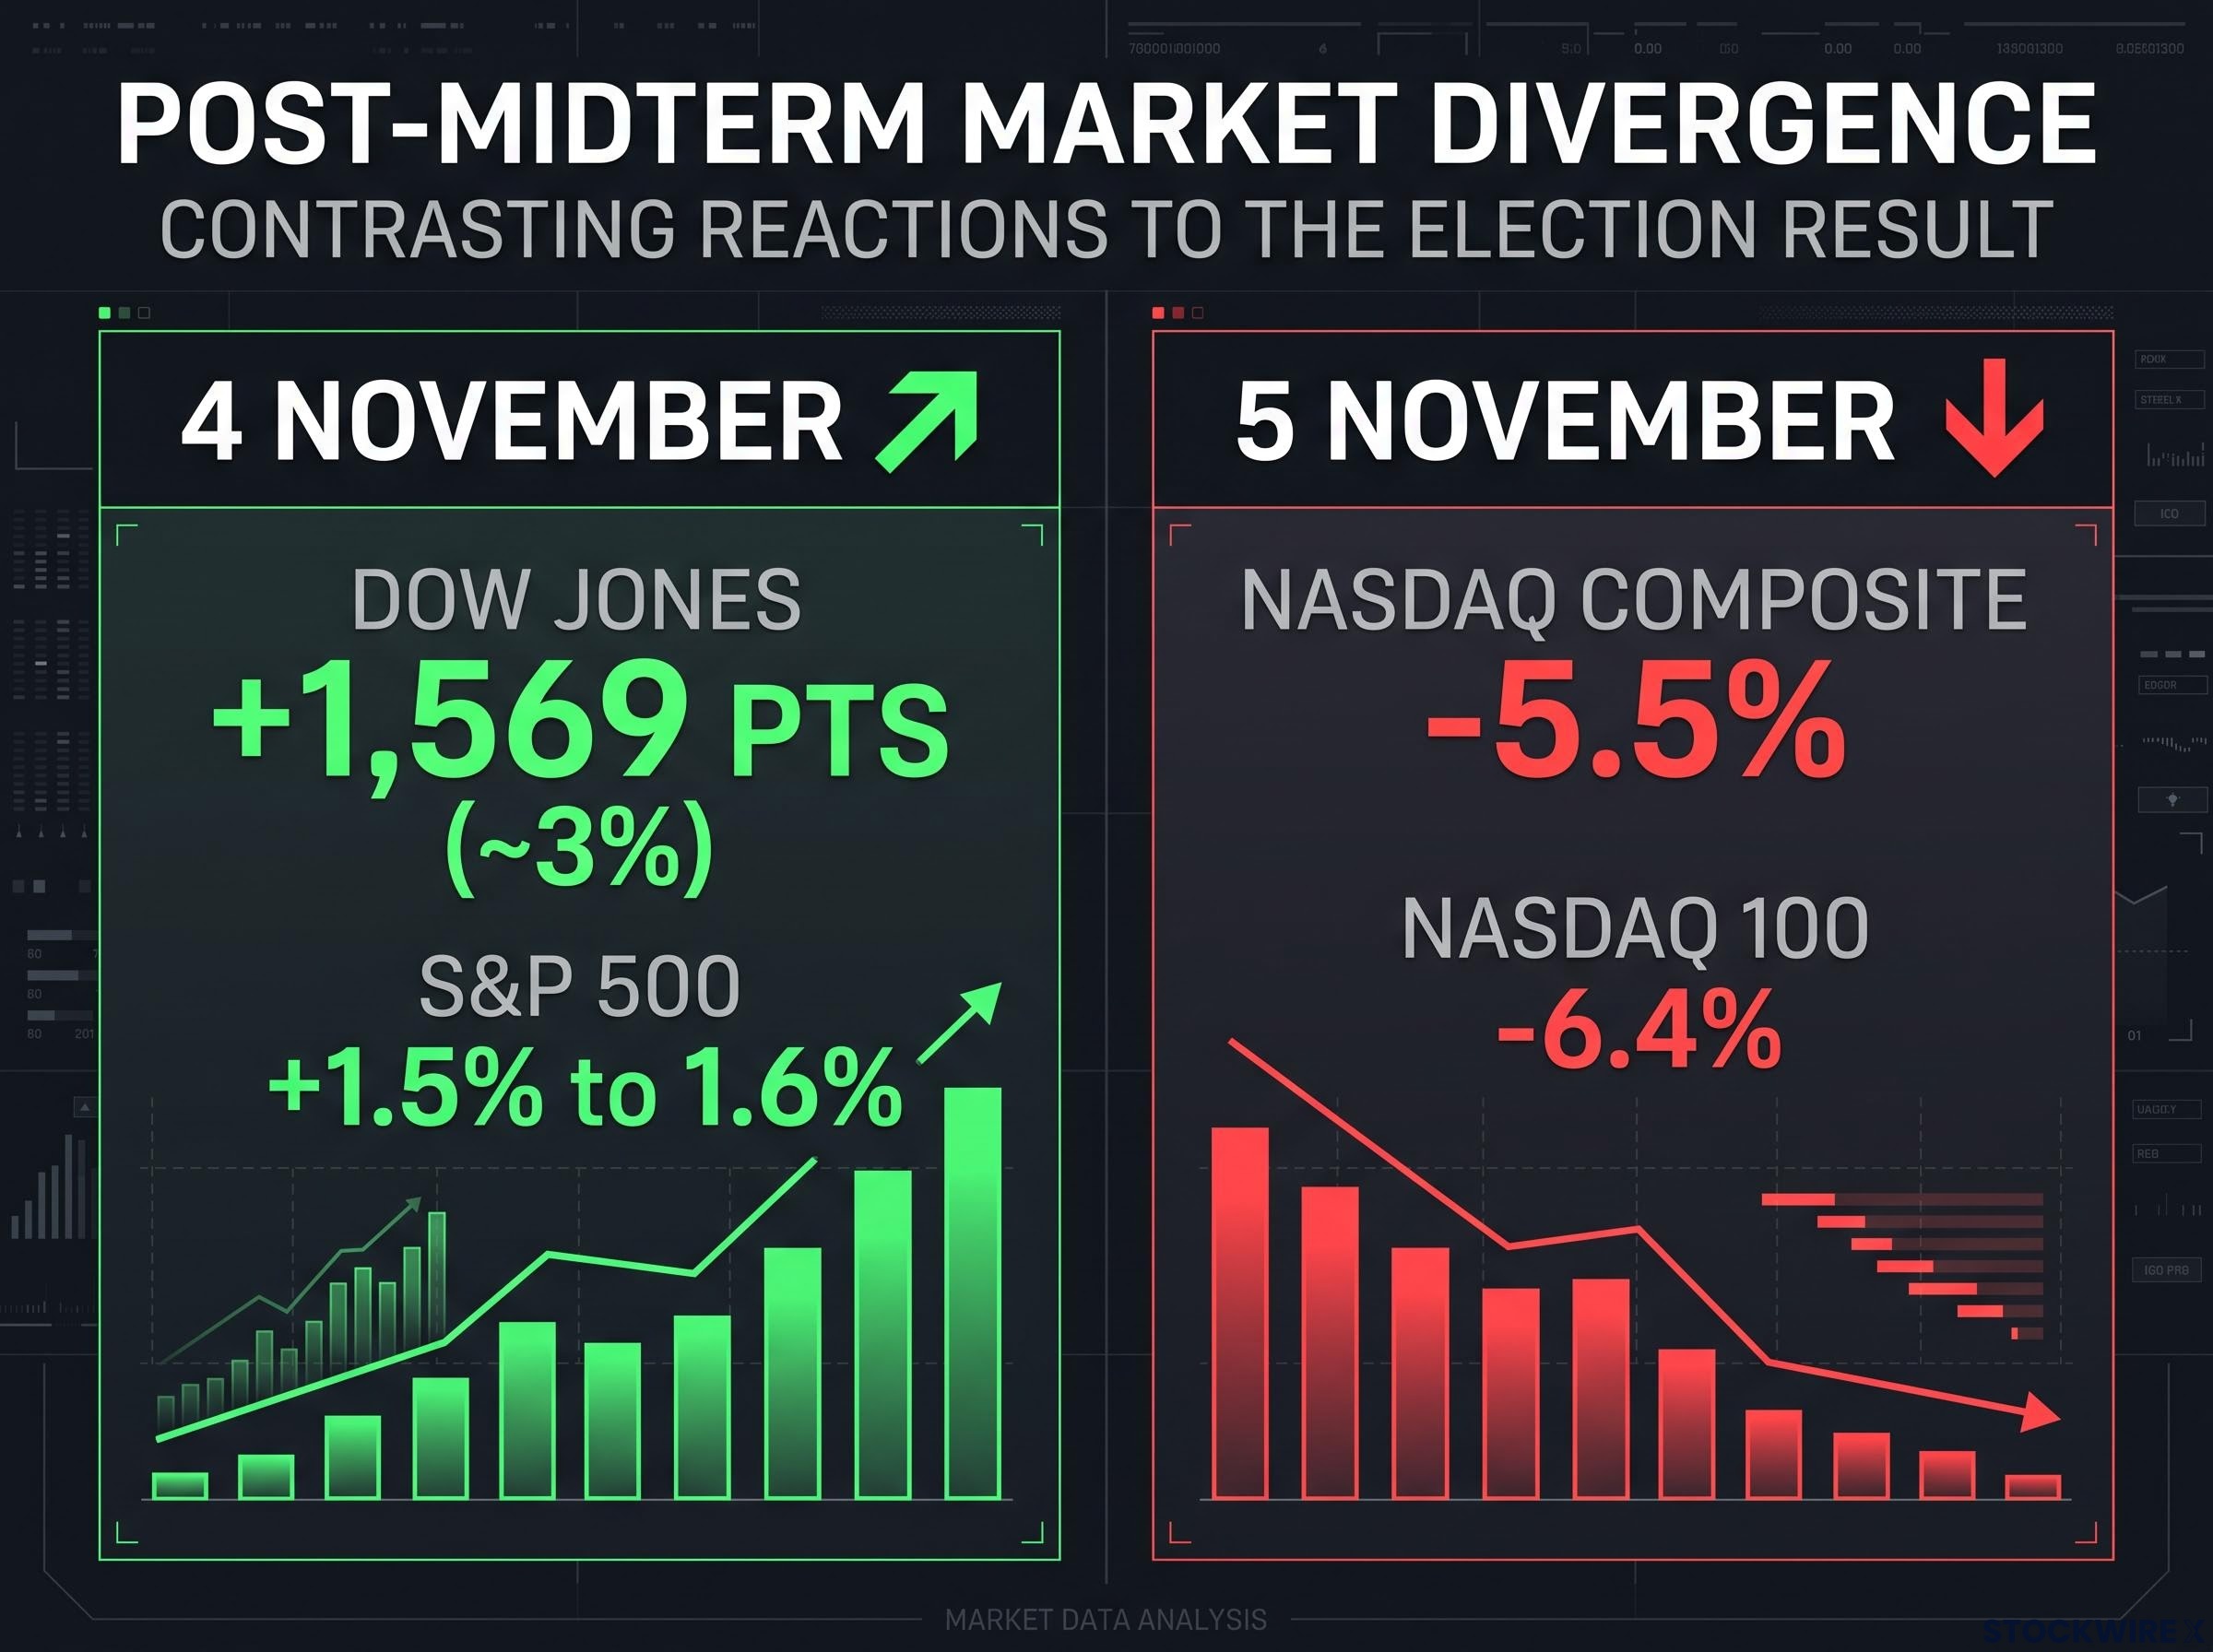
Contrasting market reactions saw the Dow Jones jump +1,569 points (~3%) on 4 November, while the Nasdaq 100 fell -6.4% on 5 November.
Analysis from JPMorgan and Fidelity points to a narrower conclusion.
What Congress can constrain
- New fiscal stimulus, which JPMorgan Asset Management sees as unlikely for roughly two years
- Large new spending programmes and the deficit growth that comes with them
- The upward pressure on yields that bigger deficits usually bring
What the president still controls
- Tariffs set through executive action
- Foreign policy, including the US posture towards Iran
- Existing regulations, according to Fidelity
The effective tariff rate has already fallen to about 10.6%, down from roughly 30% after “Liberation Day”, according to JPMorgan. Congress cannot remove tariffs on its own. JPMorgan’s David Kelly describes tariff reduction as a potential area of bipartisan cooperation, which is a possibility rather than a certainty.
The commentator also concedes that a cornered president might lash out in the short term.
The midterm track record According to JPMorgan, the S&P 500 has been higher 12 months after every midterm election since 1950, with an average gain of about 15%.
That history is encouraging, but it describes an average, not a rule that applies every time. For your purposes, reduced political risk means lower odds of new shocks coming from Congress. Executive-branch surprises on tariffs or foreign policy have not gone away.
Studies of midterm election market reactions suggest the macro backdrop of inflation, growth and Treasury yields tends to outweigh the House margin, which is why policy changes reach portfolios slowly and mainly through earnings.
When big ASX news breaks, our subscribers know first
Can falling oil and peaking yields hold up against hot US inflation data?
The second part of the thesis is a chain of cause and effect. In the commentator’s version, it runs like this:
- Lower oil cuts headline inflation, because energy feeds directly into consumer prices and into transport and production costs.
- Lower inflation reduces expected policy rates, provided the oil drop does not reflect a sharp slowdown in growth.
- Lower rate expectations pull bond yields down, which reduces the discount rate applied to future profits. The discount rate is the rate used to convert profits expected in the future into a value today.
- Long-duration stocks gain the most. These are companies, such as AI and technology names, whose value depends on profits expected years from now.
- Hyperscaler borrowing gets cheaper. Hyperscalers are the largest cloud and data-centre operators, and lower Treasury yields and narrower credit spreads reduce their cost of debt.
The first link is clearly in motion. Brent crude fell about 16% in the week to 6 November, its steepest weekly fall since COVID-19 hit, according to Reuters. Both benchmarks dropped more than 8% on 4 November alone. By 10 November, Brent stood at $91.69 and West Texas Intermediate (WTI) at $86.19.
Reuters attributed the slide to lower odds of renewed US-Israeli escalation against Iran and to signs of excess supply. Continuing tanker attacks and uncertainty over the Strait of Hormuz have kept prices from falling further.
The chain starts to weaken at the third link. In Australia, the Reserve Bank of Australia (RBA) raised rates on a 6-to-3 vote, and strategists surveyed now see the cash rate peaking at 4.85%. US pricing has moved the other way. Hotter inflation data and comments from Governor Christopher Waller cut the probability of no December hike to 3% from 16%, according to Economies.com on 10 November.
Reuters reported on 11 November that markets were fully pricing at least a 25 basis point increase. A basis point is one-hundredth of a percentage point. The effective federal funds rate sits at 3.88%, according to the Fed’s H.15 release.
Fed hike expectations have been building for months, partly because rate increases are a demand-side tool being applied to a supply-side oil shock, and PCE inflation has run above target for 65 consecutive months.
| Signal | Commentator’s reading | US data reading |
|---|---|---|
| Oil | Falling as Middle East tension eases | Brent down about 16% in a week; tanker risk remains |
| Yields | Near their peak | Not confirmed; pushed up by hot inflation data |
| Rate expectations | Tightening near its end | At least 25 bp December hike fully priced |
| Dollar | Weakening, supporting hard assets | Recovered in the near term as yields rose |
The dollar shows the same tension. The commentator expects a weaker dollar and a rotation into hard assets such as commodities. In the near term, however, the dollar has firmed alongside yields. Kelly still sees lower energy prices, inflation and a lower dollar as the longer-term effects of the election.
Treat “peak yields” as a hypothesis the US market has not yet confirmed. The rate-sensitive part of the equity case depends on the next round of inflation data.
Is peak cash the signal to shift into stocks?
A deposit rate above 4% feels like a safe place to wait. As of 10 November, the best US high-yield savings account paid 4.35% annual percentage yield (APY), and the best money market accounts paid up to 4.05%, according to Bankrate. The national average for savings accounts was just 0.56%.
The catch is that these rates are variable. If central banks start cutting, banks lower deposit rates too. This is called reinvestment risk: the chance that money earning a high rate today will have to be reinvested at a lower rate later.
The commentator points to an Australian example, Macquarie’s 5.5% savings rate, as a possible peak for deposits. The commentator also draws a parallel with the global financial crisis (GFC). Bank rates then exceeded 7%, savers locked into term deposits, and equities began to rally soon afterwards.
The comparison is imperfect, because today’s economy looks very different from that of 2008 and 2009. The underlying point still holds: high cash rates can coincide with the start of an equity recovery.
| Factor | Cash | Equities |
|---|---|---|
| Yield certainty | High today, but variable | No fixed return |
| Reinvestment risk | Rises if rates fall | Lower; returns come from earnings |
| Liquidity | Immediate | High, but prices fluctuate |
| Upside | Limited to the interest rate | Exposure to earnings recovery |
A history worth weighing, with a caveat Morningstar has been reported as finding that, since 1990, US stocks averaged a three-year return of 38% after rate hikes, compared with 29% after cuts. This figure could not be independently confirmed.
If the Morningstar finding holds, the start of rate cuts is not automatically the best time to buy shares. In either case, historical patterns are averages, not guarantees.
Cash and equities can work as complements: cash provides liquidity and a known yield, while equities give you exposure to an earnings recovery. Ask yourself whether your cash holding is a deliberate liquidity choice or a wait for certainty, because rebounds often begin before the data looks reassuring. Moving money across gradually avoids the need to pick a perfect entry point.
What do lower yields mean for AI stocks after the Nasdaq pullback?
On 5 November, the Nasdaq Composite fell 5.5% and the Nasdaq 100 fell 6.4%, amid concerns about AI regulation and spending. The commentator sees the pullback as a possible entry point. The case for buying depends heavily on borrowing costs.
The financing squeeze
Long-duration growth stocks are the most sensitive to yields, and so is the debt that funds the AI build-out.
The scale of AI borrowing Amazon, Alphabet, Meta, Microsoft and Oracle have raised more than $370.7 billion in bonds in 2026, about one-fifth of US investment-grade issuance (Reuters, 6 November).
Since September alone, Alphabet has raised $25 billion, Meta $30 billion, Oracle $18 billion and Amazon $15 billion, nearly $90 billion combined. Credit spreads, the extra yield investors demand over government bonds, have also widened. Median spreads now sit at:
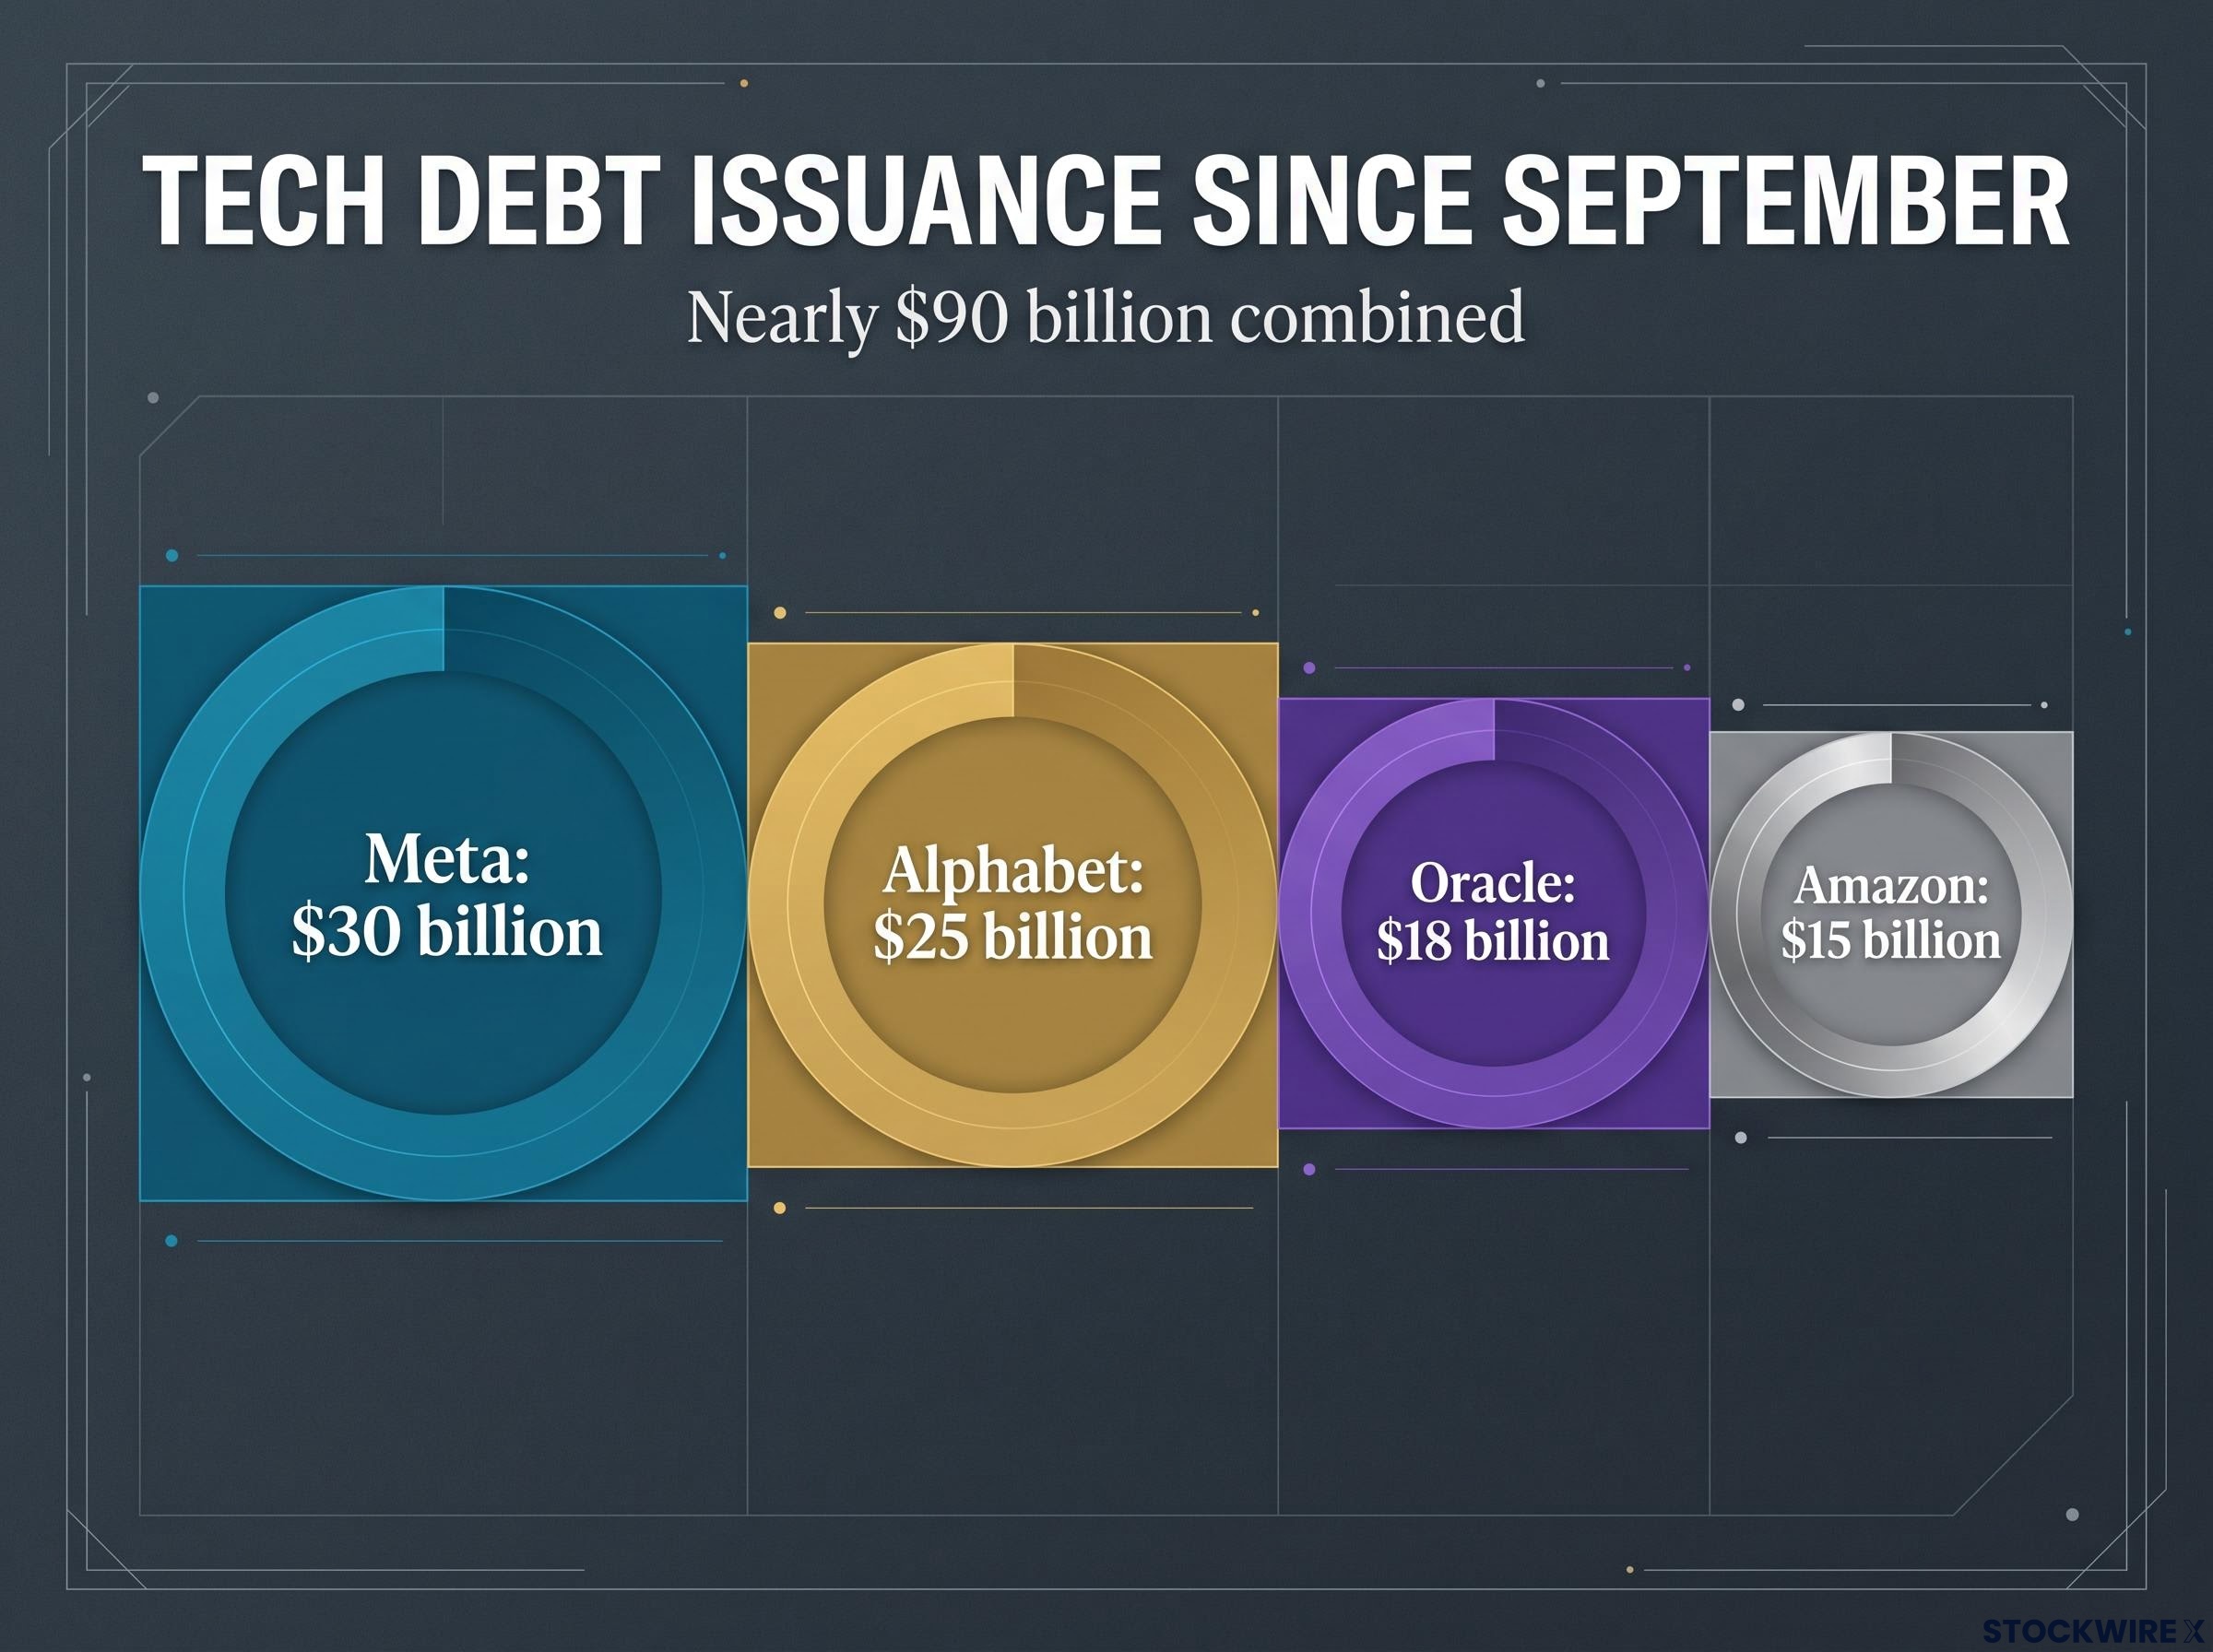
Since September, four major tech companies have raised nearly $90 billion combined, led by Meta with $30 billion and Alphabet with $25 billion.
- 40 bp on 2-4 year bonds, up from 30 bp
- 60 bp on 5-7 year bonds, up from 50 bp
- 118 bp on bonds of 20 years or longer, up from 108.5 bp
Wider spreads on this volume of debt add up quickly.
AI bond market risks extend beyond issuance volume: capex is running well ahead of revenue growth, and the Bank for International Settlements has flagged circular financing loops that may mask true end-user demand.
Buy-the-dip or value trap?
Analysts disagree on what the sell-off means:
- Constructive: Morgan Stanley’s Michael Wilson said the correction was in its “final innings”. LPL’s Adam Turnquist called the decline probably a knee-jerk reaction.
- Cautious: Bahnsen described valuations as “completely disconnected from reality”. Reuters reported that investors are questioning whether AI spending will turn into profits quickly enough.
The commentator expects the AI build-out to slow under a Democratic Congress but continue. A potential Anthropic IPO is seen as a minor positive.
JPMorgan Asset Management has warned that US indexes are heavily concentrated in technology and AI stocks. If your portfolio is index-heavy, you already hold significant AI exposure without picking a single stock. Lower yields would help that exposure, while a financing or regulation shock would hurt it.
A constructive setup with conditions: what to watch next
The medium-term case is credible, but it is conditional. The more defensible reading is a potentially attractive entry environment with unusually high short-term volatility, not a confirmed low-risk rally.
Four variables will confirm or break the thesis:
- US inflation prints and December Fed pricing, which will test whether yields have really peaked.
- Whether the Middle East calm holds, with tanker attacks and Hormuz access as the clearest signals.
- Executive-branch tariff moves, which Congress cannot block on its own.
- AI regulation, data-centre opposition and the reason behind oil’s fall: easing supply risk would support the thesis, while a growth shock would undermine it.
Given these conditions, the evidence suits gradual redeployment more than an all-in move.
This article is for informational purposes only and should not be considered financial advice. Investors should conduct their own research and consult with financial professionals before making investment decisions. Past performance does not guarantee future results. Financial projections are subject to market conditions and various risk factors.