Brent crude fell about 5% on Monday, 9 November 2026, yet no deal to end the US-Iran war was signed. The US Secretary of State even called some Iranian demands “outrageous and ridiculous”. So why would oil prices drop sharply on hope alone, and what does that mean for inflation?
The timing matters for you. US consumer price index (CPI) data, the main measure of inflation for American households, lands on Tuesday, 10 November. China’s factory-gate inflation has just hit its highest level in more than four years.
At the same time, the US Federal Reserve is debating whether to raise interest rates again. Oil sits in the middle of all three stories.
Here is how a diplomatic headline travels from the crude price to inflation, bond yields and central bank decisions. You will also see which signals are worth watching over the next few weeks.
Why did oil drop 5% on ceasefire hopes?
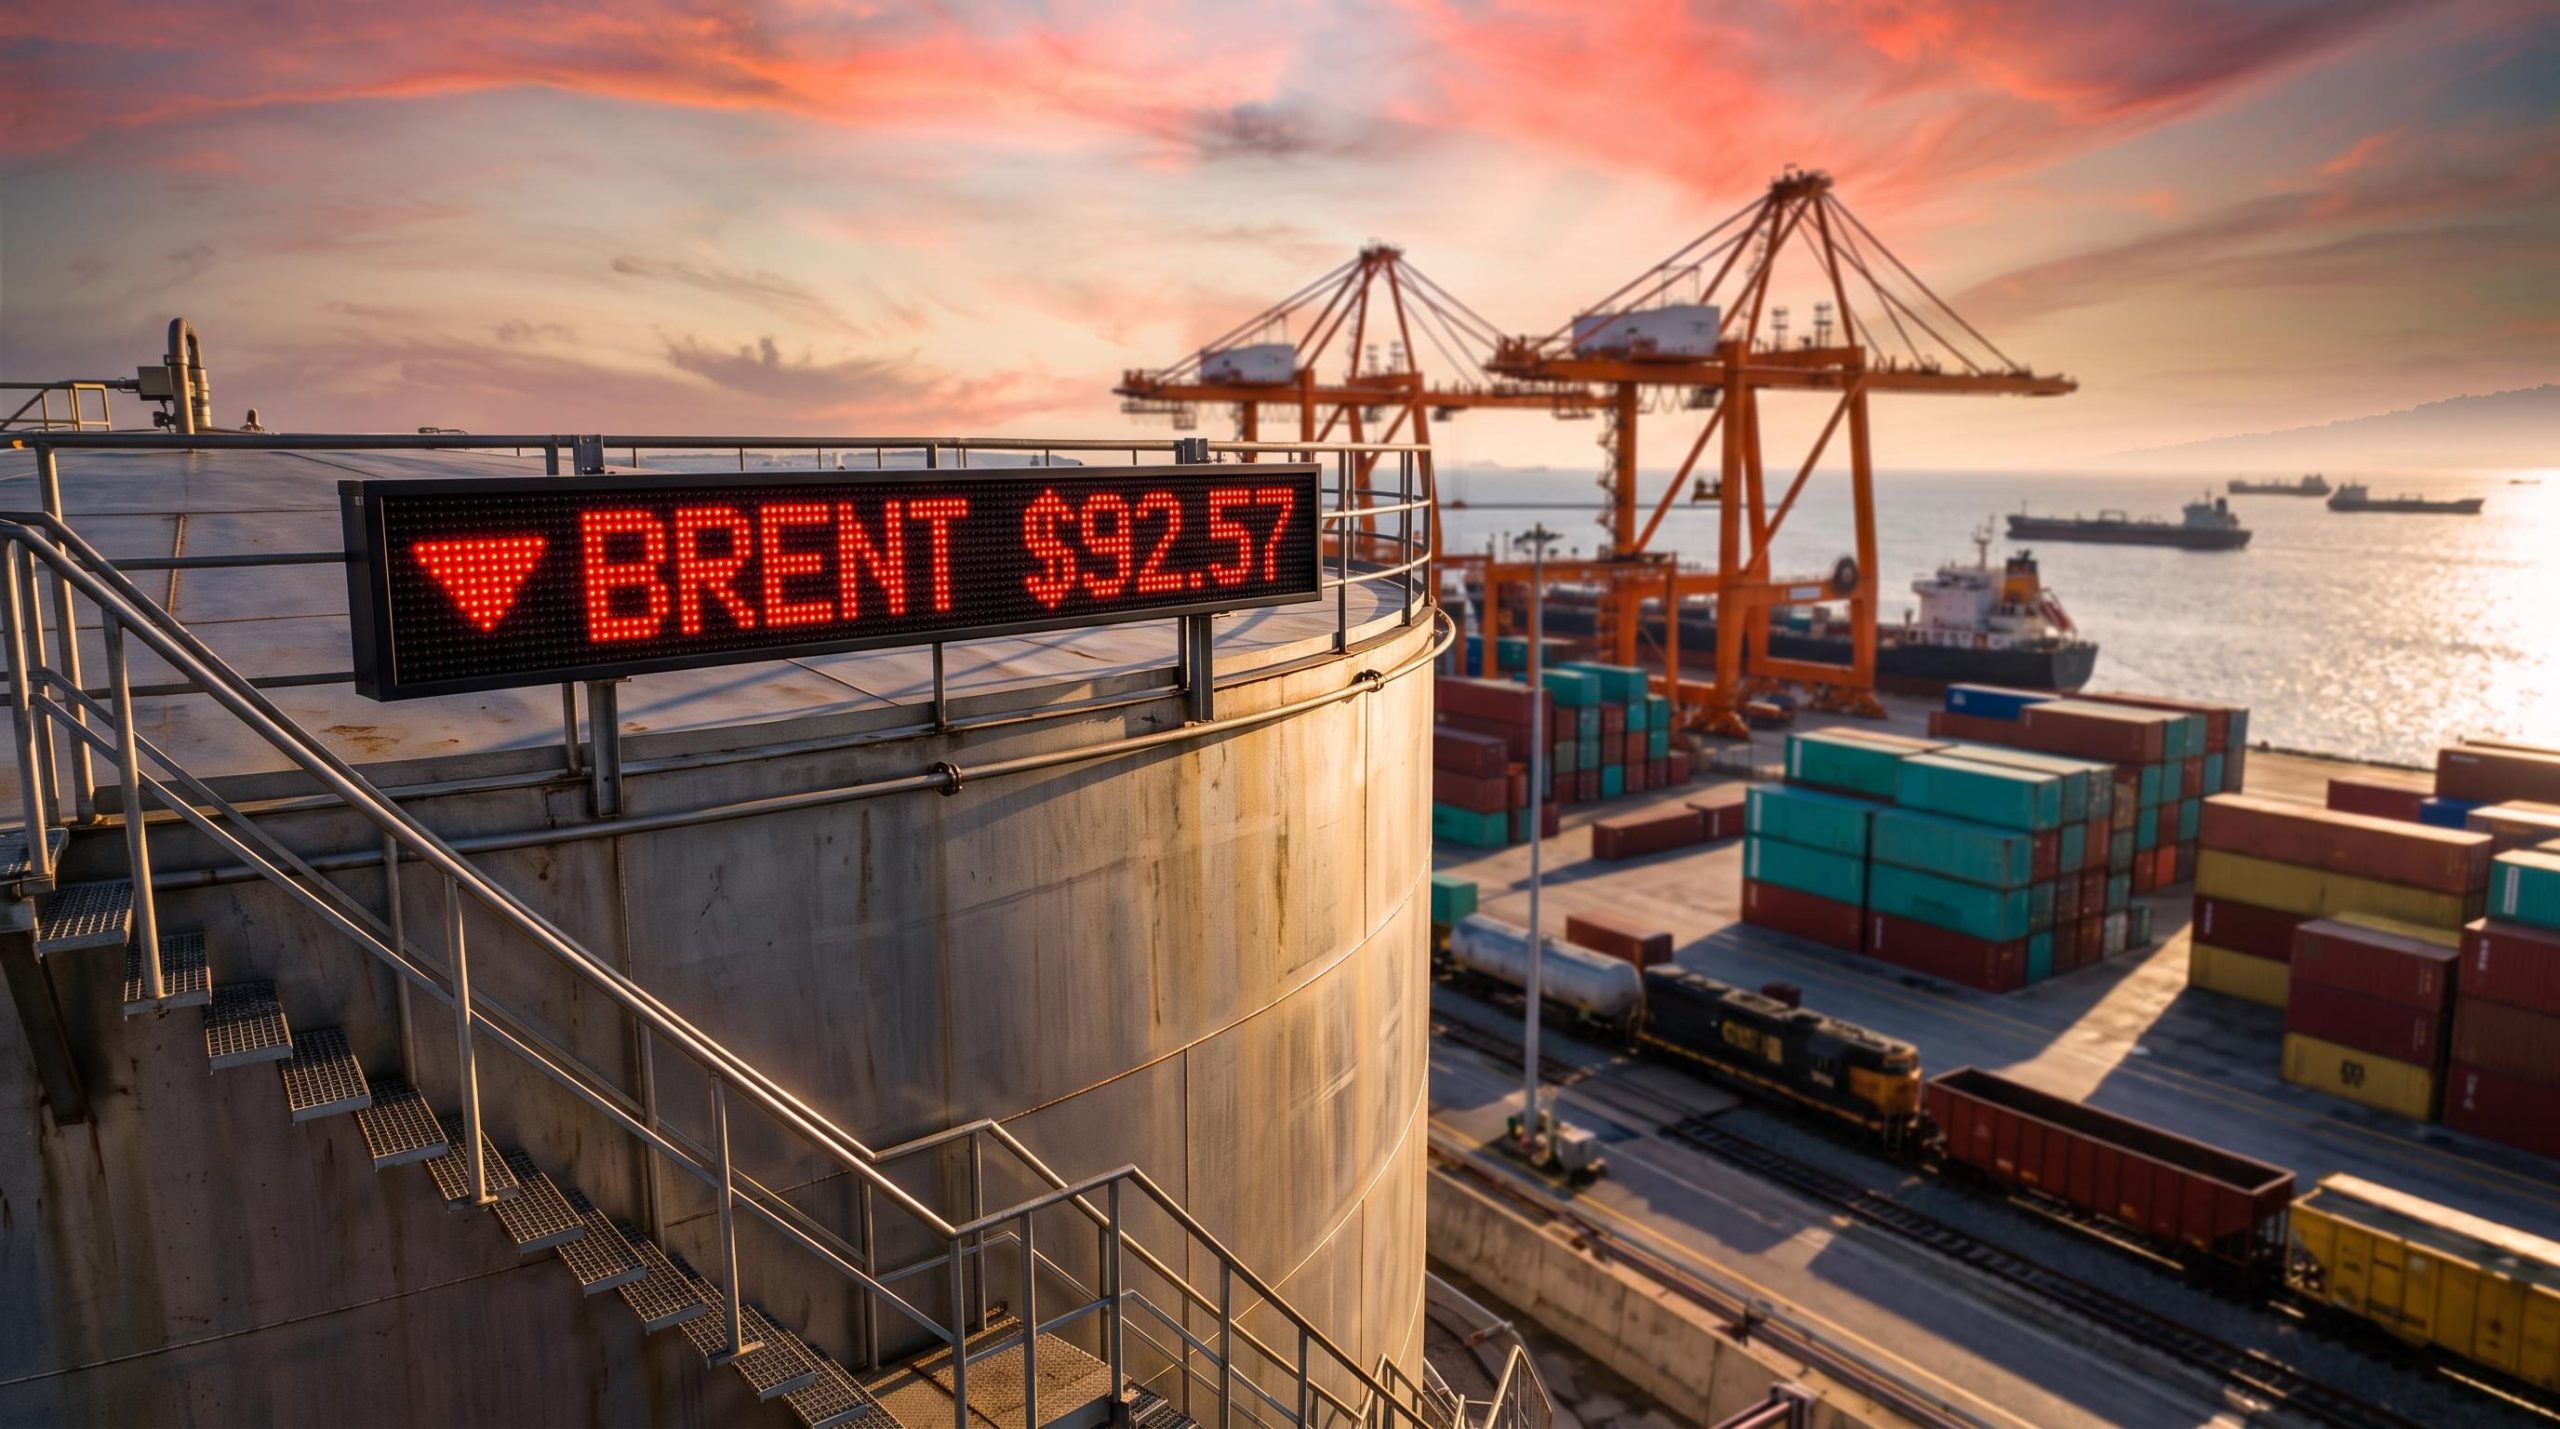
Start with the screen. According to Reuters, Brent settled at US$92.57 a barrel on 9 November, down US$5.75. West Texas Intermediate (WTI), the main US benchmark, settled at US$86.85.
| Benchmark | Settlement | Daily move |
|---|---|---|
| Brent crude | US$92.57 | Down US$5.75 (5.85%) |
| WTI crude | US$86.85 | Down US$3.98 (4.38%) |
Bloomberg’s intraday figures differed slightly, putting WTI at US$87.05, down 4.16%. The settlement is the cleaner number because it reflects where the day officially closed.
The trigger was diplomacy. President Trump hosted Qatar’s Prime Minister, Sheikh Mohammed bin Abdulrahman al-Thani, at the White House to discuss a new ceasefire and a return to nuclear talks. No agreement to end the war was announced.
That is the key point. Nothing physical changed on Monday.
What changed was the probability attached to bad outcomes. Since the war began, oil has carried a war risk premium, which is the extra amount buyers pay above normal supply-and-demand value to protect against disruption. A diplomatic thaw makes four things look less likely:
- Renewed strikes by the US or Israel
- Attacks on Gulf tankers
- Prolonged restriction of the Strait of Hormuz
- Further supply losses from sanctions or a blockade
Reports suggested the proposals involved reopening the strait and halting attacks on shipping. Neither Washington nor Tehran confirmed those terms. Secretary of State Marco Rubio also poured cold water on the talks.
Marco Rubio, US Secretary of State Rubio said he saw no imminent breakthrough and described some Iranian demands as “outrageous and ridiculous”.
So the drop tells you the market is pricing the odds of de-escalation, not a signed deal. That means the move can reverse as fast as the headlines do. One unconfirmed report suggests Brent jumped almost 3.9% on 5 November after tanker attacks, a reminder of how quickly the premium can return.
An earlier diplomatic pause in July produced a similar 5.5% one-session drop, and that sell-off also outpaced any real improvement in tanker traffic or inventories, so you should treat sentiment-led declines with caution.
What would keep the premium in place?
There are three competing readings. If diplomacy stalls, as Rubio’s comments suggest it could, the war premium may rebuild quickly.
If talks succeed and Iranian exports return, OPEC+ (the group of oil-producing nations led by Saudi Arabia and Russia) may need to manage those extra barrels, which could cap any rebound. A third view holds that high prices and tighter monetary policy could weaken global demand, pulling oil lower even while supply risks linger.
When big ASX news breaks, our subscribers know first
How do oil prices feed into inflation and bond yields?
A falling oil price matters to you because it doesn’t stop at the pump. It moves through the economy in stages, and each stage reaches a different part of your portfolio.
Here is the chain, link by link:
- Oil price: crude rises or falls on supply risk.
- Input costs: fuel, transport, chemicals, plastics and fertiliser get dearer or cheaper.
- Headline CPI: petrol, diesel and heating costs show up in consumer inflation.
- Expectations: households and firms decide whether higher prices will last.
- Policy rate: the central bank responds if expectations shift.
- Bond yields: the interest rate on government debt adjusts to the expected policy path.
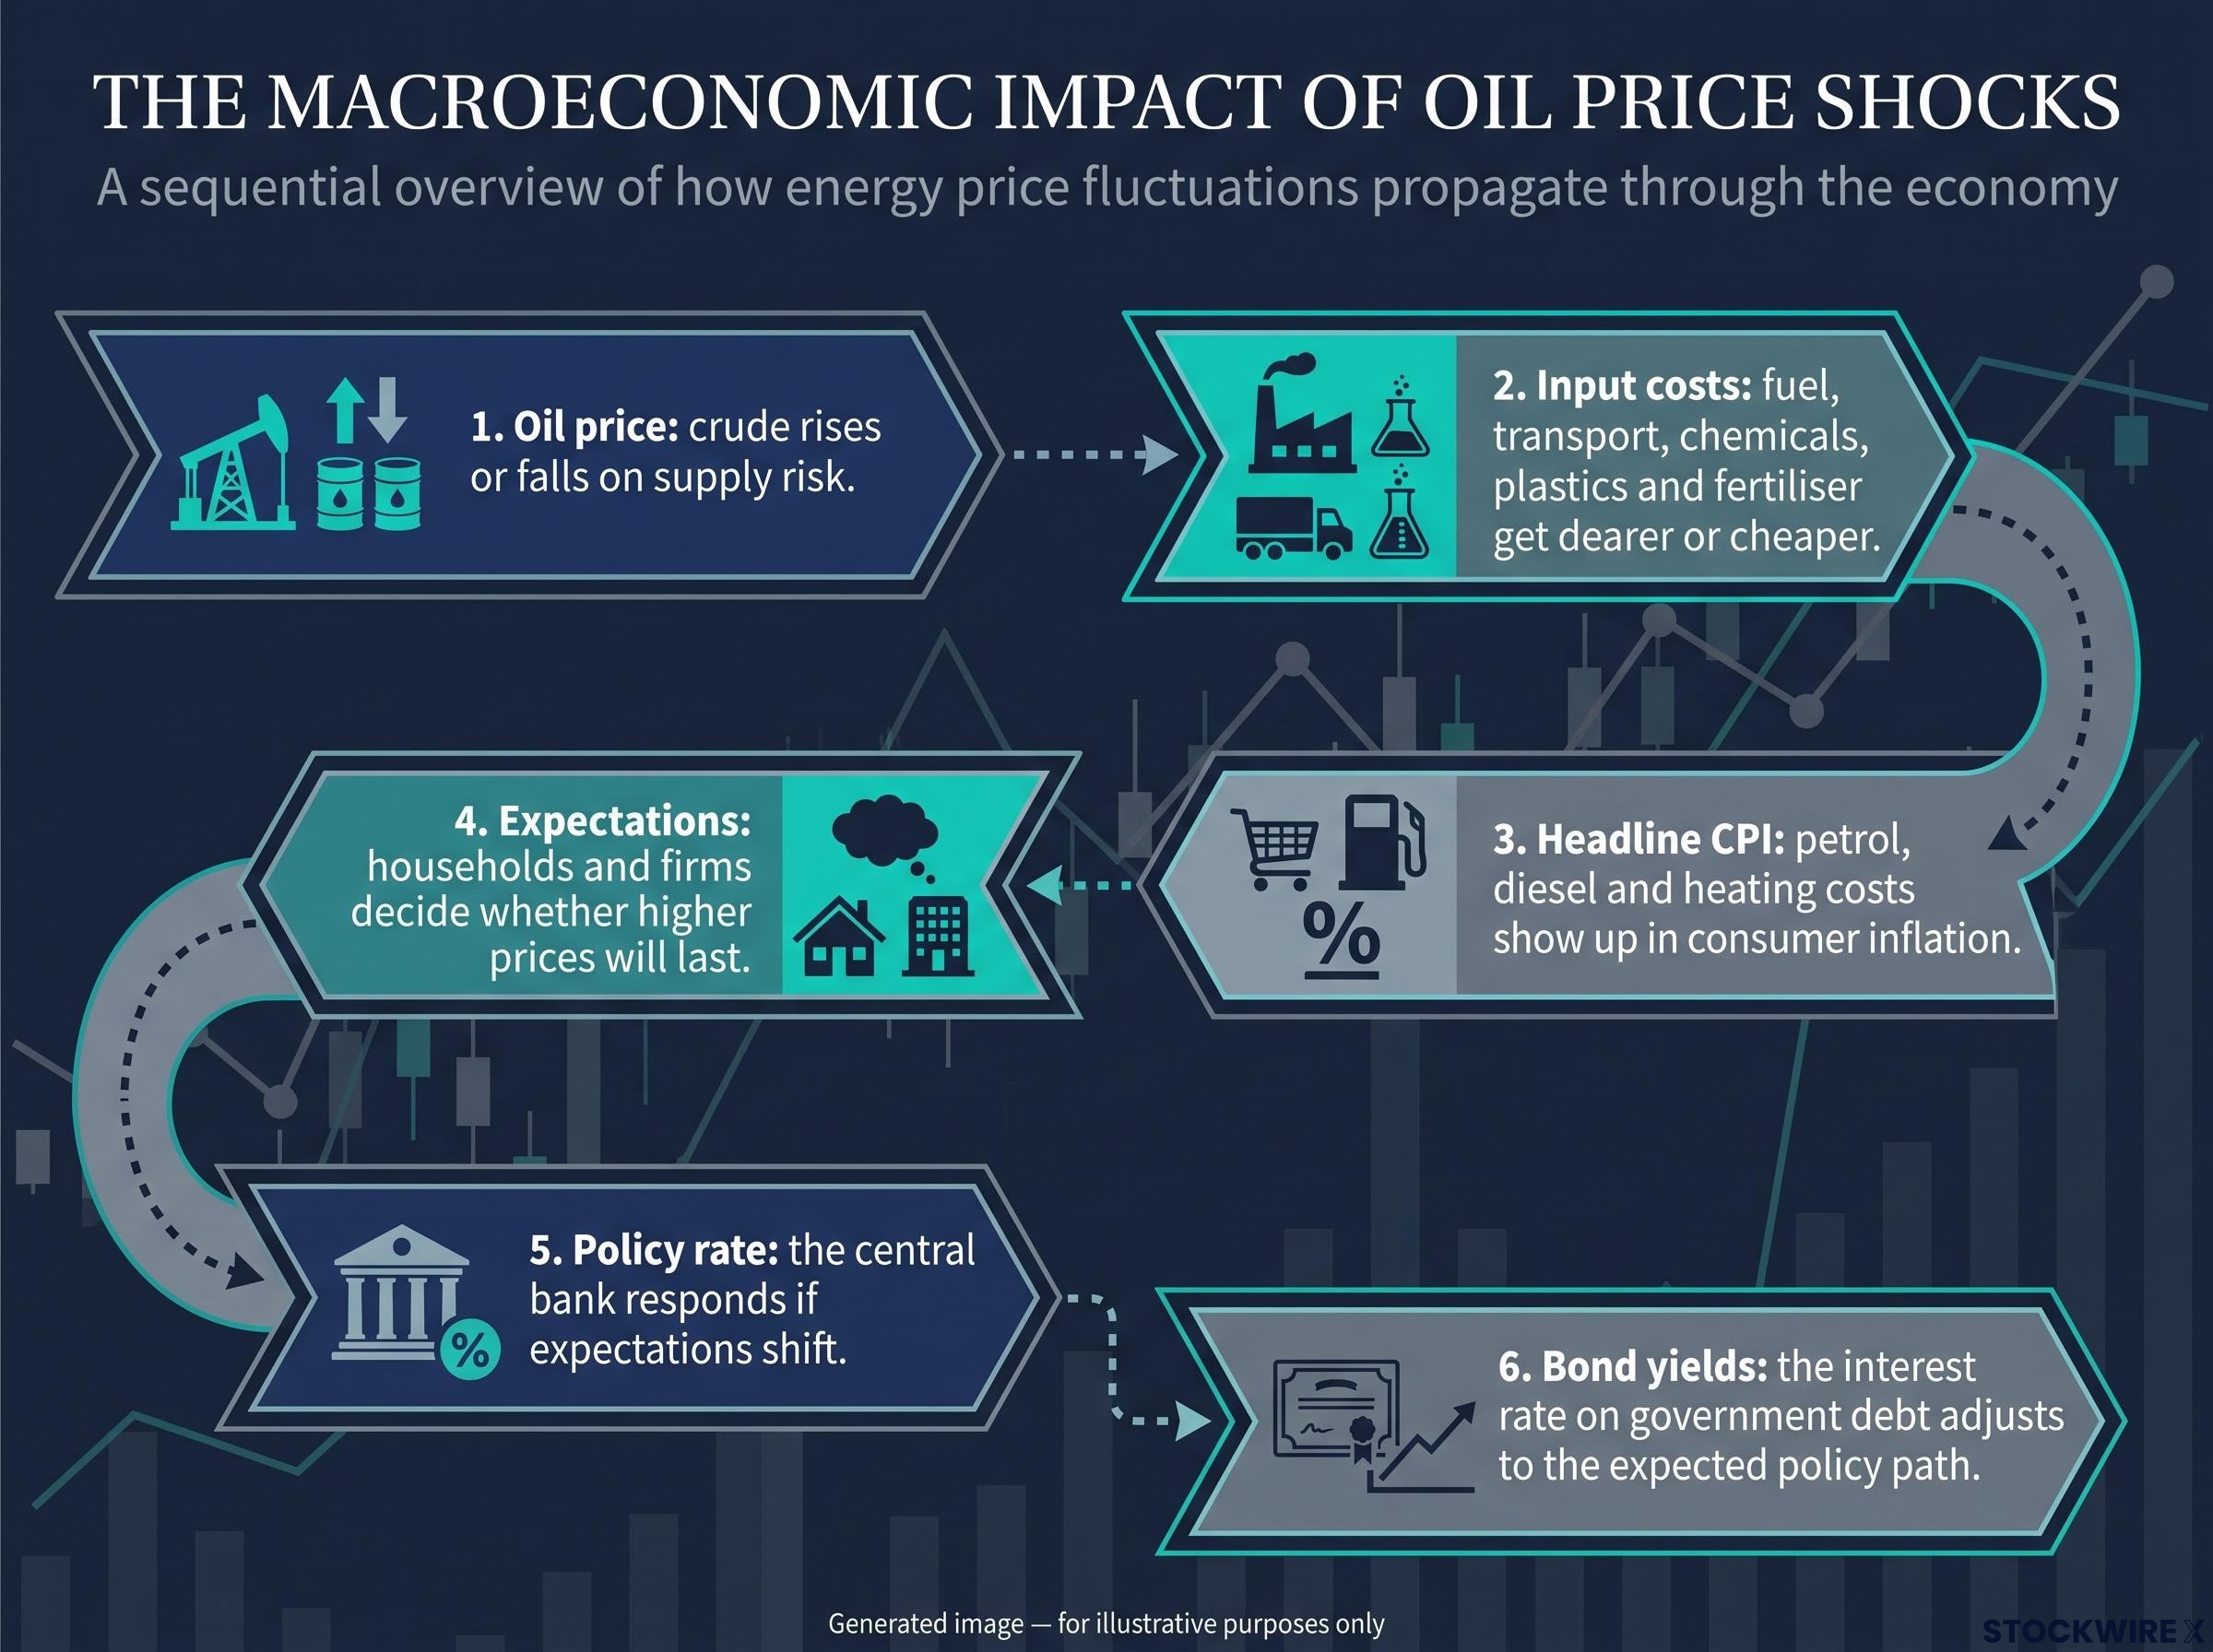
The macroeconomic transmission chain involves 6 steps linking crude oil prices to bond yields.
The fourth link is where things get decided. Research from the US Energy Information Administration (EIA) indicates a one-time oil shock usually produces a headline “blip” with limited lasting effect if expectations stay anchored.
The Kansas City Fed has reportedly found the opposite risk. Since 2010, according to its work, oil shocks have produced more persistent rises in household inflation expectations, which settled only after policy tightened.
How long a spike lasts depends on supply buffers. OPEC+ spare capacity, meaning output that can be switched on quickly, and stored inventories determine how much of a price jump sticks.
The indirect transmission channel, where energy costs move through logistics, agriculture and manufacturing, runs on a lag of 6-12 months, so you may not see its full effect in CPI even after crude has fallen back.
Bond yields respond in two layers. Short-dated yields follow what investors expect the central bank to do next, while longer-dated yields also price inflation risk and the chance that tighter policy slows growth.
History shows the outcome is not automatic. EIA research links the 1970s oil shocks to severe US recessions but cautions the relationship is not mechanical, and the Fed’s account of the 2021-22 shock highlighted near-term expectations rising to unusually high levels.
Why headline and core inflation diverge
Headline inflation includes everything, including volatile food and energy. Core inflation strips those out to show underlying price pressure.
Oil hits headline first and hardest. Services inflation, such as wages, rents and repairs, moves slowly and tends to stick once it rises.
So when you see oil move, ask one question: is it changing expected inflation, or only today’s price level? Only the first changes what central banks do.
What do China’s producer prices and US CPI expectations show?
The same energy shock is now appearing in the data, just at different points along the chain. China shows it at the factory gate first.
| Measure (October 2026) | Result | Comparison |
|---|---|---|
| PPI, year on year | +5.7% | Up from +5.0% in September; above +5.3% consensus |
| CPI, year on year | +0.7% | Down from +0.9%; below +0.8% consensus |
| Core CPI | +0.8% | Not available |
The producer price index (PPI) tracks what factories receive for their goods. According to the National Bureau of Statistics, October’s reading was the fastest since June 2022, linked partly to elevated global oil prices.
Consumer inflation went the other way. Weak domestic demand kept CPI subdued, which is why analysts read the data as external cost pressure rather than a Chinese demand boom.
That raises a pass-through question for you. If factory-gate inflation stays high, Chinese exporters may push costs into global goods prices; if demand stays weak, they may absorb them in thinner margins instead.
The US is the next stop. Bloomberg consensus, as reported on 9 November, expects headline CPI to rise 0.3% month on month and core CPI 0.2%. A reading above consensus would strengthen the case for higher rates, while a softer one would ease it.
But a soft number may not settle much. Chicago Fed President Austan Goolsbee said on 9 November that inflation is broadening into services less directly tied to tariffs and oil, and pointed to demand for electricians and data-centre construction.
Austan Goolsbee, President, Federal Reserve Bank of Chicago Goolsbee said the AI data-centre build-out increasingly looks like “old-fashioned demand overheating”.
A falling oil price will not clear inflation on its own if services and labour costs are climbing. A soft headline print tomorrow may not mean the Fed is done.
How do the Fed and the 11 December shutdown deadline raise the stakes?
The Fed now faces two pressures at once, and neither points cleanly in one direction. These are the dates to mark:
- 10 November 2026: US October CPI release
- 9 December 2026: Fed interest rate decision
- 11 December 2026: federal funding deadline
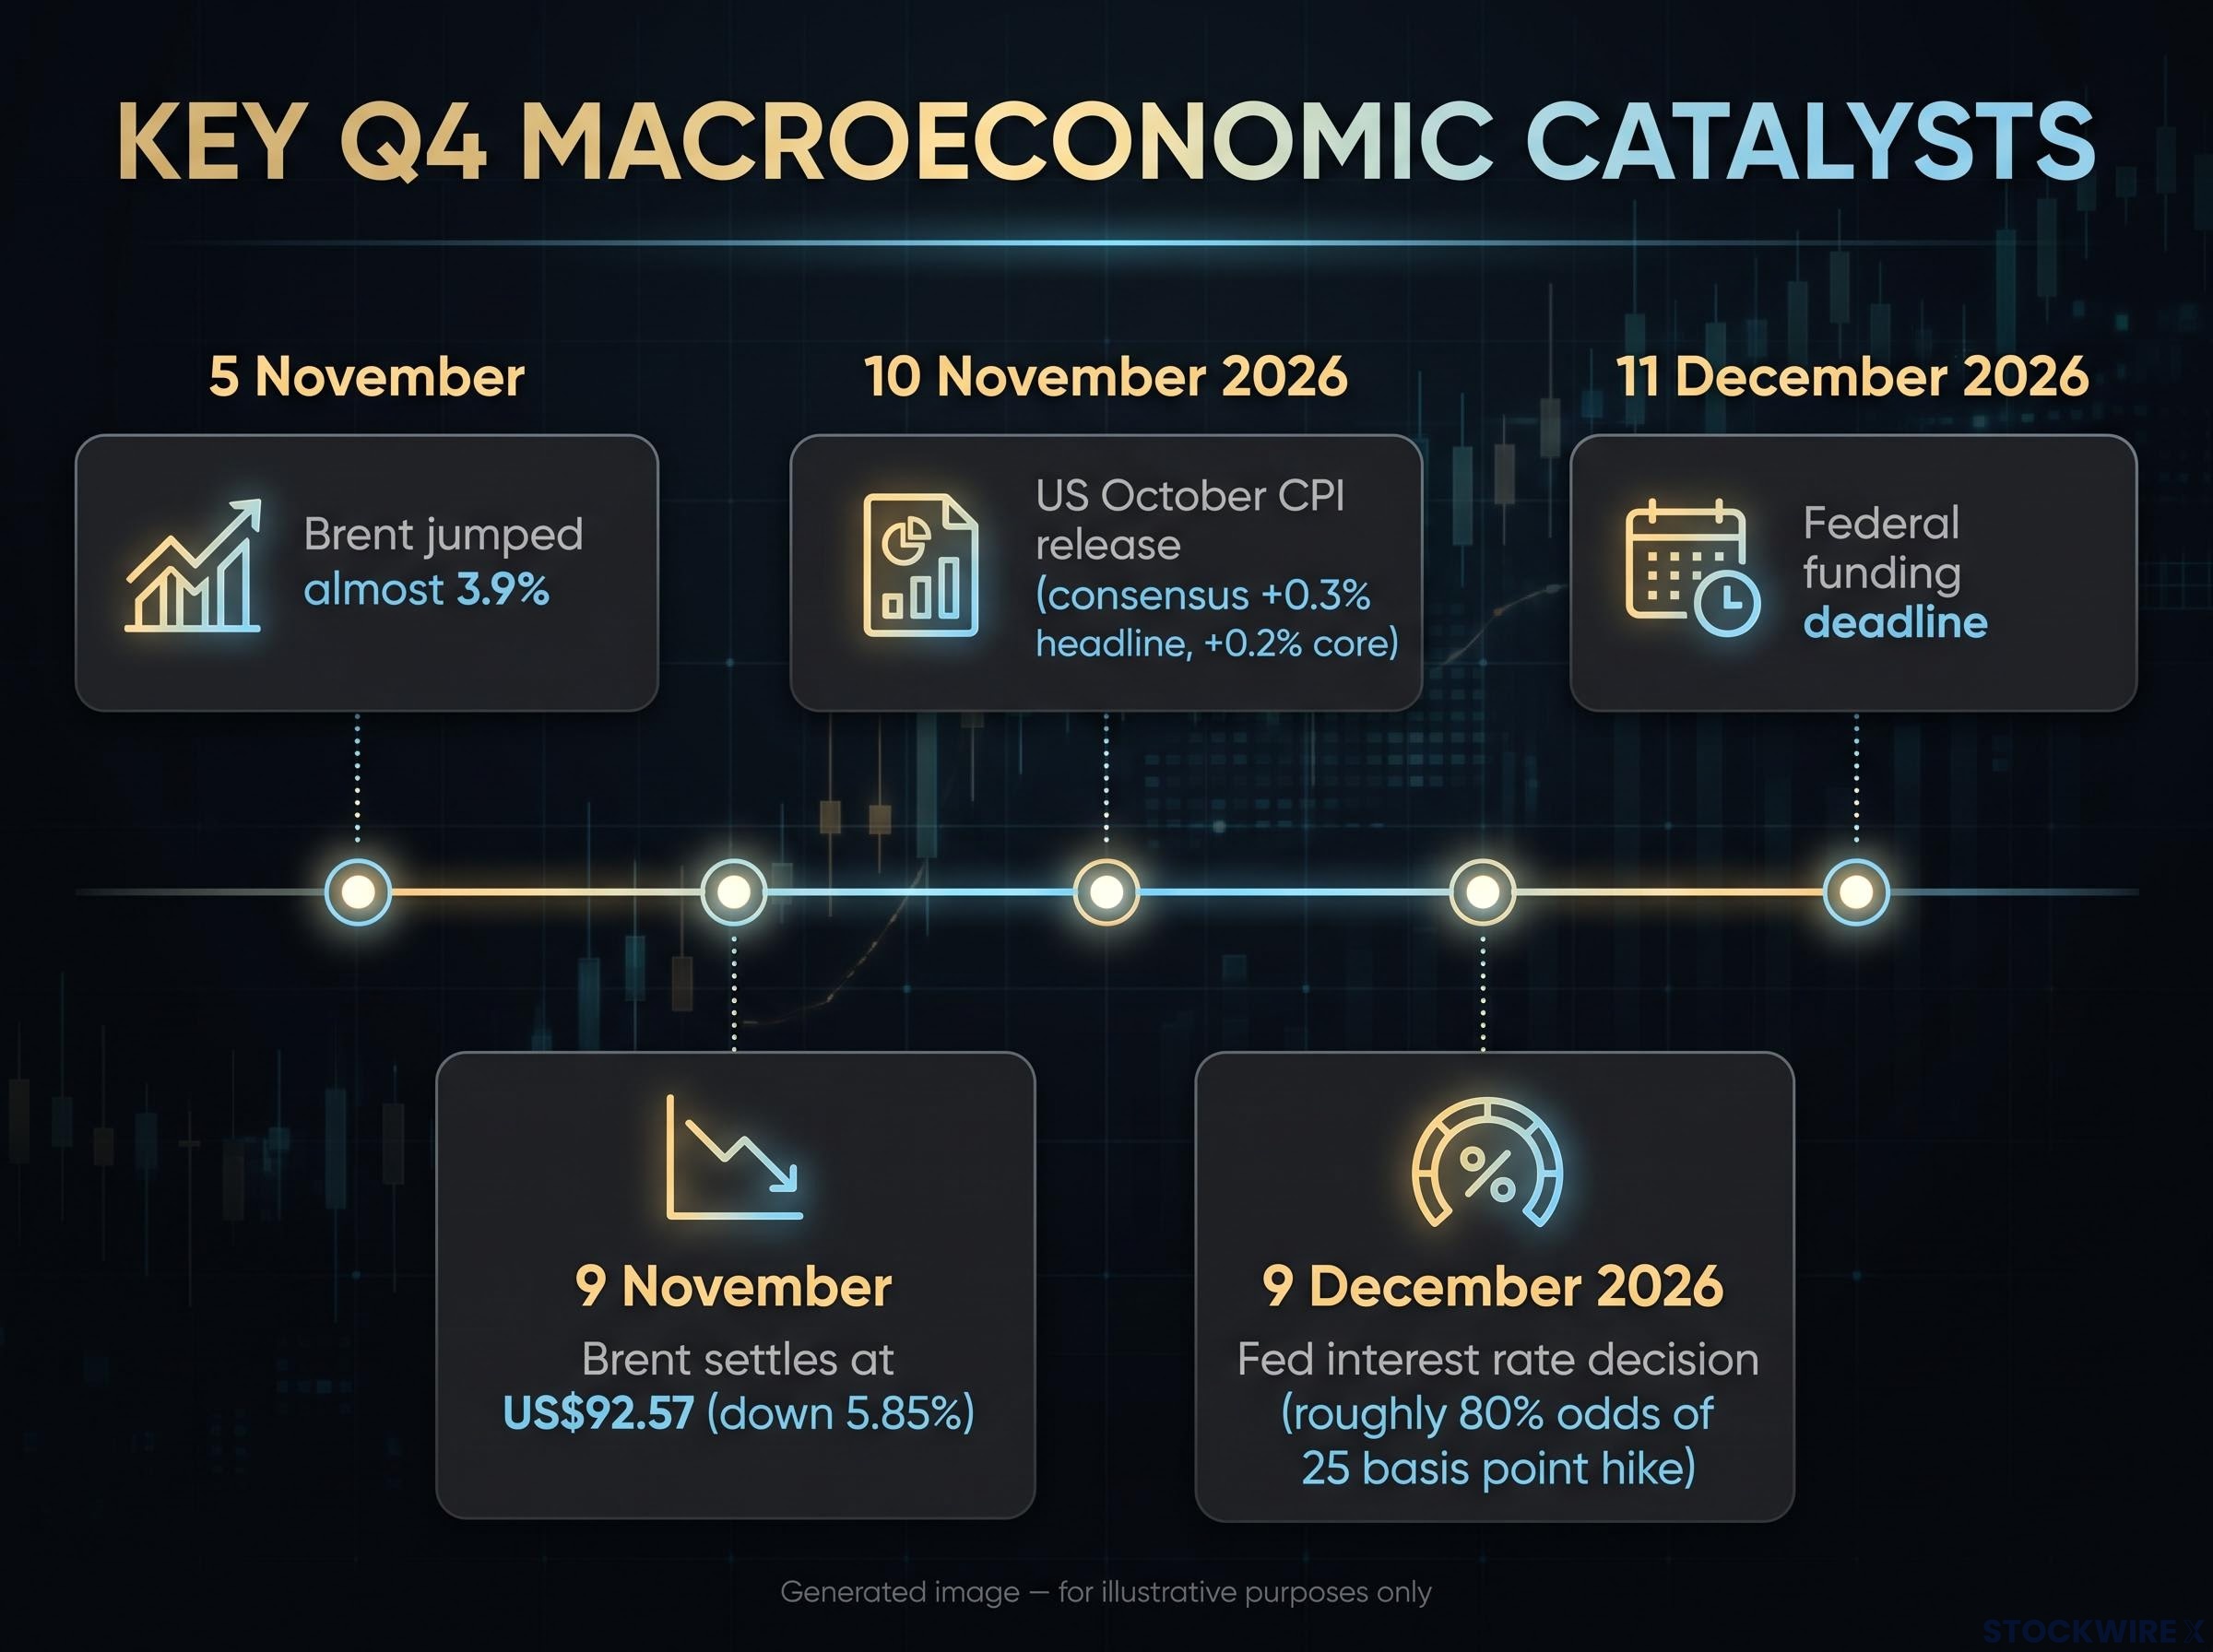
Key catalysts include Brent settling at US$92.57 on 9 November, and a roughly 80% odds of a 25 basis point hike on 9 December 2026.
Goolsbee’s comments lean hawkish, meaning in favour of tighter policy. He suggested demand-driven overheating can require an aggressive central bank response.
Richmond Fed President Tom Barkin reportedly takes a more cautious line, acknowledging stubborn inflation while favouring care over the pace of further rises. Bloomberg Economics, via BBH, reportedly puts the odds of a 25 basis point hike on 9 December at roughly 80%. A basis point is one-hundredth of a percentage point.
These probabilities are speculative and subject to change based on market developments and incoming data.
Washington adds a political layer. Federal funding expires on 11 December unless Congress acts, and Democrats are weighing whether to use that deadline to oppose war funding or press Trump to end the war.
That could trigger a fourth shutdown of Trump’s second term. After the midterms, Bloomberg’s Shawn Donnan says US populism is turning against tariffs, with Democrats focused on the cost of living.
Tariffs matter here because tariffs combined with energy costs could create a more lasting inflation impulse than oil alone.
The policy dilemma in plain terms
The Fed has to tell a temporary shock from a lasting one. If it tightens against a short-lived oil spike, it risks needless damage to jobs and growth.
If it waits and expectations take hold, inflation could become embedded in wages and services. Guessing wrong is costly either way.
With diplomacy, CPI, the Fed meeting and the shutdown deadline all landing within weeks, you should expect volatility in oil and yields to come from several overlapping catalysts rather than one.
What to watch as oil, diplomacy and inflation collide
The chain is now clear. Diplomacy shifts the war premium, oil feeds headline inflation and expectations, and those expectations drive the Fed and bond yields.
Keep these signals on your radar:
- Confirmation or denial of any Qatar-brokered terms
- Shipping status through the Strait of Hormuz
- US CPI against the 0.3% and 0.2% consensus
- Services inflation, the part oil does not touch
- The outcome of the 11 December funding deadline
Cheaper oil helps headline inflation. It does not settle the broader inflation story, and that is where the rate outlook will be decided.
This article is for informational purposes only and should not be considered financial advice. Investors should conduct their own research and consult with financial professionals before making investment decisions.