On 6 November 2024, the Cboe Volatility Index (VIX), Wall Street’s main gauge of expected stock market swings, fell 4.22 points to 16.27 in a single session. Stocks closed at record highs. It looked as though the market had reached a verdict on the economy overnight.
Nothing about the economy had changed between Tuesday night and Wednesday afternoon. Inflation, rates, earnings and jobs were all where they had been the day before.
What changed was the calendar. Options prices carry a premium for uncertainty tied to a known date, and once the result lands, that premium has no reason to exist. Its disappearance can set off a chain of mechanical buying that looks like conviction but is often just positioning unwinding.
That distinction matters for how you read the first move after any scheduled risk event. Here is how implied volatility deflates, how dealer hedging amplifies the rebound, and which signals suggest whether the move will hold.
Why does implied volatility get so expensive before a known event, and what happens when it passes?
Markets will pay extra to protect against a single day. Ahead of the 2024 election, Cboe’s analysis showed a visible “bump” in option prices for contracts expiring on 6 November.
The election premium, as reported by Cboe Options expiring 6 November carried implied volatility of about 19.5%, compared with about 15% for shorter-dated contracts. The implied forward volatility for the result date alone was estimated at about 35% annualised.
Implied volatility is the level of future price movement that option prices are assuming. That 35% figure tells you traders were pricing the result day as more than twice as turbulent as an ordinary session. The same pattern shows up, on a smaller scale, around earnings reports, Consumer Price Index (CPI) releases and Federal Open Market Committee (FOMC) rate decisions.
Once the result is known, the premium unwinds in a predictable order:
- The range of outcomes narrows. One result replaces many possible ones.
- The event premium vanishes. Options expiring just after the event lose their special pricing.
- Demand for short-dated protection falls. There is less left to insure against.
- Put skew normalises. Downside protection stops trading at an extreme.
- Dealers adjust their hedges. Changes in option sensitivity force trades in stocks or futures.
What skew actually measures
Skew is the extra price investors pay for out-of-the-money puts (options that profit if the market falls) compared with equivalent calls (options that profit if it rises). It peaks just before an event because that is when protective buying is most intense.
After the 2024 result, Cboe reported one-month S&P 500 skew fell from the 98th to the 60th percentile, while one skew gauge dropped to 4% from 7%. The options analyst whose commentary prompted this piece argues the pattern has held across roughly two decades of events: skew starts very high, then drops once the event passes.
A falling VIX after a result tells you uncertainty has left prices. It does not tell you the outlook improved. Keep those two ideas apart before you read anything into the rally.
Reading the VIX correctly means knowing which regime you are in, because a drop from 20 to 16 carries a different meaning than a collapse from an extreme reading, and you should never treat the index in isolation.
When big ASX news breaks, our subscribers know first
How do put decay and dealer hedging unwinds turn a volatility crush into buying pressure?
That collapse in skew does not stay on the options screen. It works its way down into the hedge books of the dealers who sold those puts, and that is where buying pressure comes from.
Start with two definitions. Delta is how much an option’s price moves for each one-unit move in the underlying asset. Vanna is the change in delta as implied volatility changes. Charm is the change in delta as time passes.
Think of a dealer’s hedge as a seatbelt sized to the danger. When volatility falls and time passes, the danger shrinks, and the dealer loosens the belt by buying back stock.
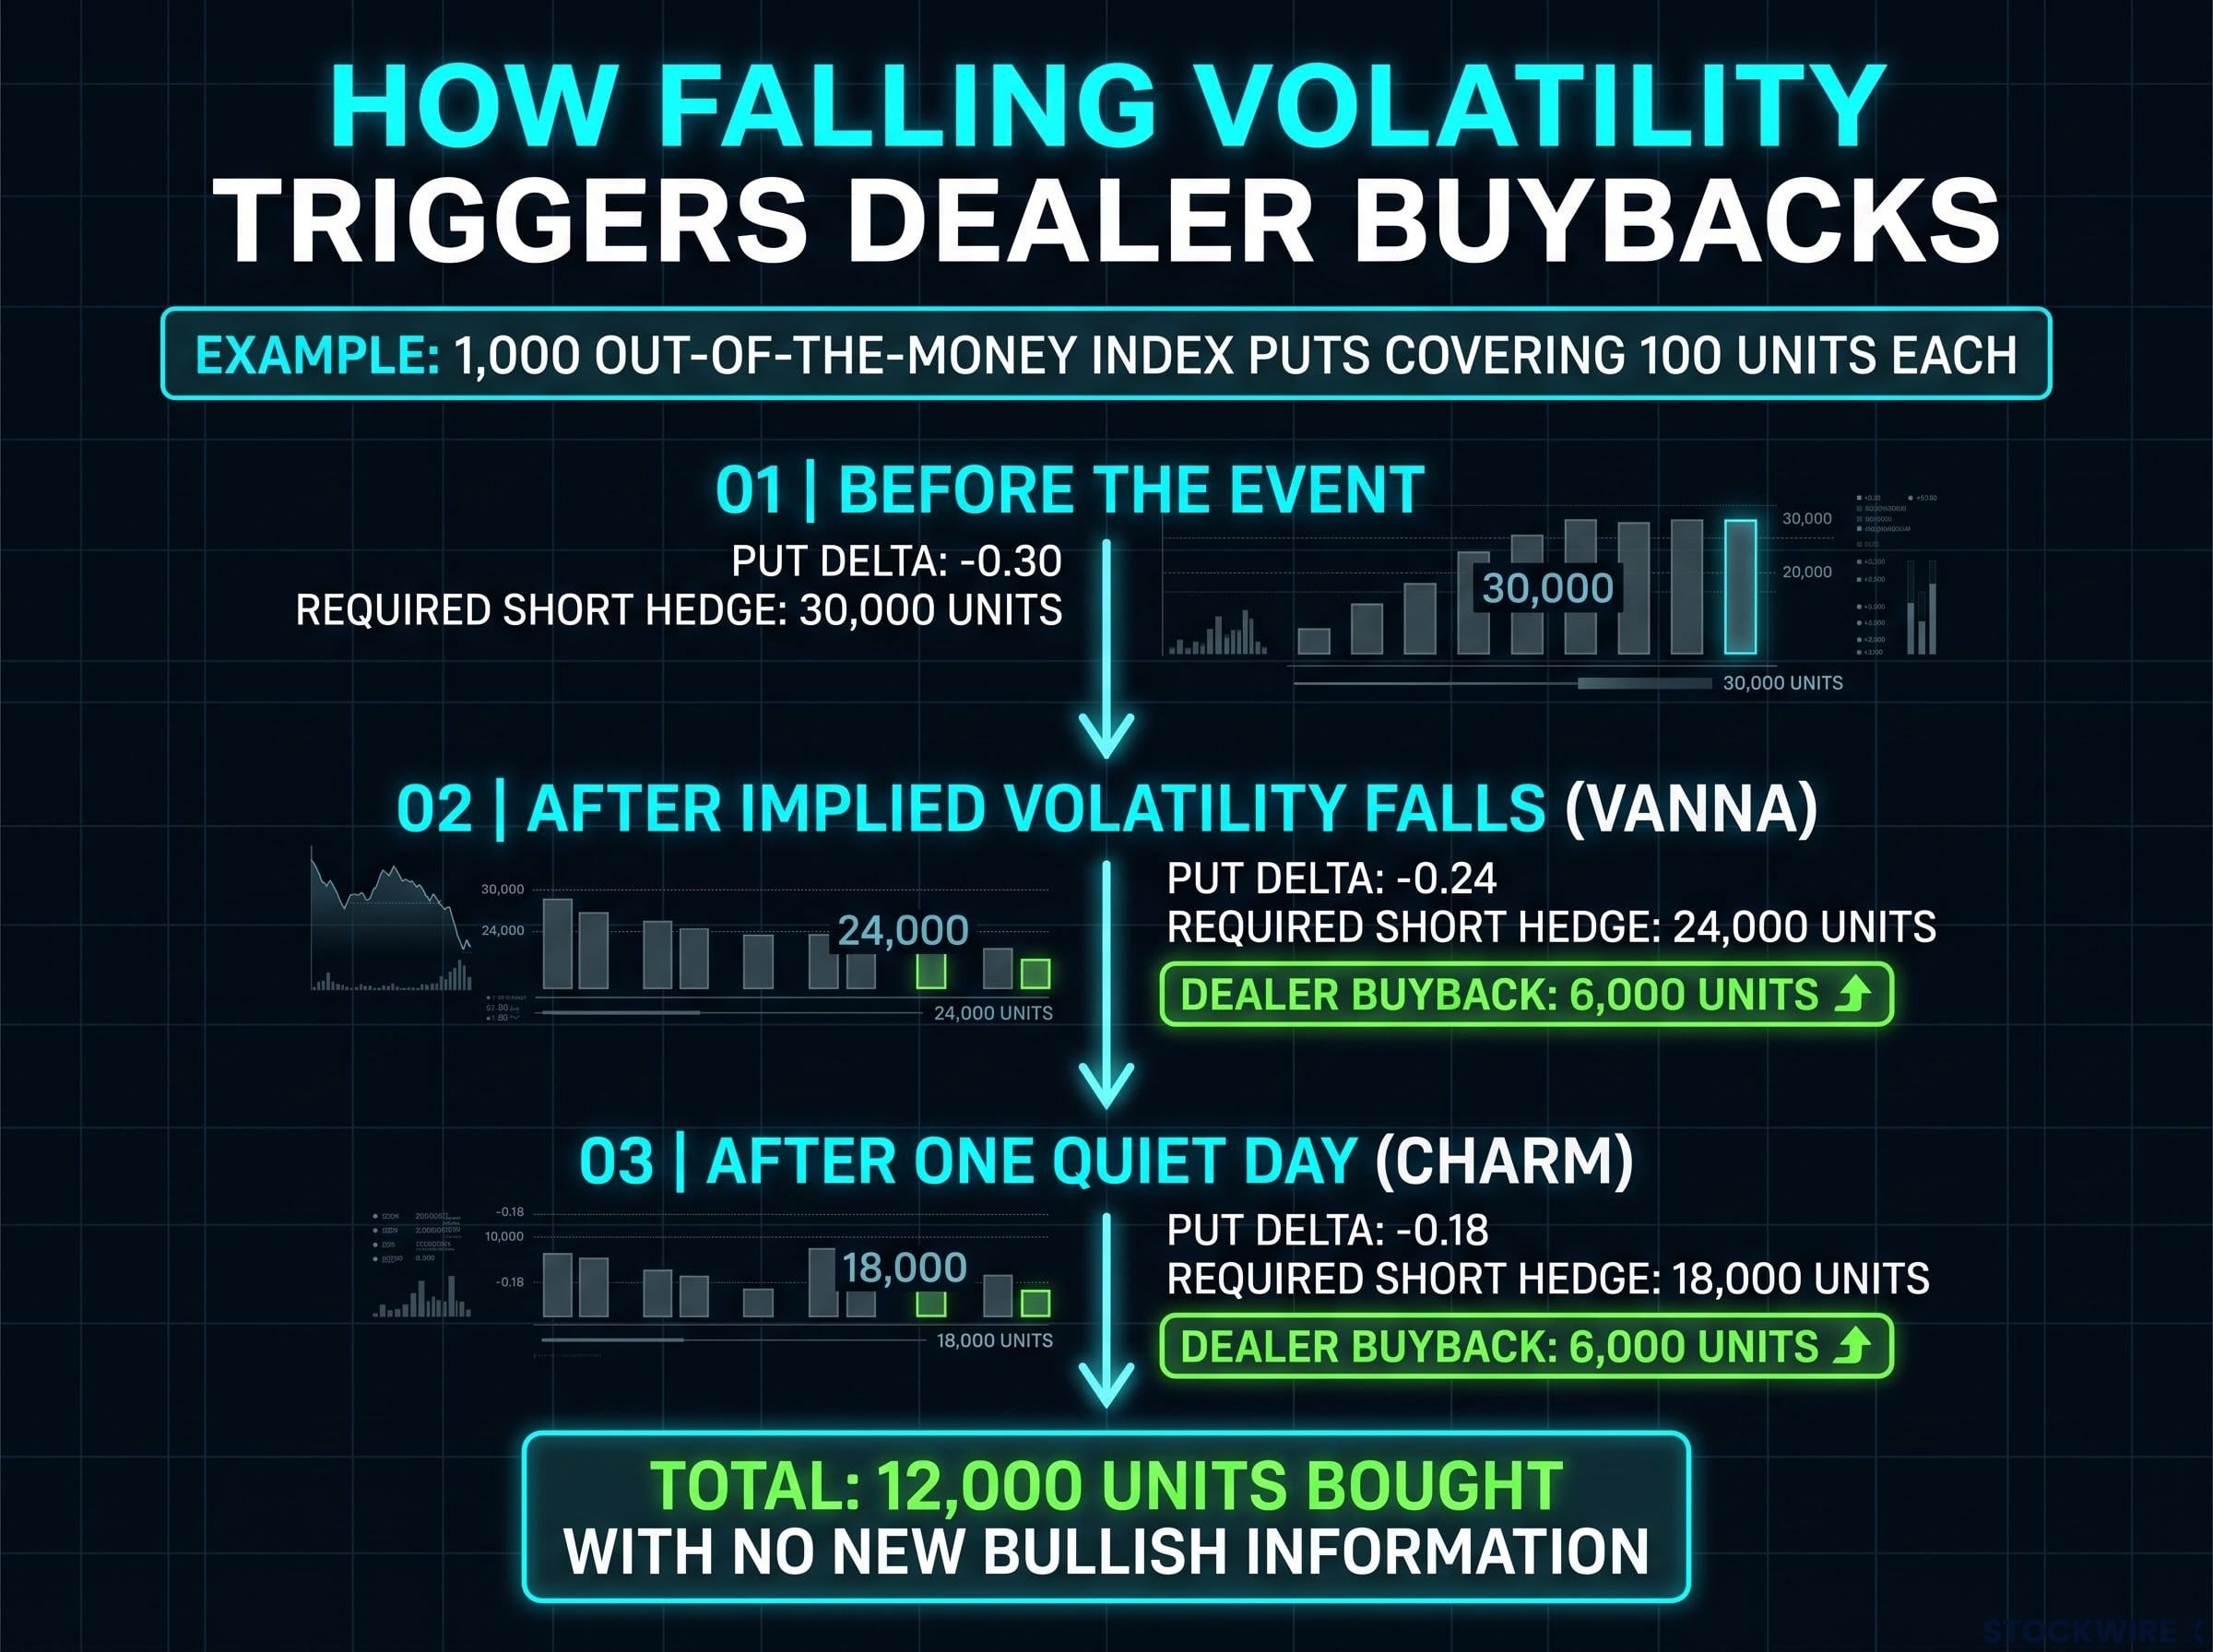
A mechanical dealer hedge unwind from falling volatility and time decay can result in 12,000 units bought with no new bullish information.
Here is how that works in practice. Suppose customers buy 1,000 out-of-the-money index puts, each covering 100 units, with a delta of -0.30. The dealer who sold them has sold about 30,000 units of the underlying as a hedge.
| Step | Put delta | Required short hedge | Dealer buyback |
|---|---|---|---|
| Before the event | -0.30 | 30,000 units | None |
| After implied volatility falls (vanna) | -0.24 | 24,000 units | About 6,000 units |
| After one quiet day (charm) | -0.18 | 18,000 units | Another 6,000 units |
That is 12,000 units bought with no new bullish information at all. One comparable commentary example, as reported and not independently verified, described a 300,000-unit hedge becoming too large and requiring a buyback of roughly 1,200 futures contracts.
The analyst applies this to 2024. The worst outcomes, a contested result or military strikes on Iran, did not happen. The initial drop was too small to trigger short-gamma dynamics, so protective puts decayed, holders cashed them in, and dealers bought back shares. In the analyst’s view, extending the decline would have needed an overnight drop of more than 2%.
When the flow does not run in your favour
Charm and vanna are not automatically bullish. The story above holds only when customers own the puts and dealers are short them and short stock against them. The flow can reverse when:
- dealers are long puts rather than short them
- puts move into the money, so their deltas grow rather than shrink
- the dealer book carries opposite gamma or vanna exposure
The early part of a post-event rally is therefore partly a function of positioning. Treat it that way before you treat it as fresh conviction.
What did volatility after elections look like in 2016 and 2024?
The mechanism becomes easier to trust when you watch it play out twice from opposite starting points.
2016: spike, then reversal
Overnight on 8-9 November 2016, S&P 500 futures fell about 5% to their limit-down level, as reported. Then came the acceptance speech, a reassessment of what the result meant for the economy, and a steady retracement.
By the cash session on 9 November, the Dow had risen about 1.4% to 18,589.69. The VIX closed at 14.38, down 23%, according to Reuters. Positioning had hinted this was coming: a reported record 769,214 VIX puts traded on 4 November, bets on volatility collapsing.
2024: relief and record closes
In 2024 there was no panic to reverse. The worst cases were avoided, and the VIX fell from 20.49 to 16.27 on 6 November, about 21%. The Dow gained 3.57%, the S&P 500 2.53% and the Nasdaq Composite 2.95%, all closing at records.
Record-close volatility compression is a related pattern: options imply a much larger daily move than the market delivers on record days, which shows how quickly implied volatility can sit above what is realised.
Skew normalised and call demand followed. Reuters reported call volume ran ahead of put volume by 1.5-to-1 by 15 November, with the VIX near 13.67. Cboe said the VIX fell nearly 8 points in the first week of November and ended the month near 13.50; a separate Cboe figure cited a seven-point one-week fall to about 15, reflecting a different measurement window.
| Measure | 2016 | 2024 |
|---|---|---|
| VIX move | Closed at 14.38, down 23% on 9 November | Fell 4.22 points to 16.27, about 21%, on 6 November |
| Equity reaction | Overnight futures down about 5%, Dow up about 1.4% in cash session | Record closes, S&P 500 up 2.53% |
| Positioning signal | Reported record 769,214 VIX puts on 4 November | Call-to-put volume 1.5-to-1 by 15 November |
Brexit, FOMC meetings and earnings seasons show the same shape: volatility bid into the event, removed after it.
Two very different elections produced VIX drops of similar size. That tells you the crush follows the removal of uncertainty, not the political outcome.
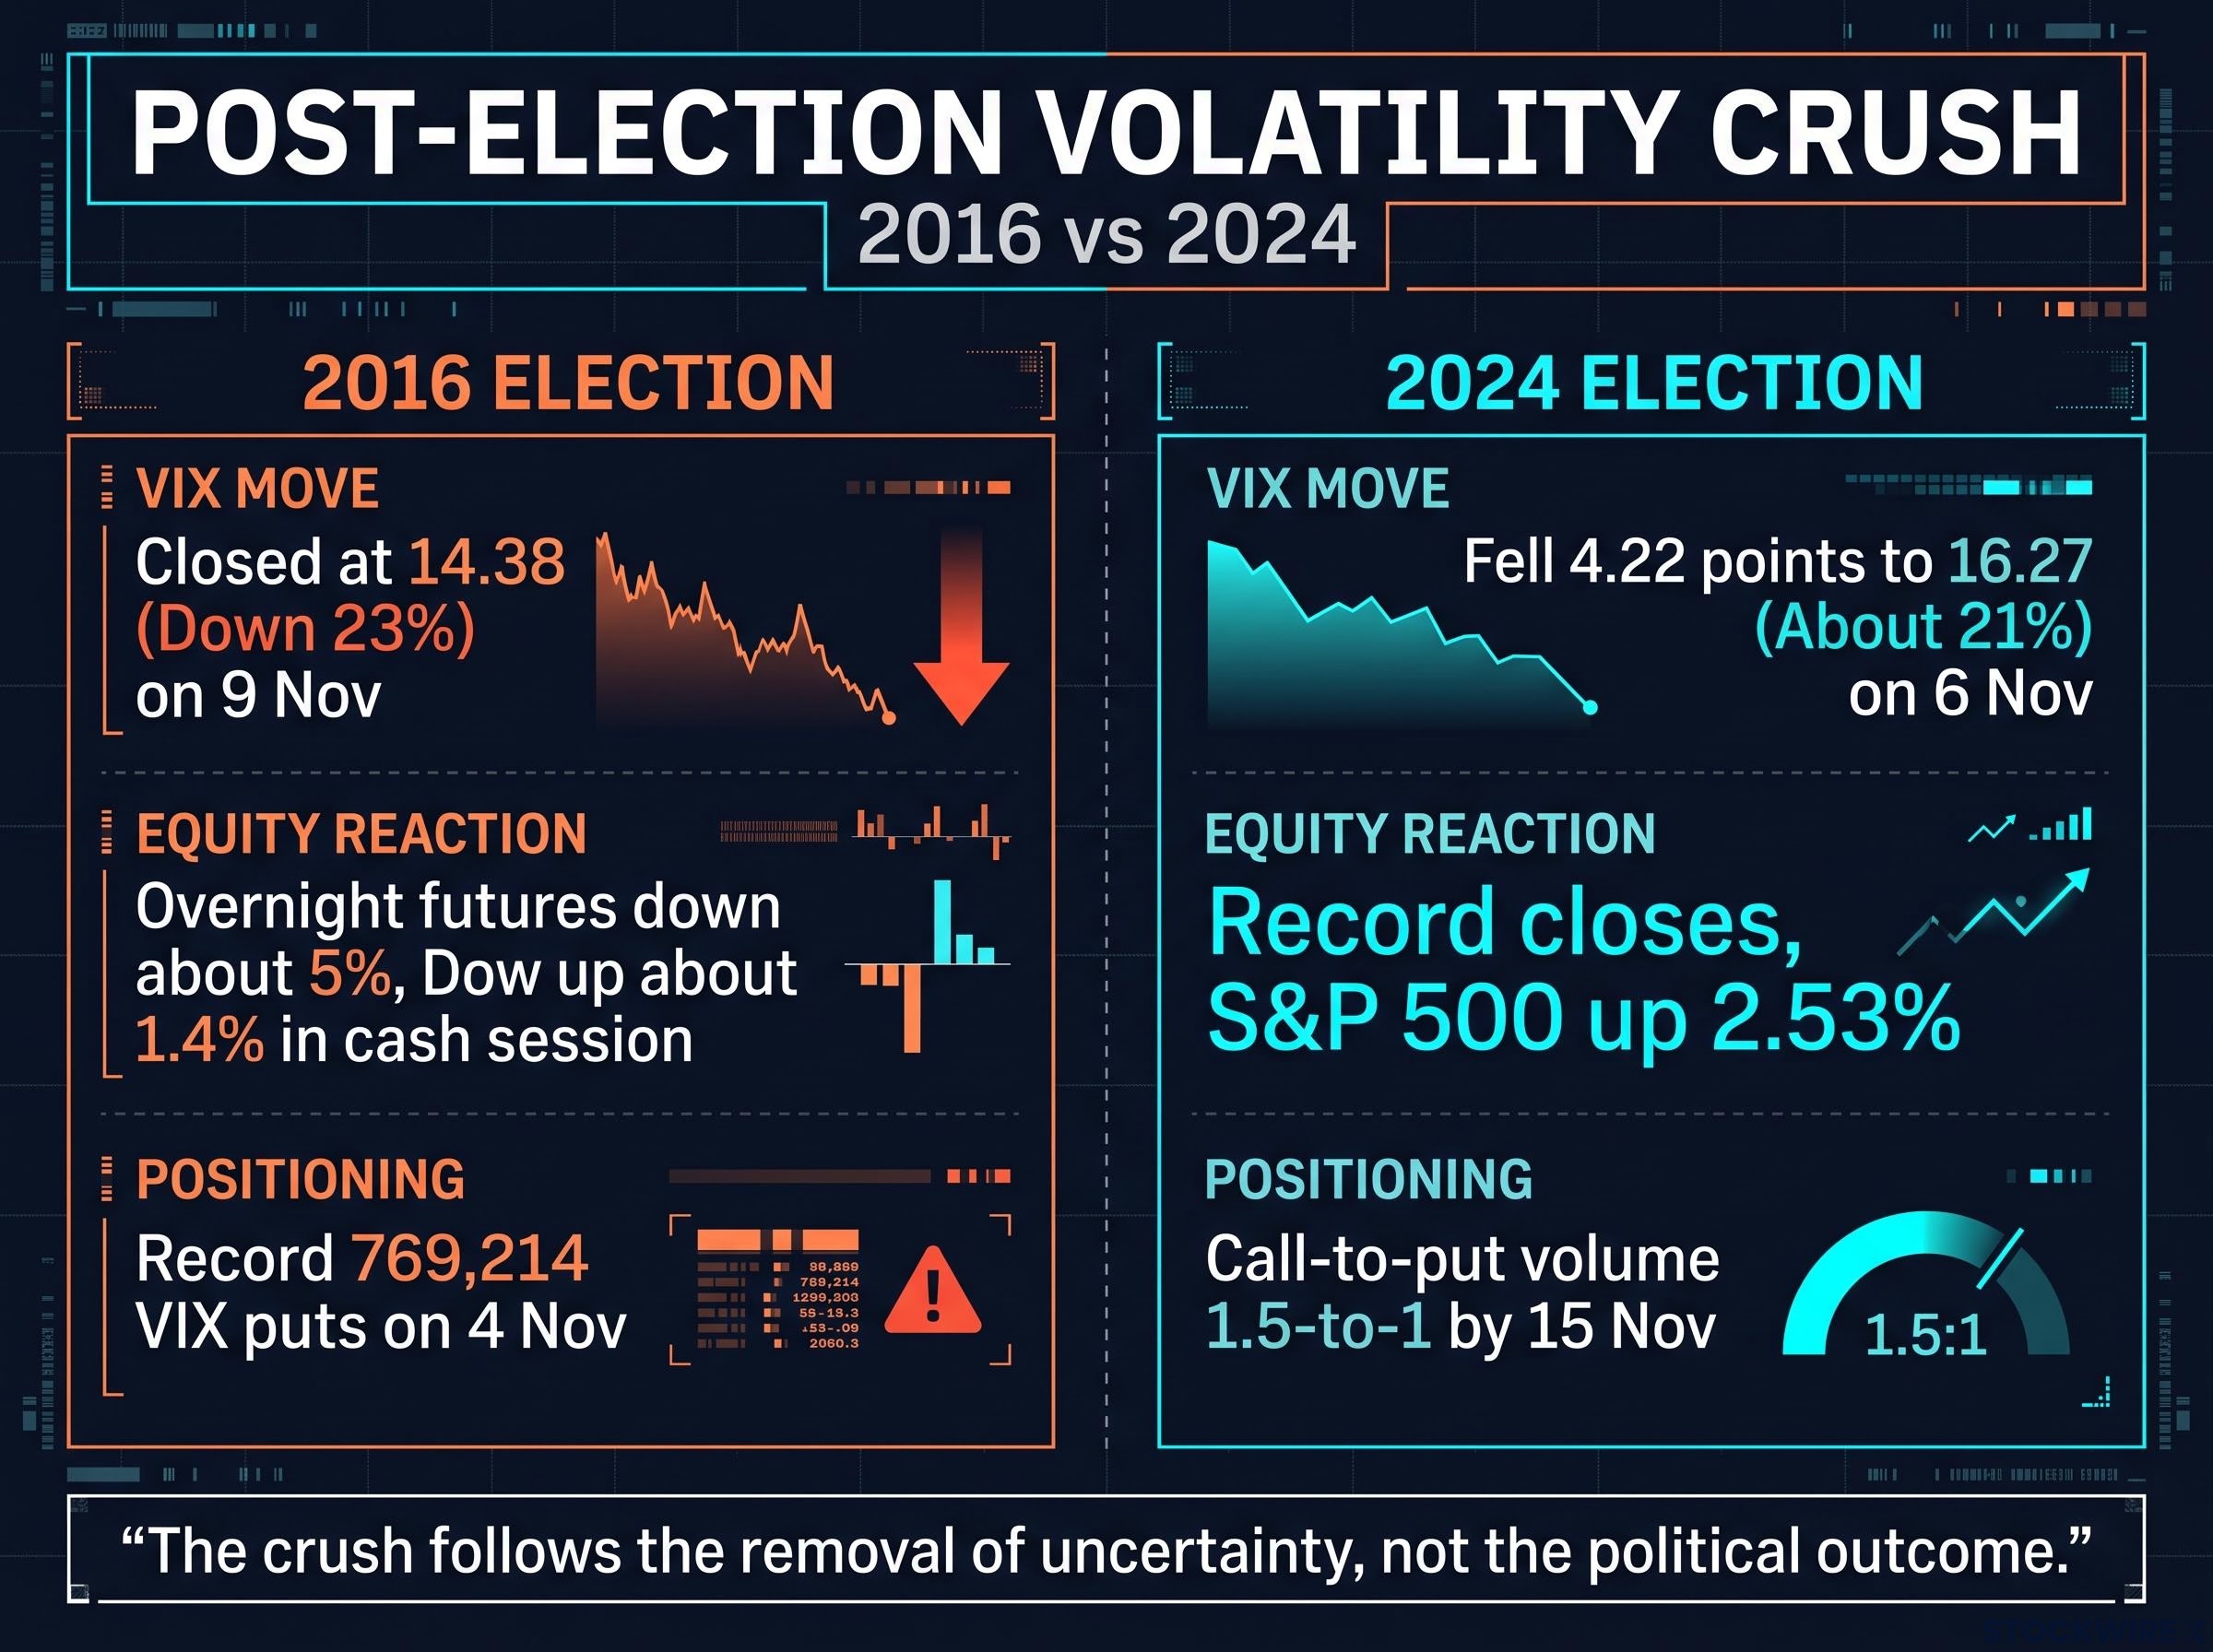
The 2016 and 2024 elections both saw a rapid VIX crush of 23% and about 21% respectively, as uncertainty was removed.
Is it a durable rebound or a dead cat bounce, and how do traders tell?
If the crush is mechanical, the real question is what happens once the mechanical buying runs out. A dead cat bounce is a short-lived rise driven by flows while the broader economic picture stays weak. A durable rebound is one where flows feed further buying, through call demand and positive gamma, and the move holds.
| View | Argument | Caveat |
|---|---|---|
| Flow rebound persists | Premium collapse, dealer buybacks, call demand and positive gamma can reinforce each other (2016, 2024) | Fades when puts expire, hedges reset or dealers turn short gamma |
| Technical bounce only | Forced buying without better fundamentals; prior direction resumes once flows exhaust | Calling it too early ignores a genuine removal of risk premium |
| 20-day moving average | Holding above suggests support; rejection suggests a flow-driven move | Lagging indicator, not proof flows are exhausted |
| Weak macro | Dealer buying lifts prices without changing the trend | Strong policy or earnings repricing can overwhelm weak macro |
The 20-day moving average is the average closing price over the past 20 trading days. The analyst’s signal is that when news is broadly negative, flows tend to fade near this level, a sign the mechanical buying is spent while fundamentals stay poor.
The analyst’s view (opinion) A rally driven by flows amid weak macro is a dead cat bounce. If the bounce fades and looks weak, the analyst’s stance is to sell into it.
The analyst also flags Friday-to-Monday risk, arguing nearly every major crash has run from a Friday into a Monday, and treats a mid-to-late afternoon selloff, around 2:30-3pm, as an alarm. Once remaining positive flows fade, the analyst expects the market to fail by December, possibly earlier. These statements are speculative and subject to change based on market developments.
What current positioning suggests
Readings from earlier this week, reported and not independently verified, point to a less settled backdrop. SpotGamma put the VIX at about 20 at the 3 November 2026 close, its highest in nearly three months. FlashAlpha’s model estimated SPY net gamma at -$7.48 billion, implying dealers are short gamma, and SpotGamma mapped negative gamma broadly below about 7,750-7,800 on the S&P 500 index (SPX).
No Goldman Sachs dealer-gamma estimate was found. This picture looks unstable rather than calm, but it does not confirm the December call. A bounce that stalls at the 20-day average amid weak macro tells you the buying was mechanical, so size your conviction to the signal, not the headline.
Reading the next event with a flow-aware lens
The sequence now has three parts you can track. The event premium collapses once the result lands. Dealer hedges unwind and supply mechanical buying. Then the 20-day average and the macro backdrop decide whether the move lasts.
Before the next scheduled event, keep an eye on four variables:
- Skew level: how stretched downside protection is going in
- Dealer gamma positioning: whether dealers are long or short gamma
- The 20-day moving average: whether a rebound holds above it or stalls
- Macro tone: whether earnings and policy support the move
When all four line up, a rebound has room to run. When they diverge, you are likely watching flows, not a fresh view on the economy.
Post-midterm market returns have been positive in the 12 months after 21 of the last 22 votes, which suggests the macro backdrop, not the headline result, usually decides whether a post-event move lasts.
This article is for informational purposes only and should not be considered financial advice. Investors should conduct their own research and consult with financial professionals before making investment decisions.