
Semiconductor stocks just lost about 20% in five trading days, including a 12.3% collapse in the Philadelphia Semiconductor Index (SOX) on a single session. The broader market, bruised as it is, still does not look like a market in a bear phase. That gap sits at the centre of the current tech selloff and the debate over AI valuations, and it raises an uncomfortable question about whether a calm-looking index is concealing something.
The rout on 5 November 2026 erased about $3 trillion from the S&P 500, which fell 3.6%, while the CBOE Volatility Index (VIX), a gauge of expected near-term swings in the S&P 500, jumped to 28.36. At the same time, valuation talk around Anthropic’s pending IPO kept sliding. Together, those moves have revived comparisons with 2000.
The story is unresolved. On 6 November, the SOX bounced 4.2%.
Here is why a tech decline could unfold in stages rather than as a single crash, what is slowing it down, and which developments would break that pattern.
What the selloff and the Anthropic IPO chatter are telling you
The damage on Thursday was concentrated, fast and deep. Reuters tied it to a mix of pressures: doubts about the cost and durability of AI capital spending, concern that a Democratic-controlled Congress could scrutinise data-centre construction, and an energy shock linked to the Iran war.
| Benchmark | 5 Nov move | 6 Nov move or note | 5-day or 20-day move |
|---|---|---|---|
| SOX | -12.3% | +4.2% | About -20% (5-day); about -26% (20-day) |
| Nasdaq-100 | -6.4% | Partial rebound | Not published |
| Nasdaq Composite | -5.5% (earlier wrap: -4.7%) | Partial rebound | Not published |
| S&P 500 Information Technology | -7.3% | Partial rebound | Not published |
| S&P 500 | -3.6% | About $3 trillion erased on 5 Nov | Not published |
| VIX | Up 11.75 points to 28.36 | Eight-month high | n/a |
According to 247WallSt, the SOX’s five-day slide ranks among only a handful of declines that size in the index’s history. Market commentary has also put broader tech down about 14% over five days and nearly 18% over 20 days, though no benchmark-specific confirmation of those figures was found.
Why Anthropic’s valuation matters beyond one IPO
Anthropic filed a public S-1 with the SEC on 26 October 2026, planning to list on the Nasdaq Global Select Market under the ticker ANT. The amended filing still lacks a price range.
The valuation talk has moved in one direction. Reuters reported expectations of about $2 trillion, which slipped to about $1.5 trillion before the selloff. The WSJ later reported that some prospective investors suggested about $1 trillion. One market commentator traced a steeper path, from roughly $2.5 trillion to nearly $1.2 trillion. All of it is chatter, not a formal price cut.
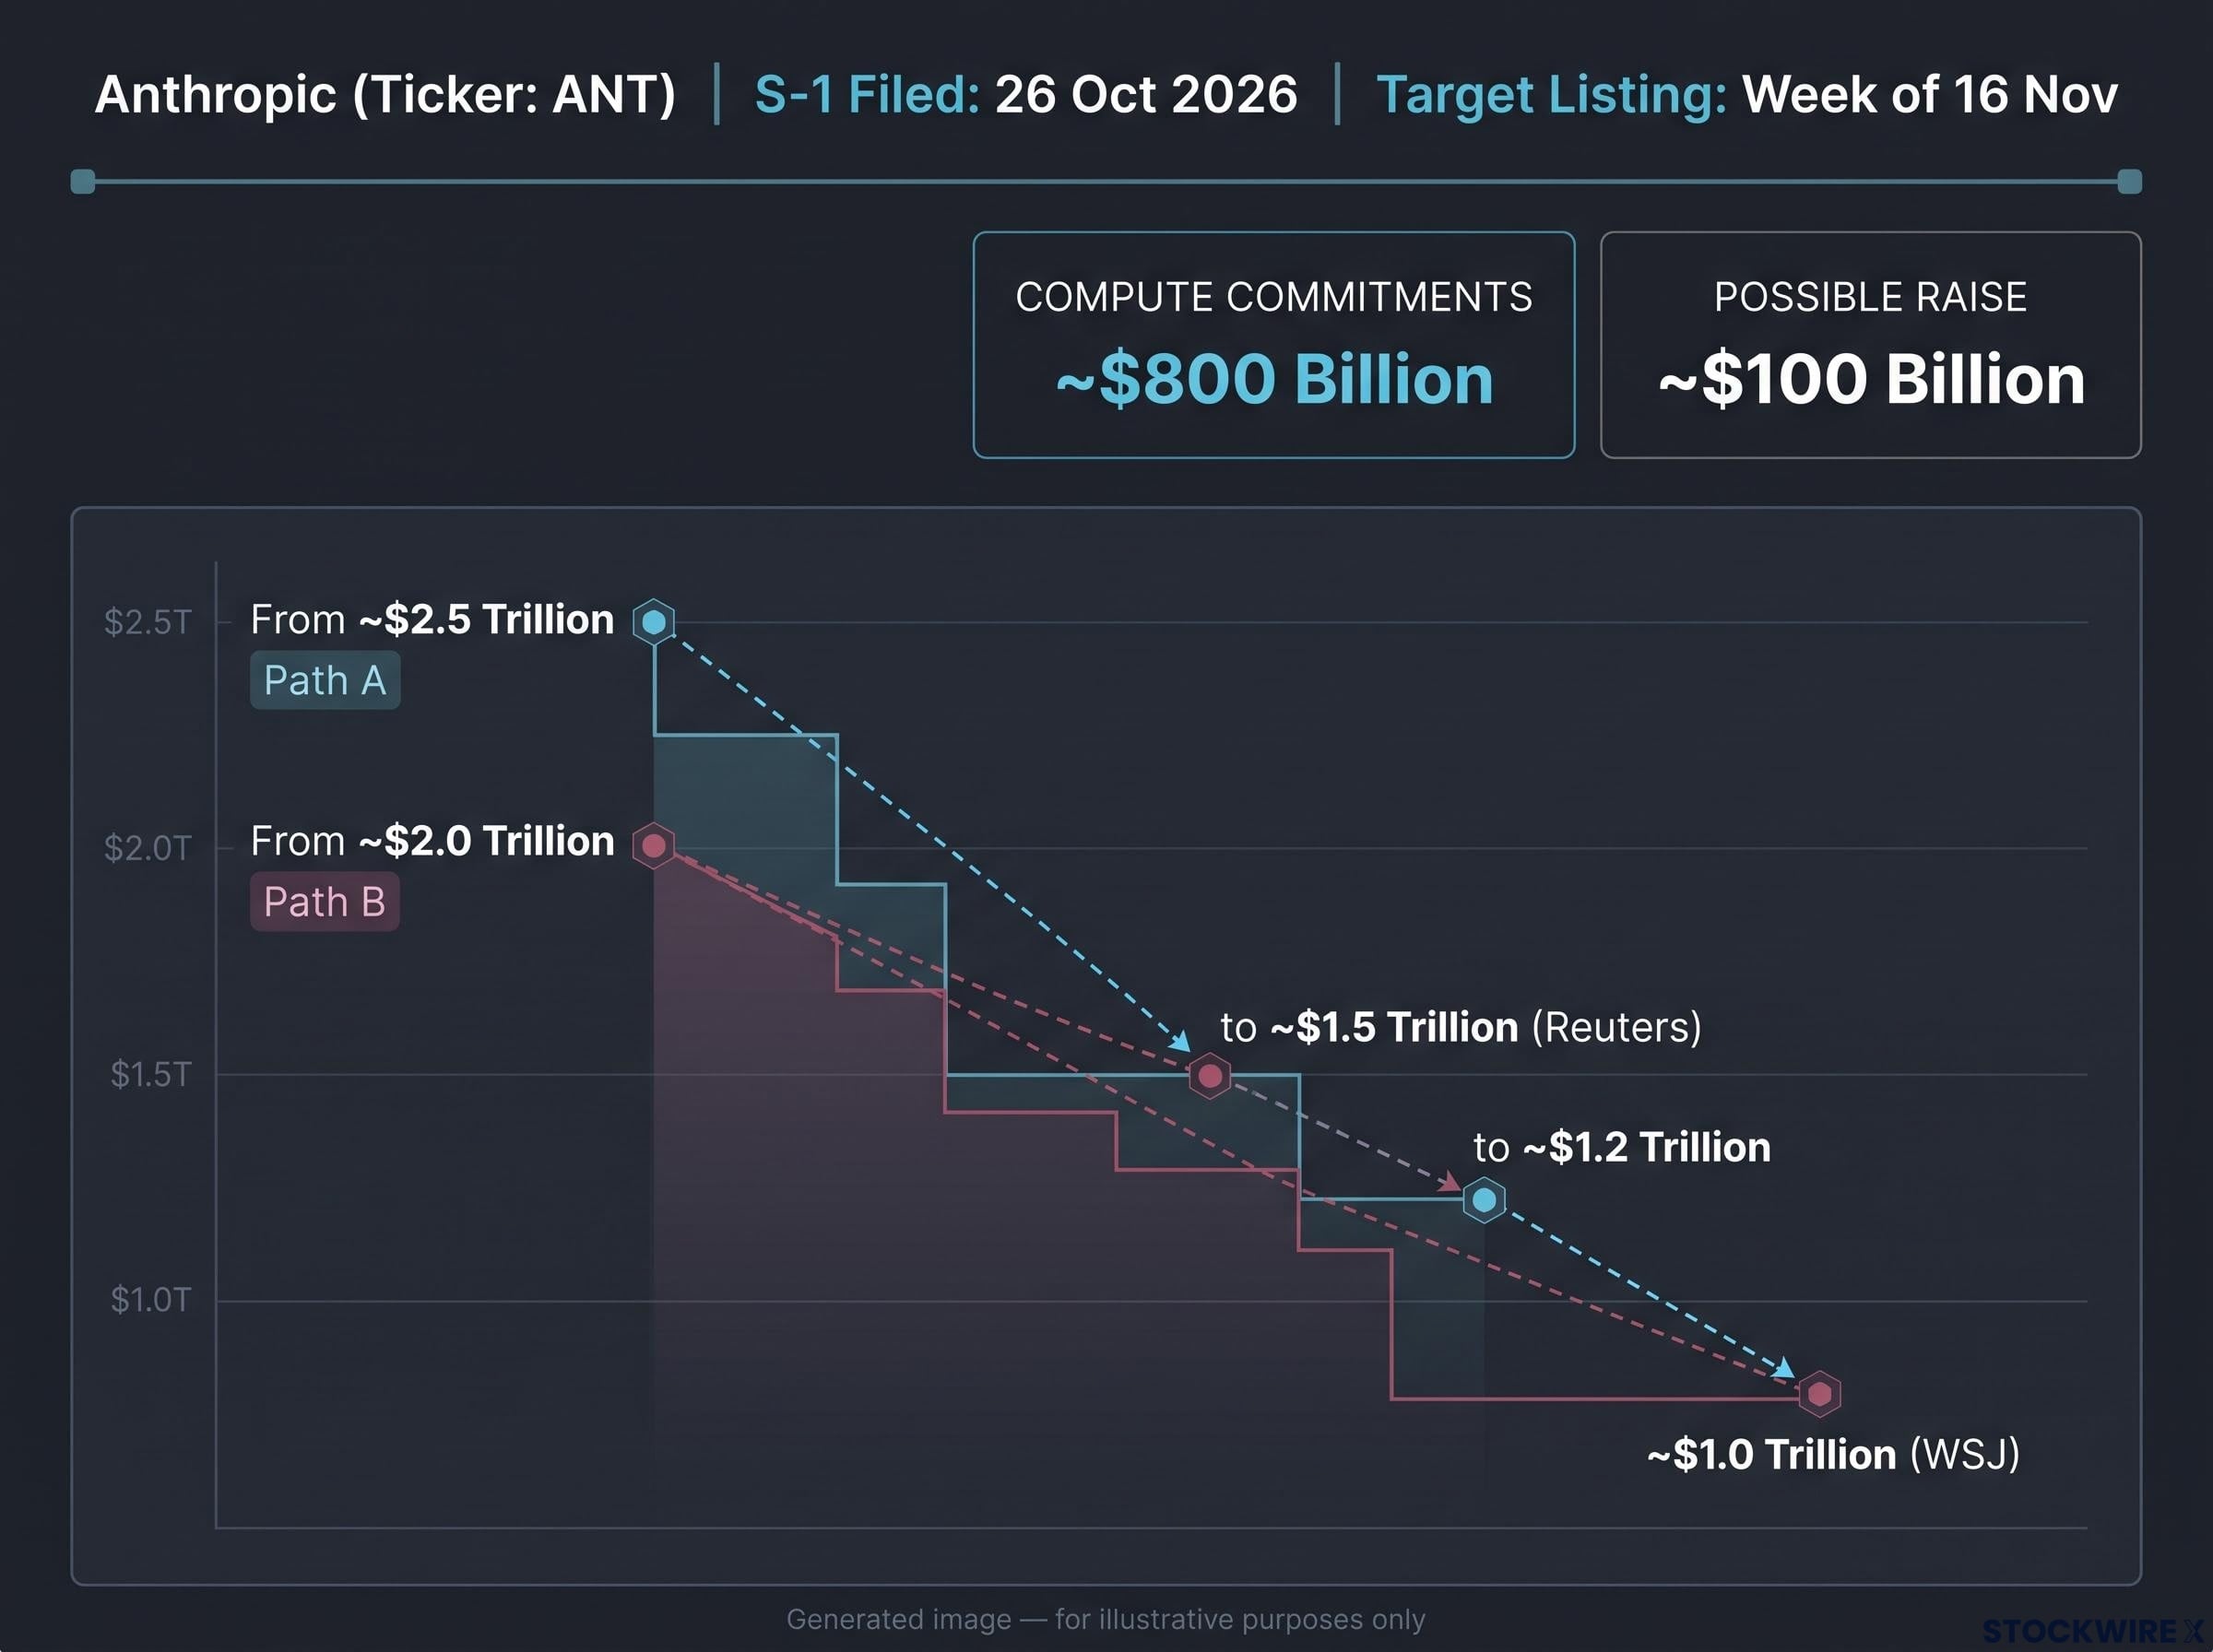
Pre-IPO chatter shows Anthropic’s valuation expectations shrinking, with estimates falling from ~$2.5 Trillion to as low as ~$1.0 Trillion.
The scale explains why the chatter matters. Reports point to compute commitments of nearly $800 billion and a possible raise of up to about $100 billion, with listing targeted for the week of 16 November, subject to change.
When private-market valuations fall ahead of a record IPO, the funding side of the AI trade is repricing, not just the listed stocks. That matters for your tech exposure because spending plans depend on capital being available at generous prices.
When big ASX news breaks, our subscribers know first
Why hedging and structured products may slow the fall
The surprising part is that the market’s defences are real. Heavy hedging and elevated skew (the extra price investors pay for downside protection relative to upside bets) create what one commentator called a “wall of worry”. That positioning can actually support prices.
The support comes from four flow mechanisms:
- Put demand: Index-put premiums ran about twice normal levels on 5 November, Reuters reported citing Mercury Alerts. Dealer hedging adds pressure at first, then fades as puts decay, expire or are cashed in.
- Zero-days-to-expiry (0DTE) options: These contracts expire the same day. SpotGamma has linked earlier S&P 500 drops to 0DTE hedging that disappeared once the contracts expired.
- Leveraged ETF rebalancing: These funds must buy or sell at the close to maintain their leverage, which creates scheduled selling on big down days. The selling stops when volatility settles.
- Structured products: Autocallables and buffered notes can leave dealers long gamma around key price levels, suppressing swings until positions expire or barriers break.
Nomura’s estimate About $47 billion of leveraged ETF selling hit the 5 November close, the second-largest amount in Nomura’s data since July 2006, concentrated in tech and AI funds.
That is the conditional part. SpotGamma describes a “risk pivot” below which hedging amplifies moves instead of absorbing them. Commentary has also warned that a single-day drop remains possible, and escalation such as strikes on Iran, higher oil or administration actions could overwhelm these supportive flows.
If you are watching for a crash signal, these flows suggest the first leg down is more likely to be uneven than disorderly, until dealers flip to short gamma.
How compressed index volatility and dispersion mask stress
Those flows also explain how an index can stay calm while its biggest components struggle. Two terms matter here.
Dispersion measures how differently individual stocks move from one another. A dispersion trade sells volatility on the index and buys it on individual stocks, so it profits when stocks swing apart while the index stays steady. Implied correlation is the market’s estimate of how closely stocks will move together.
UBS derivatives strategist Kieran Diamond has described 2025-26 as a period of rotation and narrow leadership, linked to exceptionally low implied correlation, and warned that a macro shock could trigger an outsized VIX spike. Bloomberg-linked commentary put implied correlation below 10. Goldman Sachs called recent moves rotation rather than liquidation, while JPMorgan pointed to an unusually large momentum unwind.
Cboe commentary showed how far the masking can go: in a tech-led selloff, nine of eleven S&P sectors could still finish higher, and one-month S&P volatility rose only 0.6 points. One market commentator argues compressed index volatility has driven dispersion higher over the past three to four years.
The sequence runs like this:
- Large tech names fall.
- Capital rotates into healthcare, industrials, energy or defensives.
- The index holds roughly steady.
- Dispersion rises beneath the surface.
- A broad catalyst arrives.
- Correlation jumps as everything falls together.
- Dispersion trades lose money, and index volatility surges.
What ends the mask
The likely catalysts are a rates shock, a credit event, geopolitical escalation or an oil spike. Any of these can push stocks to move as one, which lifts correlation abruptly. One commentator frames the pinned index as something that ultimately breaks.
A steady S&P 500 does not mean your tech exposure is safe. It may only mean money is moving between sectors, so check your sector weights rather than the index headline.
For readers wanting to test their own holdings, our dedicated guide to checking stock correlation shows how to spot semiconductor positions that are really one bet.
What did 2000 actually look like, and where does the comparison fail?
The masking pattern has a precedent. The Nasdaq Composite peaked at 5,048.62 on 10 March 2000 and bottomed at 1,114.11 on 9 October 2002, a 77.9% fall. The S&P 500 dropped from 1,527.46 to 776.76, or 49.1%.
The early stage looked very different. According to a Federal Reserve Bank of Cleveland retrospective, the Nasdaq was about 50% below its peak by the end of 2000, while the S&P 500 was only about 15% below its peak and about 10% below its 1999 year-end level. One commentator recalled the market outside tech rising about 15% that year, though no standardised ex-tech figure was found.
| Where 2000 and now rhyme | Where they differ |
|---|---|
| Concentrated leadership in tech and communications | Today’s leaders are largely profitable mega-caps, not loss-making IPOs |
| Extrapolated growth assumptions | Real demand for data centres, cloud and accelerated computing |
| Infrastructure spending treated as proof of opportunity | Stronger balance sheets and entrenched customers |
Anthropic sits on both sides of that table. It reports explosive growth and enormous compute commitments, yet faces institutional scrutiny of its valuation with no price in its S-1.
Other episodes offer narrower lessons:
- 2018: Rates and trade concerns drove de-risking in stages without an immediate recession.
- 2022: Higher real yields produced repeated lower highs and lower lows rather than one crash.
- 2024: Sharp semiconductor pullbacks were partly hidden by strength in other mega-caps.
The analogy works best as a template for the shape of a decline, with stairsteps and rotation, rather than as a forecast of a 78% collapse.
The Nasdaq 1997-2000 parallel is useful mainly for its mechanics: index concentration now exceeds 1999 levels, so a shock to a few mega-caps could spread through passive products even with lower forward multiples than the dot-com peak.
Educational: reading dealer gamma and put decay without a trading desk
Those staircase dynamics leave fingerprints on your screen. When dealers are long gamma, the index tends to drift in tight ranges and dips get bought. When they are short gamma, moves stretch and declines accelerate into the close.
Positive versus negative gamma in plain English
Gamma measures how quickly an option’s sensitivity to price changes as the underlying moves. When dealers hold positive gamma, their hedging means buying as prices fall and selling as they rise. Think of a shock absorber smoothing a bumpy road.
With negative gamma, dealers must sell as prices fall and buy as they rise, which amplifies the move. SpotGamma’s risk pivot marks its estimated boundary between the two. Dealer positioning is estimated by analysts, not directly observed.
Put decay adds a timing element. Options lose value as expiry approaches, so protective buying fades. Cboe observed put skew and convexity falling as investors cashed in hedges, and one commentator sees November-December hedging plus decaying puts as supportive for now. Once structured-product barriers break or contracts expire, that support can vanish.
Three signals to watch:
- VIX behaviour: A VIX that spikes and quickly retreats suggests absorption; one that keeps climbing suggests stress spreading.
- Skew changes: Falling skew means hedges are being monetised and the cushion is thinning.
- Expiry dates: Monthly options expiries and structured-product maturities are when support can disappear.
Knowing which side of gamma the market sits on tells you whether a bounce is likely to be sold or whether a drop is likely to feed on itself.
What the evidence supports, and what would change the path
The overall read The evidence best supports a rotation-led, potentially stair-step correction that options and structured-product flows can temporarily dampen, not yet a 2000-scale collapse.
That assessment holds only while correlations stay low. These triggers could flip it:
- Escalation with Iran
- A sustained oil surge
- Renewed inflation and higher yields
- A Fed or administration policy shock
- Tighter credit or failed AI financing
- Weak data-centre returns or utilisation
- Regulatory limits on AI infrastructure or power use
The Anthropic listing, targeted for the week of 16 November, is the nearest checkpoint for how the market prices AI. The bullish counterpoint remains credible: revenue growth, enterprise deployment and productivity gains could let earnings catch up with valuations.
Truist argues chip stocks may peak about a quarter after revenue growth does, and the SOX fell roughly 29% in mid-2026 while industry revenue forecasts kept rising, which fits a valuation correction better than a fundamental top.
Your decision comes down to whether you believe earnings will catch up before the funding window narrows, and what you would do if correlations start rising. These statements are speculative and subject to change based on market developments and company performance.
This article is for informational purposes only and should not be considered financial advice. Investors should conduct their own research and consult with financial professionals before making investment decisions.