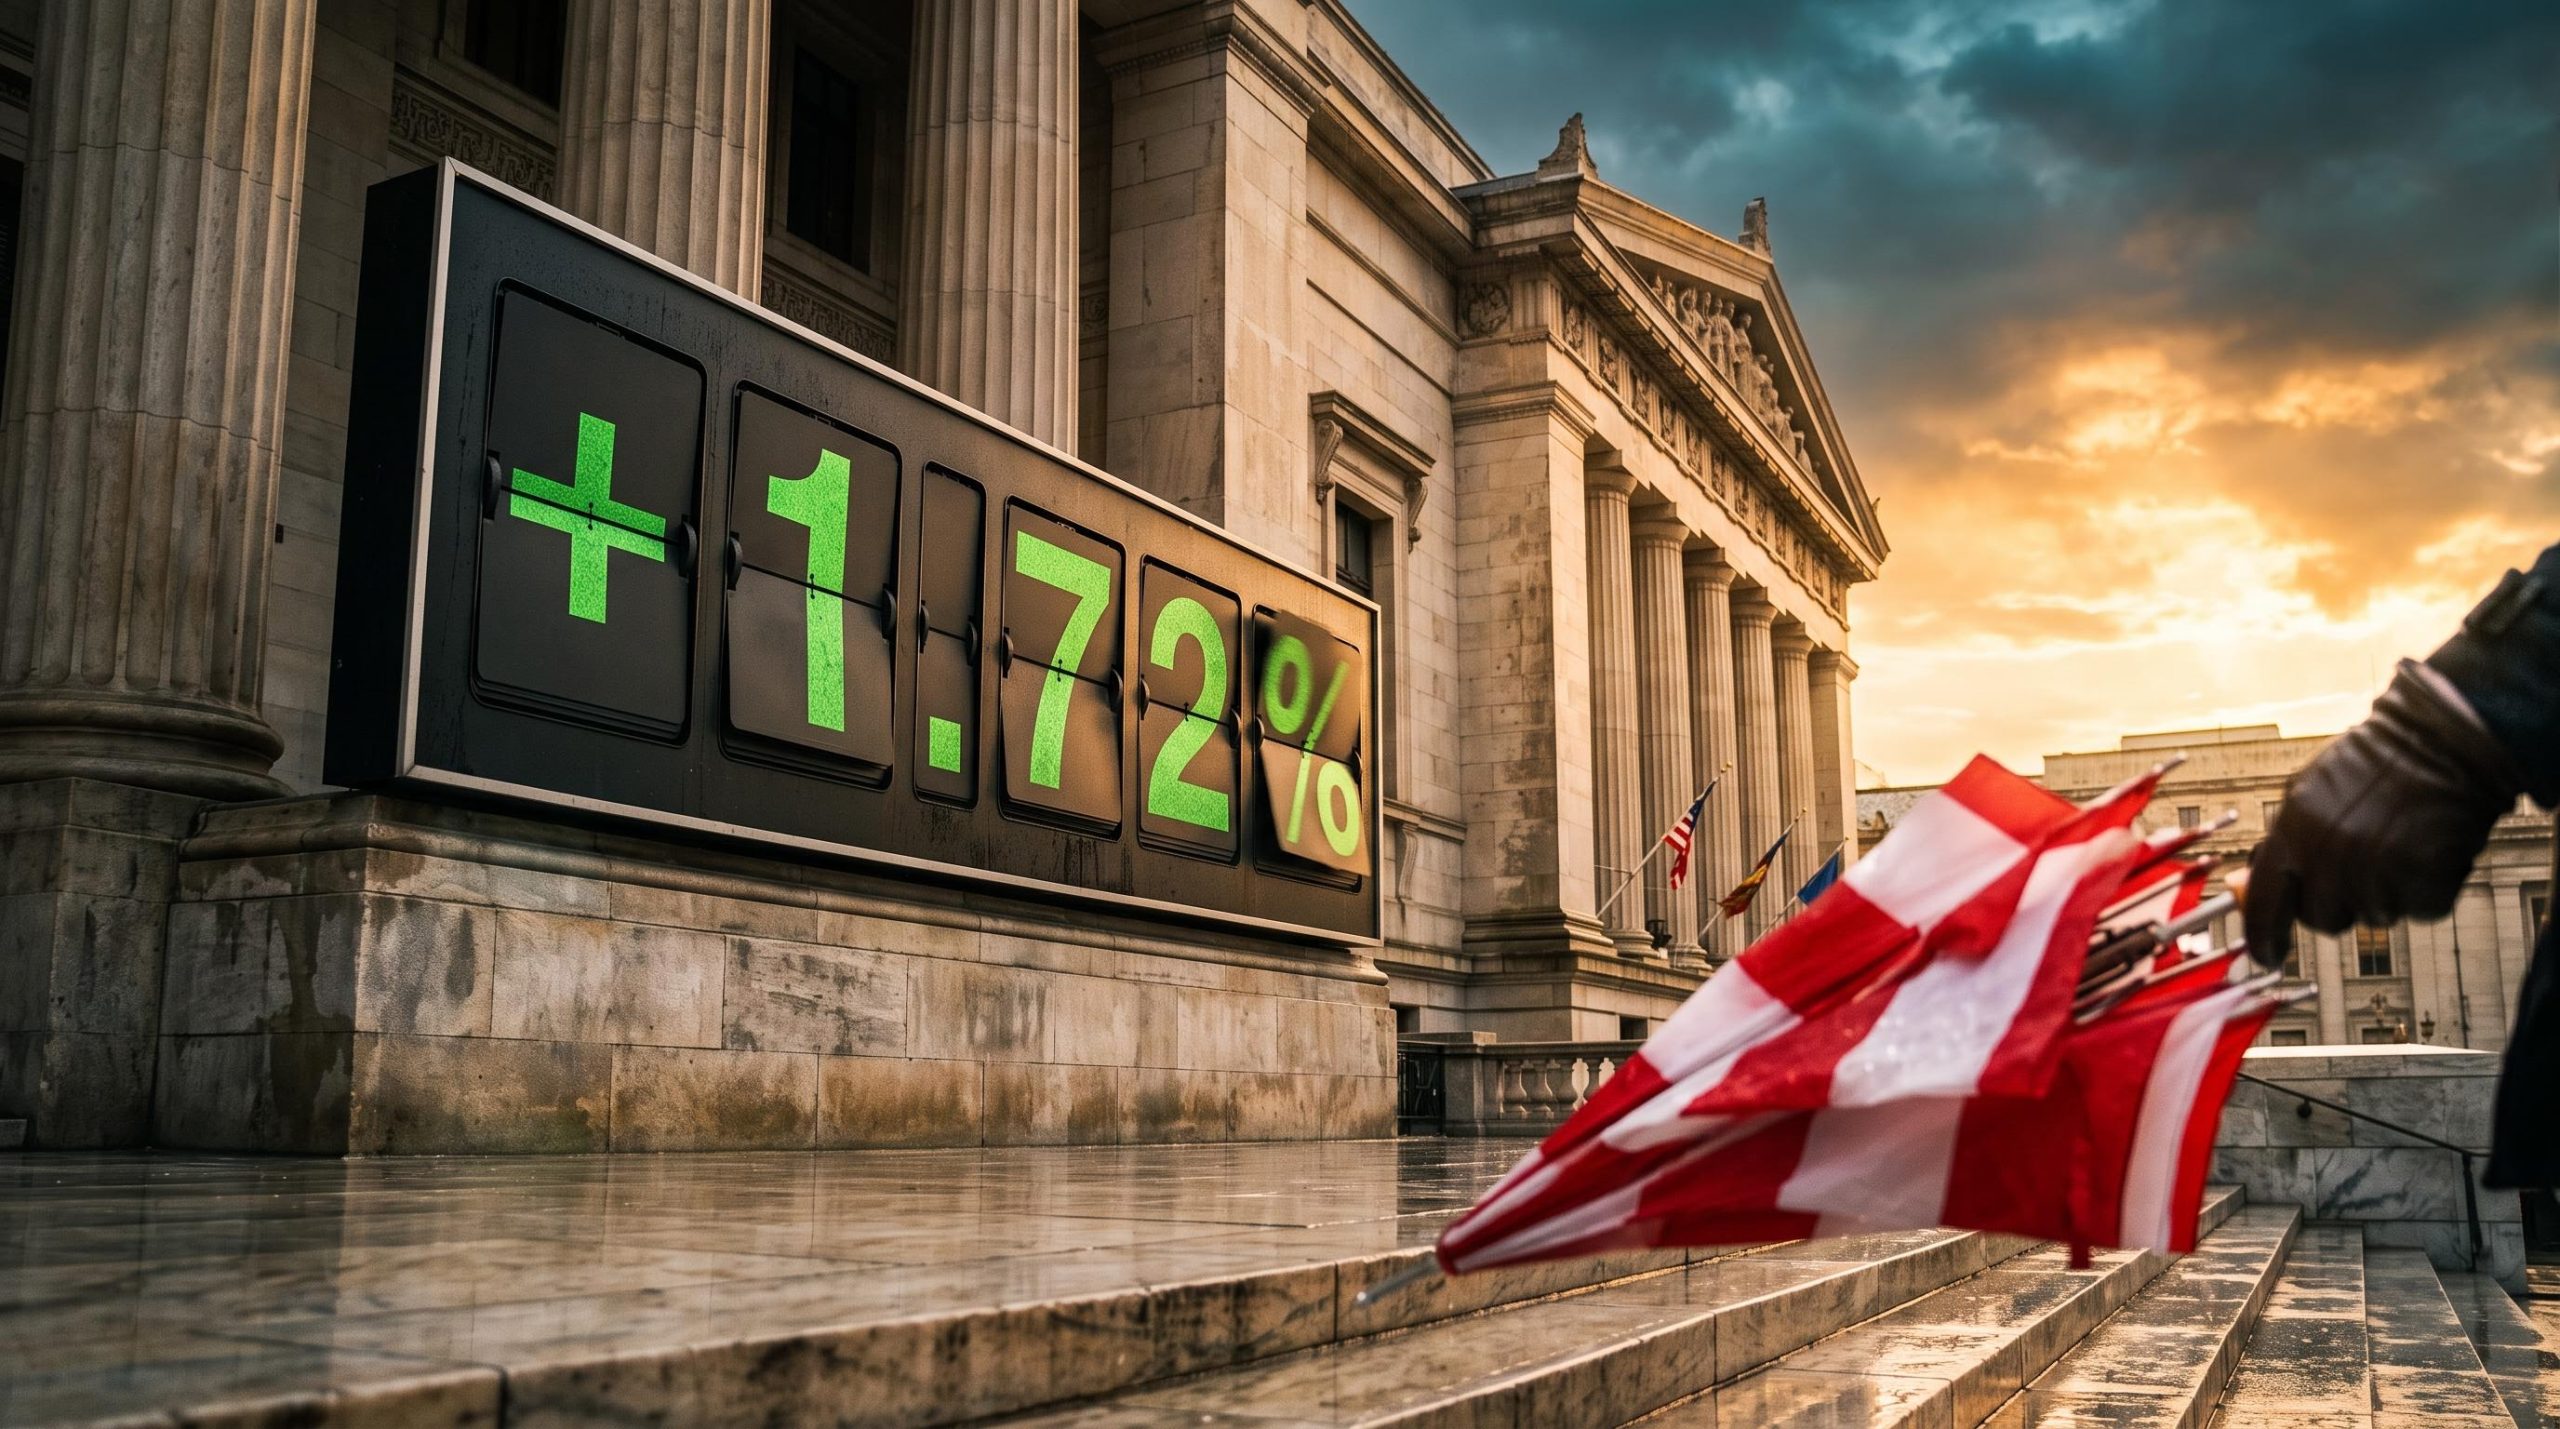
A 1.72% jump in the S&P 500 and a 2.13% gain in the Nasdaq on 4 November 2026 look like a market that suddenly turned bullish on the economy. If you read the post-midterm rally that way, one detail should stop you: Fed funds futures, the contracts that price where interest rates are heading, barely moved.
That gap matters. The Cboe Volatility Index (VIX), often called Wall Street’s fear gauge, fell roughly 20% as Democrats took control of both the House and the Senate.
Big index move, flat rate outlook. The more useful question is not what investors suddenly believed, but what they were buying and selling once the vote was behind them.
Here is how to tell an insurance repricing from a genuine change in outlook, and why that difference shapes how long a move like this tends to last.
What actually happened on November 4, and why the macro story does not fit
Start with the scale. According to Reuters, the S&P 500 closed at 7,698.80 and the Nasdaq Composite at 25,912.39. Yahoo Finance’s market coverage put the VIX down about 20%, and a separate options update placed it at 20.83.
A falling spot VIX can also be partly mechanical, since the 30-day window drops Election Day once it passes, which is why later-dated futures and key-state certification timelines still matter for how much political risk remains.
The political result was decisive. Reuters reported a Democratic Senate majority of at least 54-44 and a House gain of at least 25-28 seats, ending Republican unified control of Washington.
So the obvious story writes itself: a Democratic sweep, a market cheering divided government. Then you check rate pricing.
| Metric | 4 November reading | What it implies |
|---|---|---|
| S&P 500 | +1.72% to 7,698.80 | Broad buying across large caps |
| Nasdaq Composite | +2.13% to 25,912.39 | Growth stocks led the rebound |
| VIX | Down about 20% (separate reading 20.83) | Demand for protection fell sharply |
| December 2026 hike probability | About 76.6% (from 80% a week earlier) | Rate outlook largely unchanged |
CME FedWatch coverage showed roughly a 76.6% chance of a December 2026 rate hike, down from 80% a week earlier. Published estimates shifted with the sampling date, and no reliable post-election figures for December or June 2027 were found. What is clear is that a substantial probability of another hike remained, so this was not a dovish repricing.
The cracks widen further. Defence and data-centre stocks fell in some coverage even as the indexes climbed.
Goldman Sachs’ read on 4 November The rebound reflected the unwinding of defensive hedges set up before the vote and a compression of the political risk premium, not any sudden improvement in earnings or monetary-policy fundamentals.
That leaves mechanical relief as the best explanation for the immediate jump, with divided government a medium-term secondary narrative. When an index surges while rate expectations hardly budge, you are most likely watching positioning change rather than a new view of the economy. That distinction tells you a lot about how durable the move is.
When big ASX news breaks, our subscribers know first
How do options skew and hedge unwinding create buying pressure?
The signal showed up before the vote, in the price of downside protection. Think of it like storm insurance: premiums climb as the storm approaches and fall once it passes. What happens to the insurer’s own hedges when that happens is where the buying comes from.
What skew measures
Skew is the relative cost of out-of-the-money puts compared with out-of-the-money calls. A put is a contract that gains value if a stock or index falls; out-of-the-money means the strike price is some distance from the current price. When skew is high, you are paying a lot for protection against a sharp fall.
Saxo’s Koen Hoorelbeke reported the CBOE SKEW index at 152.78 on 3 November, up 2.02% and above its 145.95 median. That is elevated, not a record. The record reading Hoorelbeke flagged was for implied correlation, a separate measure.
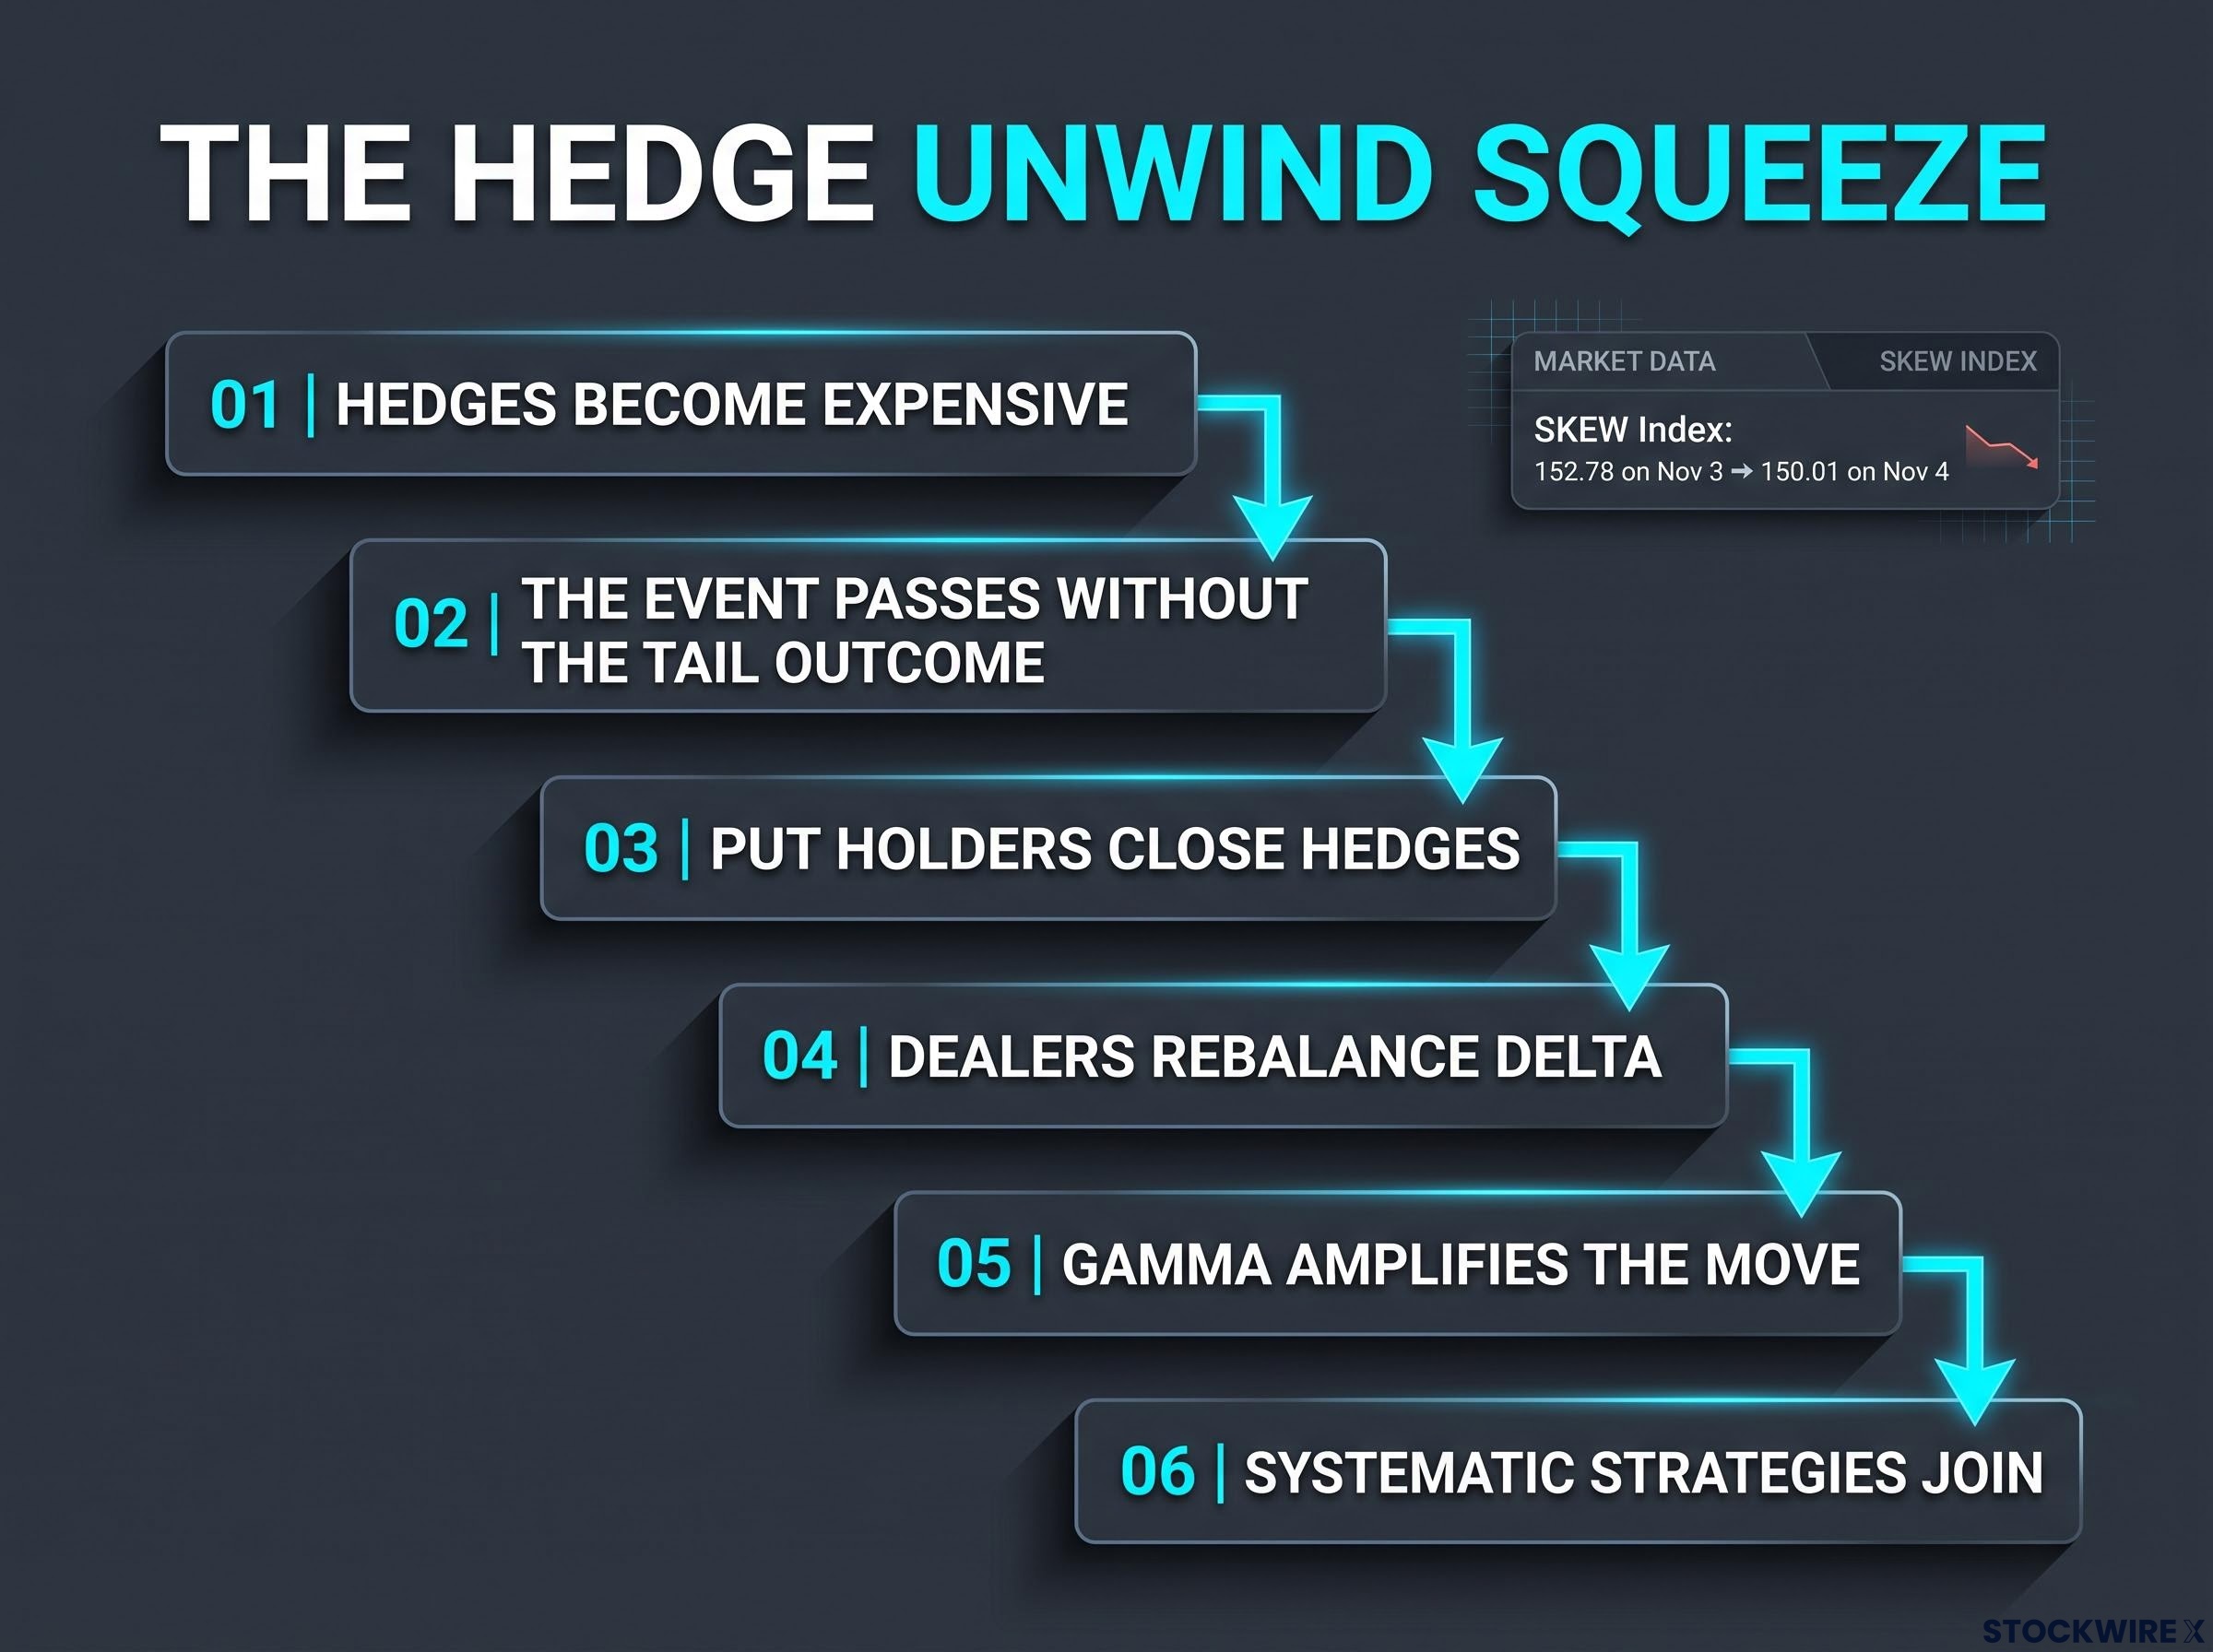
After the vote, SKEW sat at 150.01 on 4 November. That tells you tail protection had eased but not fully normalised.
Why dealers end up buying
Two terms matter here. Delta measures how much an option’s price moves for each move in the underlying stock or index. Gamma measures how quickly delta itself changes.
A short gamma regime changes how your market behaves: dealers must sell into declines and buy into rallies, and Goldman has documented top-of-book liquidity thinning sharply when dealers flip into that position.
Dealers who sell puts typically hedge by holding short stock or futures positions. Mott Capital Management argued the short-dated implied-volatility premium should collapse once the result was known, and that is the trigger for the following sequence:
- Hedges become expensive. Investors buy short-dated puts against a contested count, an adverse result or geopolitical escalation, pushing skew higher.
- The event passes without the tail outcome. The election-date volatility premium starts to decay.
- Put holders close hedges. They sell the puts, let them expire or roll into cheaper protection.
- Dealers rebalance delta. As the puts’ delta shrinks, dealers need less short exposure and buy back stock or futures.
- Gamma amplifies the move. Dealers who are short gamma must keep buying as prices rise, reinforcing the rally.
- Systematic strategies join. Volatility-targeting and risk-parity funds add equities as volatility falls, though a fresh volatility spike could reverse those flows.
Related commentary citing Nomura’s Alex Micalizzi warned that structured-note barriers could leave dealers short gamma, and that high gross but low net hedge-fund positioning forced unwinds. Both feed steps five and six.
The key point This rally can happen even if Fed pricing and expected earnings barely change. It is a repricing of insurance, followed by a reversal of hedging flows.
Because this buying is a one-off release of pent-up hedging rather than new conviction, you should expect it to fade once the unwind finishes, not to compound.
Is this pattern new? Fed meetings, 2020 and the limits of the comparison
You have likely seen a smaller version of this many times. Implied volatility tends to build into a Federal Reserve decision, then decay once the outcome lands close to expectations.
Elections are a bigger, messier version. They are harder to hedge because the outcome can shift fiscal, regulatory and geopolitical risk all at once.
The 2020 election offers the nearest precedent. CBOE documented an election-related bump in the VIX futures curve around 3 November 2020, and a CFA Institute review found forward implied volatility reached roughly 29% before reverting toward about 23% over the following three months.
| Event | Type of event | Hedging difficulty | Volatility behaviour |
|---|---|---|---|
| Fed meeting | Scheduled binary policy decision | Lower, narrow range of outcomes | Builds into decision, decays after an in-line result |
| 2020 election | Election amid pandemic and contested-result risk | High | Forward implied volatility near 29%, easing toward 23% over three months |
| 2026 midterms | Congressional election with fiscal and geopolitical stakes | High | VIX down about 20% on 4 November, SKEW still elevated |
The comparison is directional, not exact. 2020 carried unusually large pandemic, policy and contested-election risks. The original commentary behind this story judged near-term flows very positive absent tail events, while noting other significant flows still have to interact into year-end.
The pattern repeats around scheduled events, which tells you the volatility premium is a recurring feature of markets. But 2020 shows the reversion can take months rather than days.
Which flows could matter into year-end, and what could end the relief?
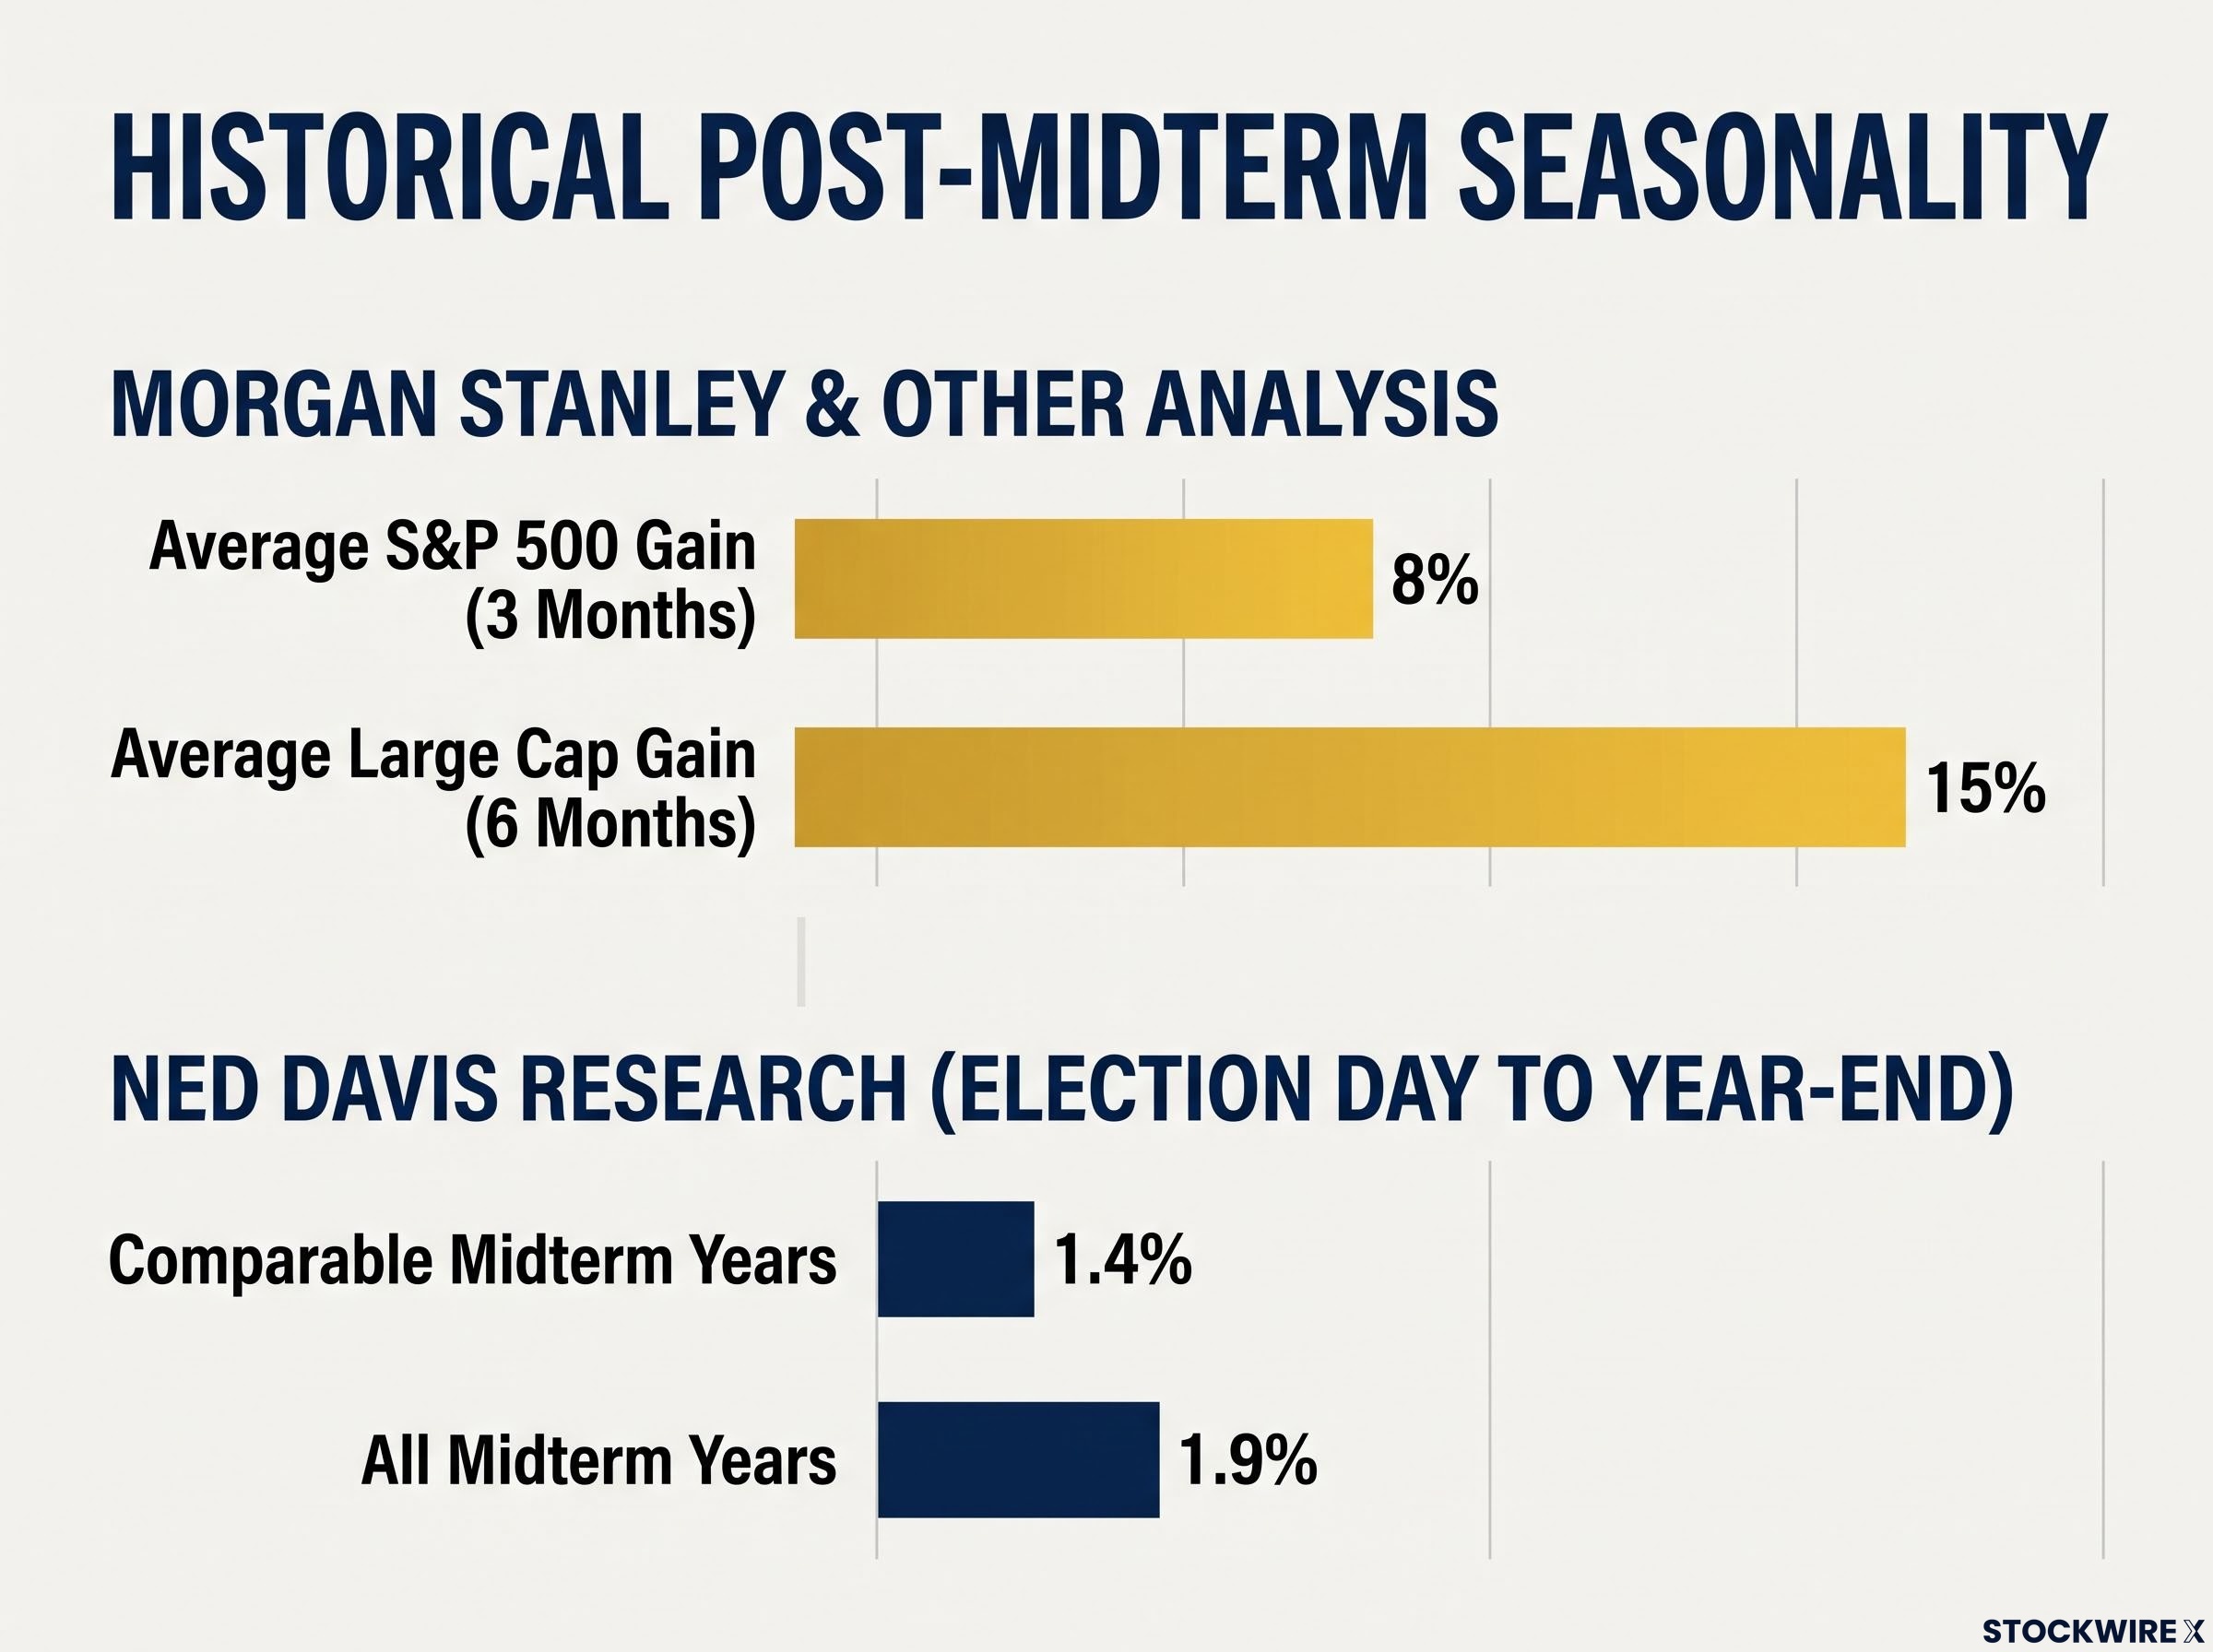
The seasonal record leans supportive. Morgan Stanley reported large caps have typically gained about 15% in the six months after midterm results, and another analysis cited average S&P 500 gains of 8% over three months and 15% over six. Past performance does not guarantee future results, and seasonal averages are subject to market conditions and various risk factors.
Post-midterm returns have been positive in all 17 periods since 1954 by LPL’s count, though evidence on gridlock is conflicting, so party control alone does not reliably predict what follows.
Ned Davis Research’s figures are more modest: a median 1.4% gain from Election Day to year-end in comparable midterm years, versus 1.9% across all post-Election Day midterm years. Ed Clissold warned a Democratic House could modestly temper the rally.
Flows to watch
The first post-election options expirations may drive further dealer unwinding. That support could reverse if investors roll protection into December or January.
| Flow | Direction of effect | Evidence status |
|---|---|---|
| Options expiry and hedge decay | Supportive, reverses if protection is rolled | Some evidence (SKEW 150.01 on 4 November) |
| CTA and volatility-control | Supportive while volatility falls | Mechanism documented, no 2026 aggregate estimate |
| Pension rebalancing | Could prompt equity selling after gains | Unquantified for 2026 |
| Buybacks | Supportive outside blackout windows | Unquantified for 2026 |
| Tax-loss selling | Pressure on recent losers | Unquantified for 2026 |
| Seasonality | Historically supportive | Morgan Stanley and Ned Davis data |
CTAs (commodity trading advisers) are trend-following funds that add exposure as prices rise steadily. Be clear-eyed about the gaps: pension, buyback and tax-loss flows have no quantified 2026 estimate.
Risks that outlast the election
Election hedges expire. These risks do not:
- Iran and Middle East tensions, which remain live after the vote.
- AI valuation and capital-spending concerns, flagged by both Morgan Stanley and Goldman.
- Restrictive rates, with a December hike still heavily priced.
- Divided-government gridlock, including possible tougher Democratic oversight of AI, though Goldman judged a national data-centre moratorium unlikely, according to CNBC.
Morgan Stanley’s Mike Wilson described the correction as in its “final innings” but warned AI spending and tightening liquidity could trigger another temporary decline. Goldman’s Christian Mueller-Glissmann stays overweight equities over three and 12 months yet recommends extra cash for three months, and Seema Shah of Principal Asset Management expects volatility to continue.
When structurally bullish strategists still advise holding some cash, treat the post-unwind period as a return to fundamentals, not an all-clear.
Reading the next move: what the hedge unwind does and does not tell you
The best-supported explanation for the 4 November surge is event-risk relief plus the reversal of expensive hedges and dealer short positions. Divided government may matter over the medium term, but it does not explain a one-day jump of this size.
That gives you a way to read what comes next without guessing. Watch three signposts:
- SKEW and the VIX. Continued declines suggest the unwind still has room; a rebound suggests protection is being rebuilt.
- Fed funds futures. A genuine shift in December or 2027 hike odds would mark a real macro repricing.
- AI and Iran headlines. Either could reignite volatility and reverse systematic buying.
If the first moves while the second stays flat, you are still watching flows, not fundamentals.
This article is for informational purposes only and should not be considered financial advice. Investors should conduct their own research and consult with financial professionals before making investment decisions.