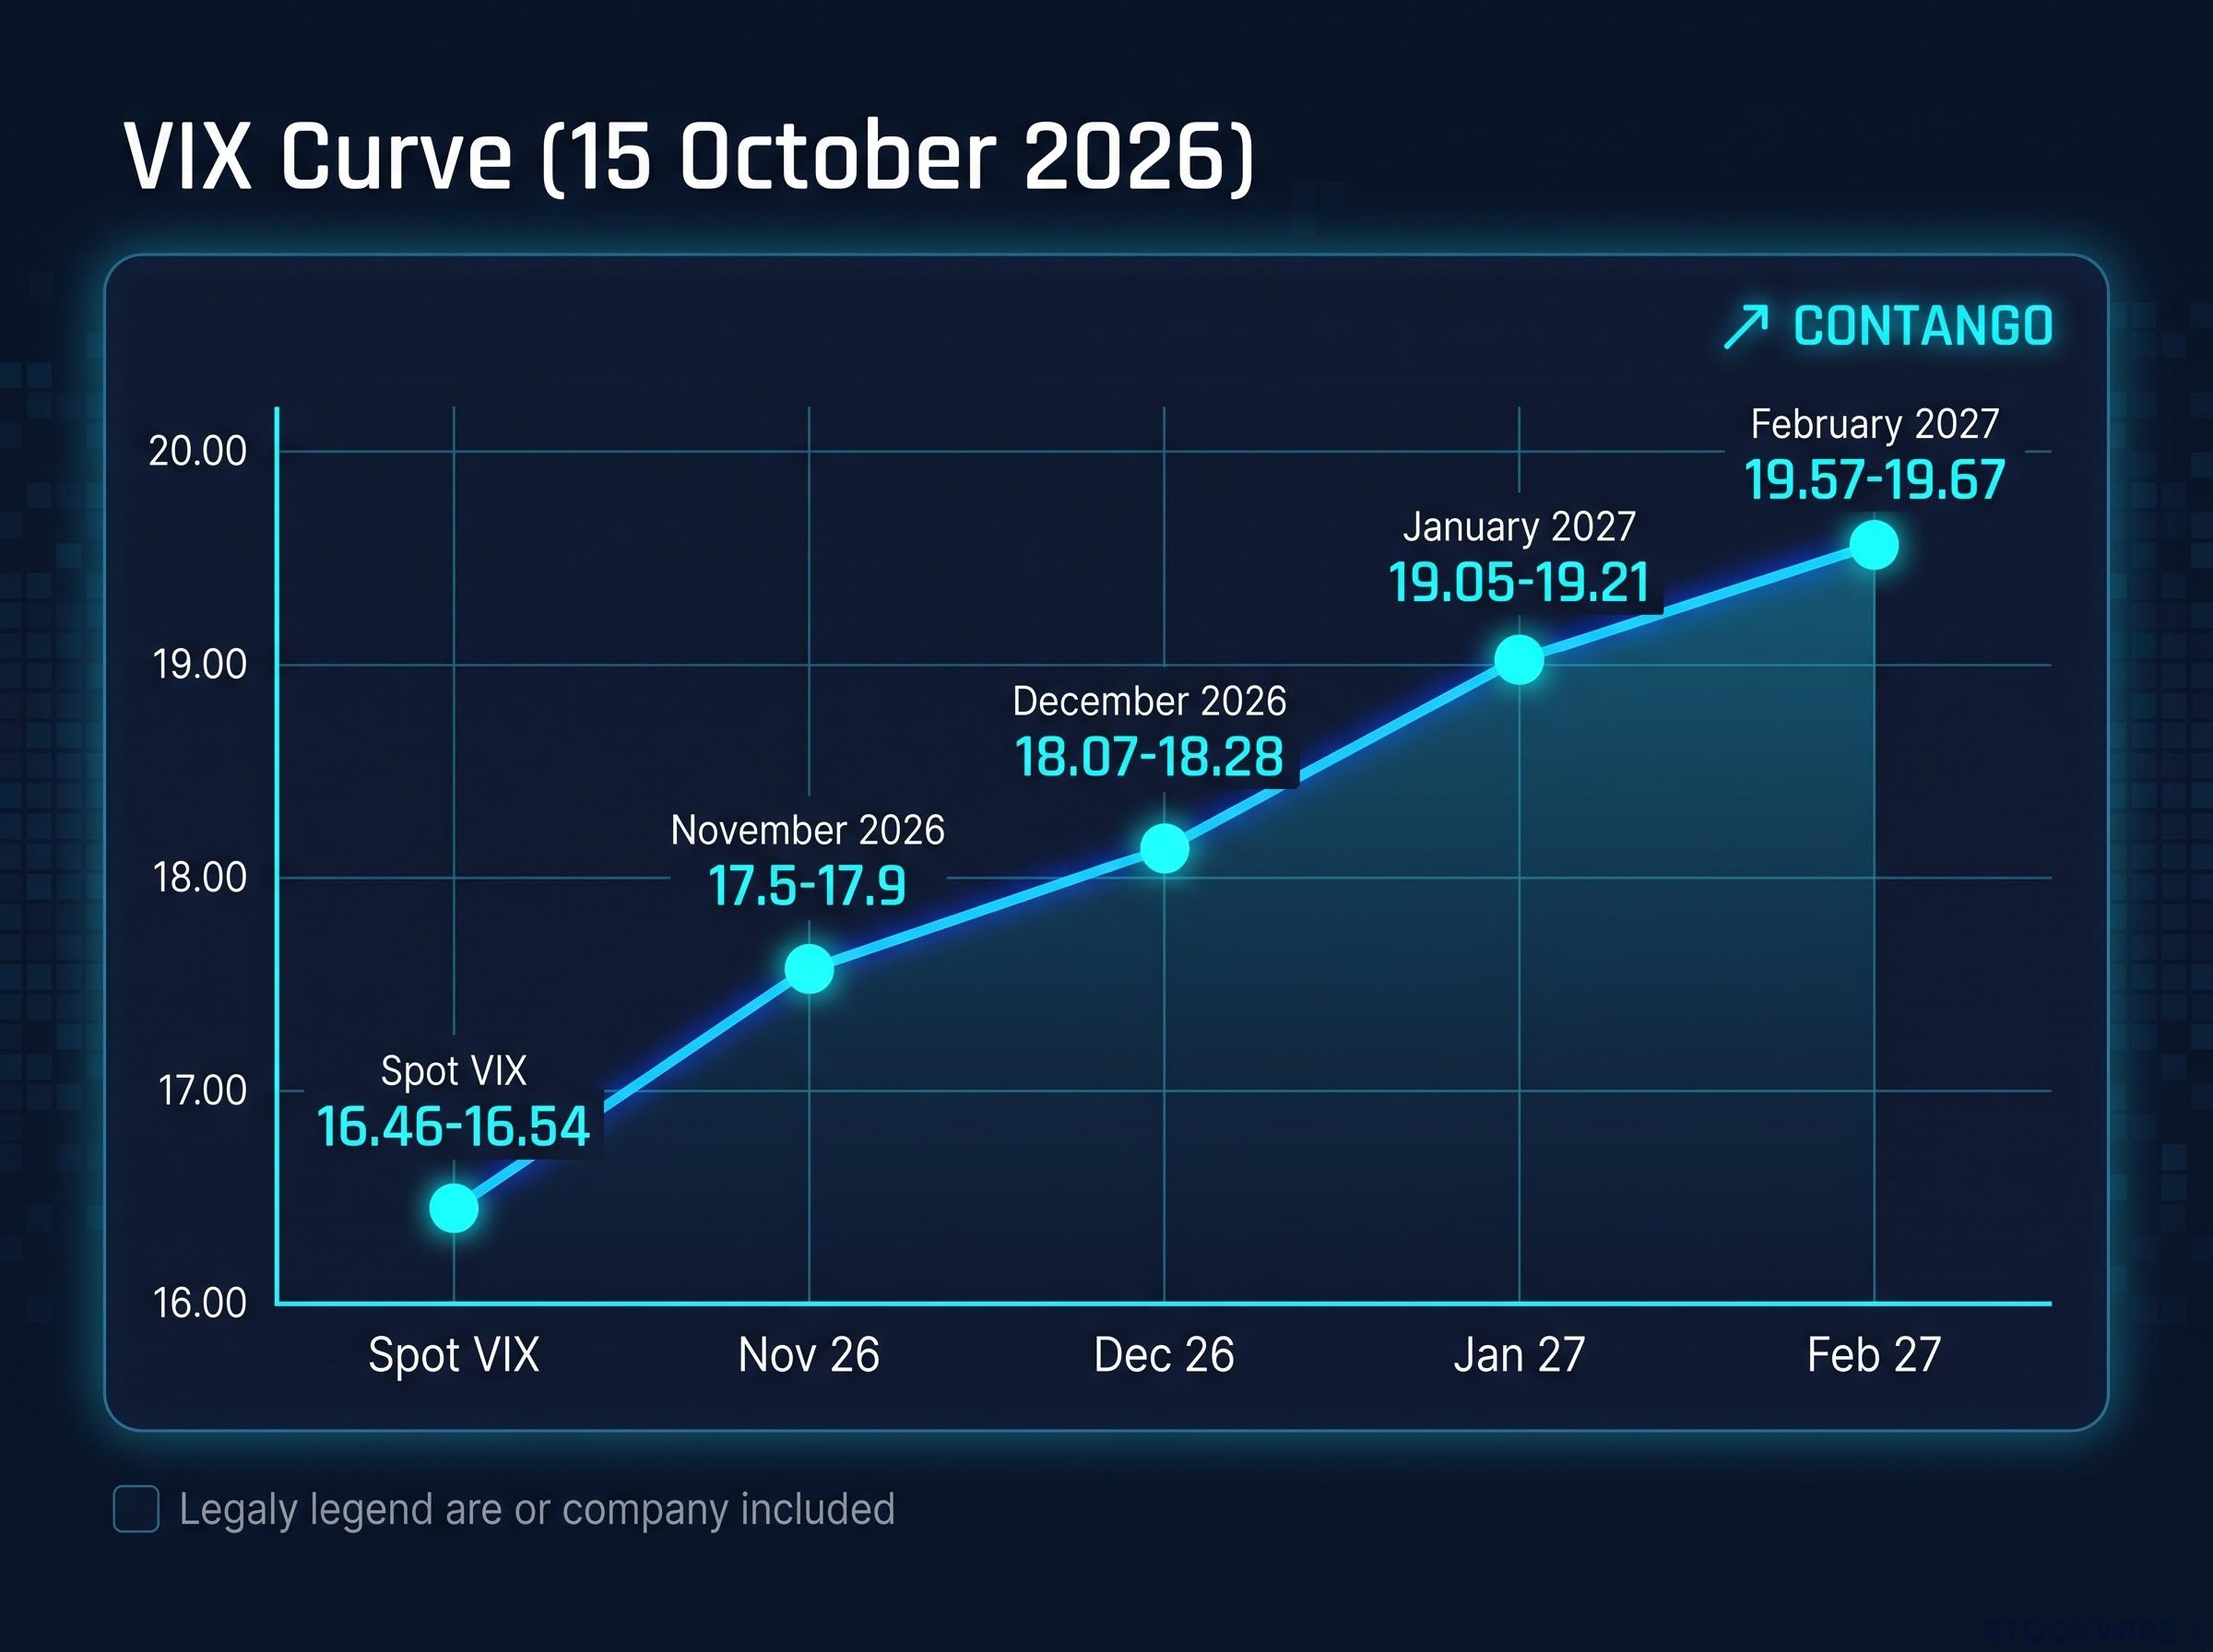
On the 15 October 2026 VIX futures curve, the December through February contracts sit between roughly 18.1 and 19.7, above a November contract trading near 17.5-17.9. Later-dated volatility is the pricier part of the curve, yet it may still be the better value once the vote is behind the market. Many traders are likely to misread one signal in particular: a falling spot VIX after 3 November may not mean political risk has gone.
The midterms land inside a crowded stretch of the calendar. The Federal Open Market Committee (FOMC) meets on 27-28 October, peak tech earnings run through late October, and recounts or certification disputes could follow the election itself.
Strategists disagree on what is priced. Michael Purves of Tallbacken Capital Advisors sees no midterm premium on the curve, while Charlie McElligott of Nomura points to tail hedges that have become expensive.
Here is a framework for reading the curve around the election and for judging whether the exposure has simply moved to later months. That distinction sits at the centre of midterm volatility trading this year.
Why a falling spot VIX after November 3 can be misleading
Picture the screen on 5 November. The VIX has dropped, headlines call it relief, and the instinct is to assume political risk has cleared. That conclusion may be wrong for a mechanical reason.
The VIX is an index that measures the stock market’s expected volatility for the S&P 500 over roughly the next 30 days. It is calculated from the prices of S&P 500 options. When traders pay more for options, the VIX rises. When they pay less, it falls.
Here is where the curve stood yesterday.
| Contract | Approximate level (15 October 2026) |
|---|---|
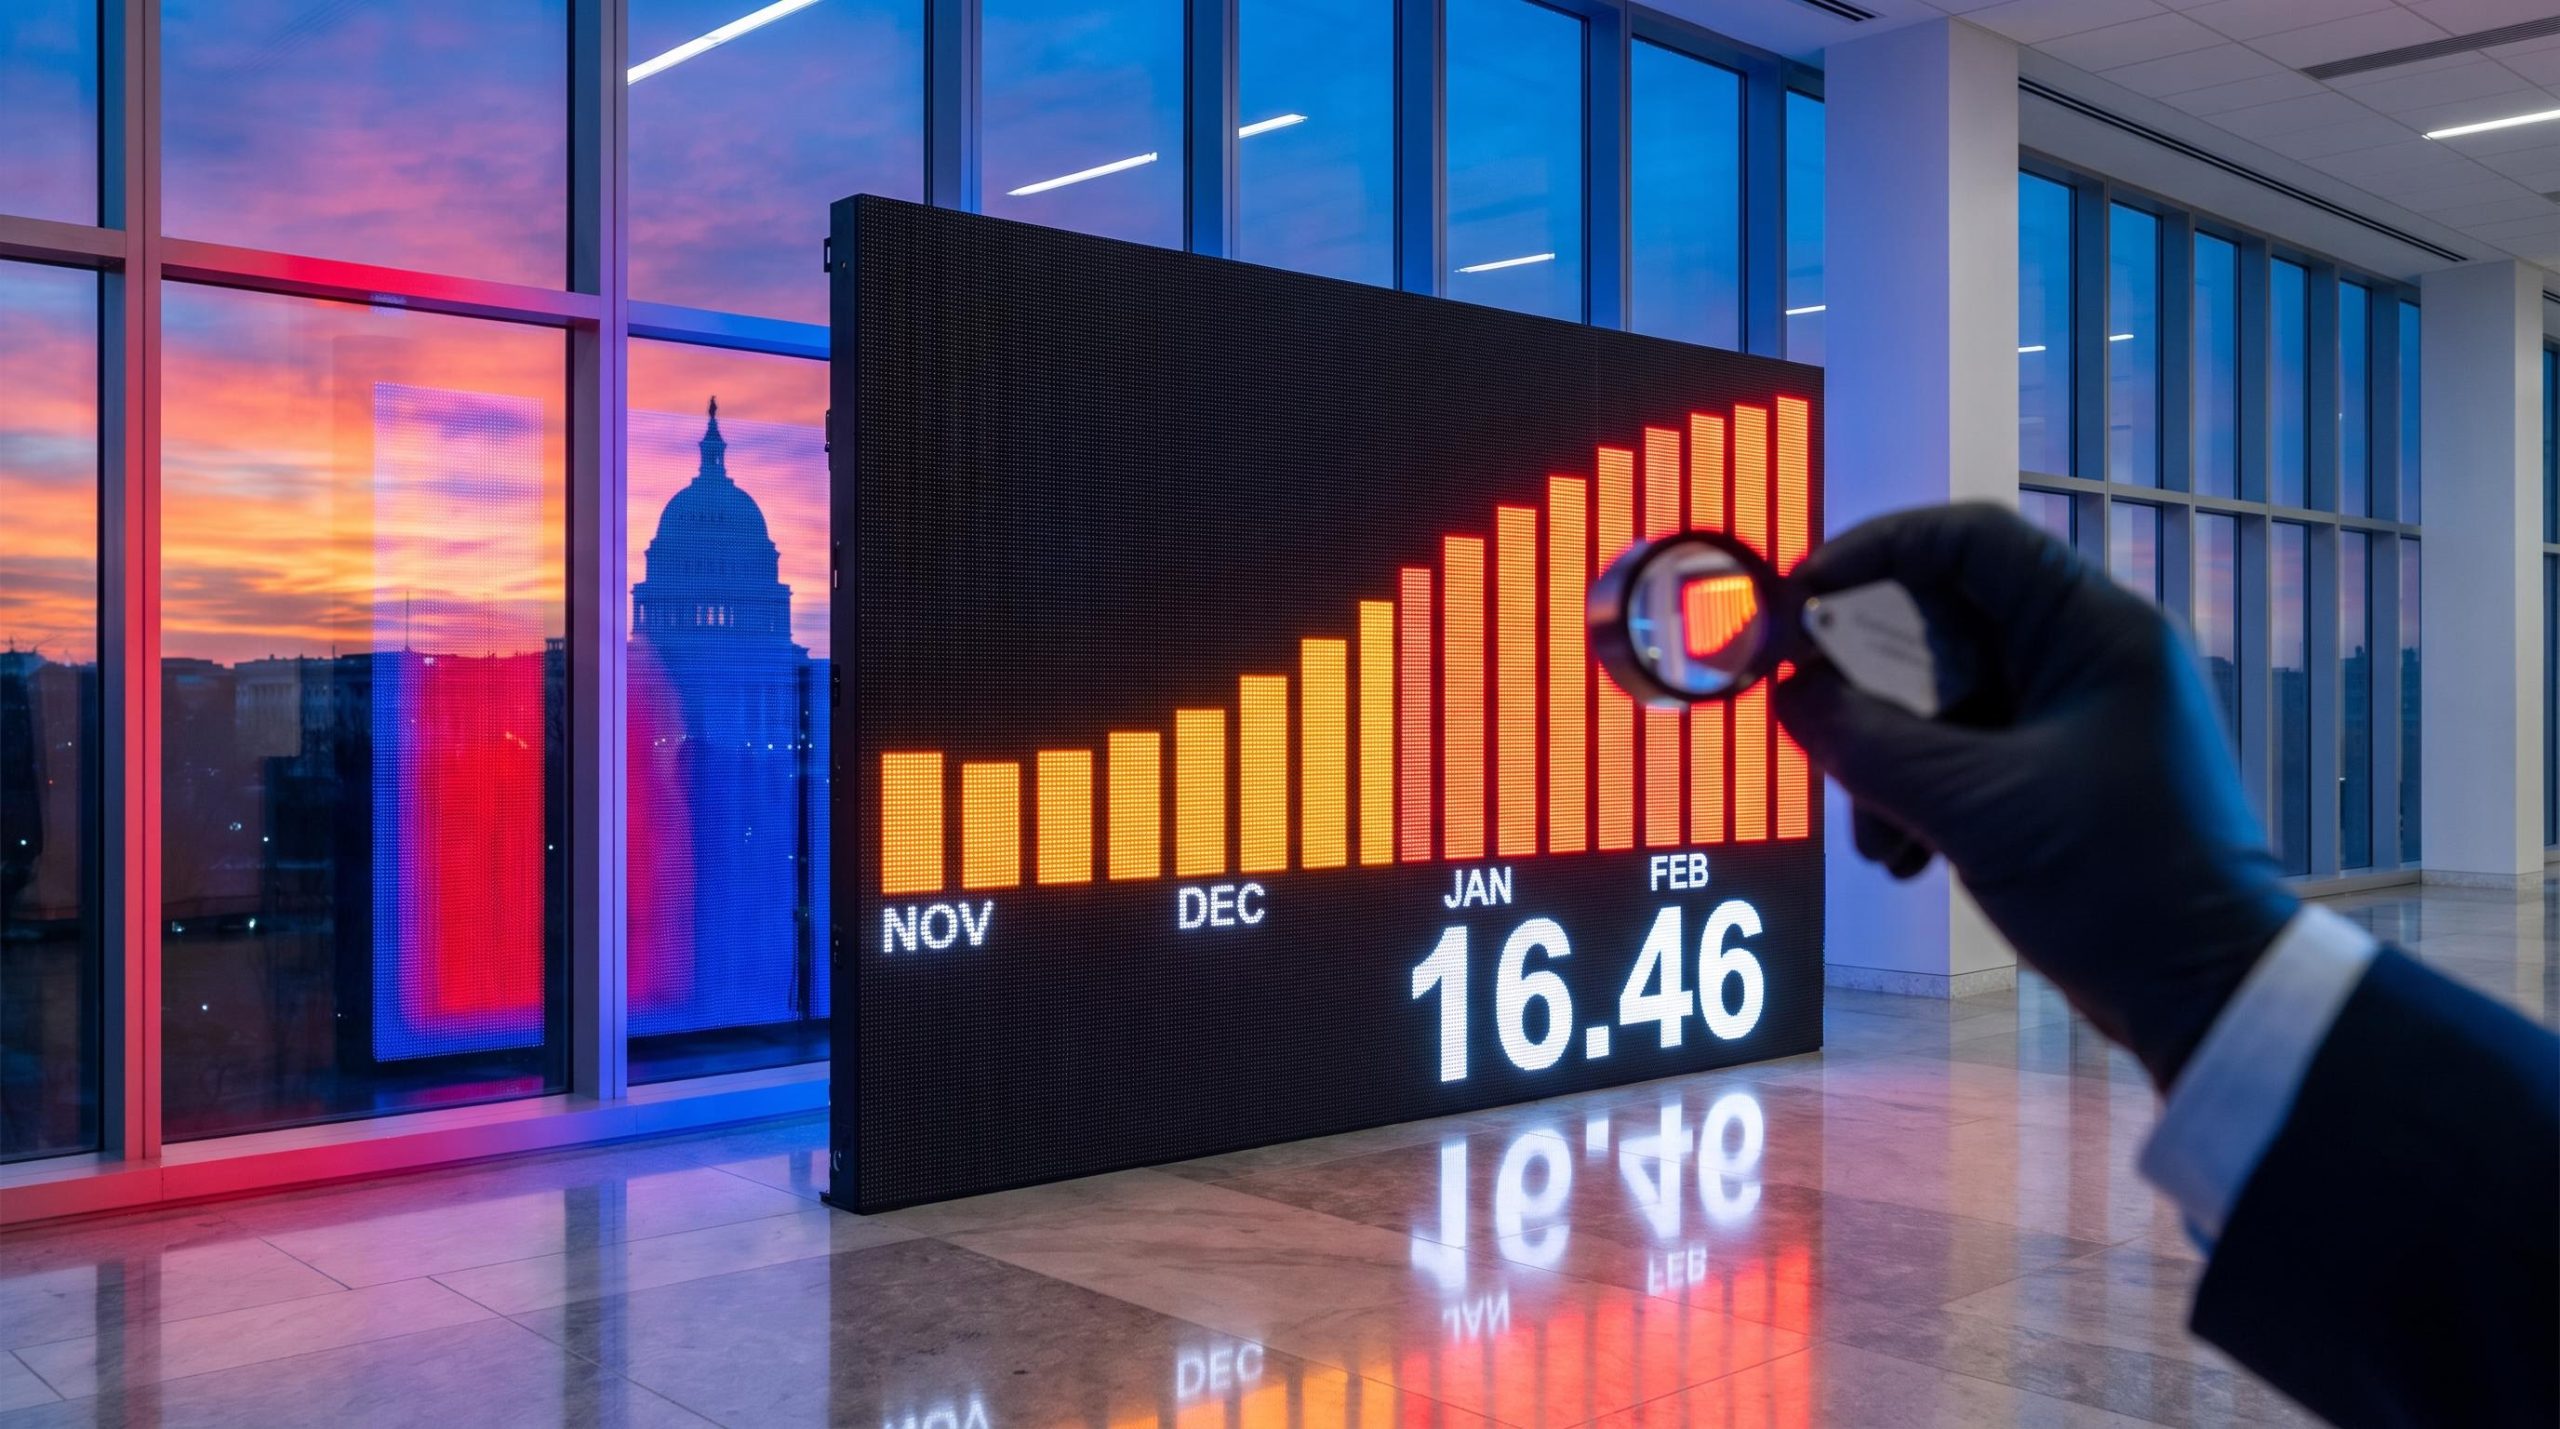
| Spot VIX | 16.46-16.54 |
| November 2026 future | 17.5-17.9 |
| December 2026 future | 18.07-18.28 |
| January 2027 future | 19.05-19.21 |
| February 2027 future | 19.57-19.67 |
Sources conflicted on the November and December levels. One Cboe-based reading showed 16.85 and 17.78 respectively. Every reading, however, showed contango, which means later-dated futures were priced above nearer ones.
Contango is the structural default, not a signal of stress: VIX futures sit above spot most of the time because spot VIX cannot be bought directly, which is why a premium in December-February contracts is not unusual on its own.
How the 30-day window rolls past the event
Just before 3 November, the 30-day window contains Election Day. Once the vote passes, the window drops that election-sensitive day and adds a later, potentially calmer one at the far end.
Spot VIX can therefore fall even if nothing has been resolved. Realised volatility can stay unchanged, December-February options can stay expensive, and the uncertainty can simply shift to certification and litigation.
History shows the familiar shape. The VIX tends to rise into Election Day and ease afterwards, although the Federal Reserve Bank of St. Louis found the post-midterm decline is usually smaller than after presidential elections. SIFMA found November VIX was higher than October in 57% of the election periods it examined, and Cboe identified an “election bump” in the 2020 term structure from as early as 12 June 2020.
A lower VIX on 5 November may tell you only that a known event left the window. Before concluding risk has faded, check where December-February futures are trading.
When big ASX news breaks, our subscribers know first
Is the market pricing the midterms, or ignoring them?
The roll-off mechanic explains why the spot print can mislead. It does not settle whether the curve is pricing the election at all, and here the two most quoted strategists part ways.
Michael Purves, Tallbacken Capital Advisors The VIX curve is “not expressing any premium for midterm elections.”
McElligott reads the same market differently:
- Purves (Tallbacken): The curve shows no meaningful midterm premium. The date is known, and the outcome may not move the aggregate index much.
- McElligott (Nomura): Three-month VIX-call skew has reached the 91st percentile. Call skew measures how much more traders pay for options that profit from a VIX spike than for comparable options. He links that demand to a “negative risk trinity” of election, rates, Treasury supply and geopolitical risks.
Both may be right about different parts of the curve. In August, data showed a clearer election bump, with September near 17.4, October near 19.0 and November near 19.7, though these figures have not been independently confirmed. That premium has since compressed, while the demand for upside VIX protection has persisted.
A cheap-looking headline premium alongside expensive upside-VIX skew tells you the market is hedging an extreme tail, not paying for two-sided movement. If you plan to fade November premium, you are joining a view Purves has already articulated, not taking a contrarian one.
A similar gap between headline calm and underlying tail-risk demand has appeared in other recent readings, where elevated skew sat alongside a mid-teens VIX and suggested hedgers were paying for protection the spot index did not show.
Other commentary leans calmer still, though none of it has been verified. James Ooi of Tiger Brokers has cited a roughly 4% November VIX decline after midterms. Citadel Securities commentary suggested mid-October could offer a more constructive setup, and one report put one-month S&P implied volatility near 12, against a midterm norm of about 19-20.
The relief-rally counter-argument
The early-November-to-year-end stretch was generally positive after the 1994, 1998, 2006, 2010 and 2014 midterms. That record supports a compression view.
A rally after resolution does not remove the risk of a delayed count before it, however. The timing of resolution is the open question.
How long could a contested result really last?
If uncertainty does outlive election night, the calendar shows how far it can run. Jim Carson, whose show commentary framed this thesis, argued that Democrats appear more likely to win and that markets are underappreciating a possible contested outcome. He stressed this was not a political view, and the timeline below holds regardless of which party prevails.
Delay is plausible for structural reasons. Several states count mail ballots postmarked by Election Day that arrive later, and the Associated Press reported multiple lawsuits and federal court orders over federal mail-ballot restrictions before the vote.
Here is how the dates accumulate (some deadlines unverified, as noted):
- 12 November: Pennsylvania recount order due. Recounts there are automatic if the statewide margin is 0.5% or less.
- 17 November: Florida certification.
- 21 November: New Jersey recount-application deadline (unverified).
- 23 November: Arizona certification.
- 24 November: Pennsylvania recount completion due.
- 4 December: Ohio certification deadline, at the latest.
Key-state certification broadly runs from roughly 17 to 30 November (unverified), with recount-dependent processes possibly reaching early December. On Carson’s show, one host said recounts and certification typically cluster around the week before Thanksgiving. California and mail-heavy races may take until mid-November or later.
Even a normal process leaves live political risk into late November. That is precisely when November options have already expired.
What 2000, 2020 and 2022 show
Past cycles give you the range of outcomes.
| Precedent | What happened | Volatility implication |
|---|---|---|
| 2000 presidential | Florida recount and litigation left the result unresolved | Usual post-election VIX decline failed |
| 2020 presidential | Mail counting and litigation delayed recognition; Georgia ran recount reviews | Risk persisted well past election night |
| Georgia 2020 to January 2021 | Prolonged certification and legal process, then two Senate runoffs | Uncertainty staged across multiple dates |
| 2022 midterms | Faster resolution | VIX below 23 by the Thursday and Friday after Election Day |
The St. Louis Fed lists 2000, 2008 and 2012 as exceptions to the usual post-election decline. Speakers on the show cautioned that any timeline assumes normal certification and court behaviour, and 2020 showed the process can stretch into January.
Positioning around a crowded calendar: short before, long after?
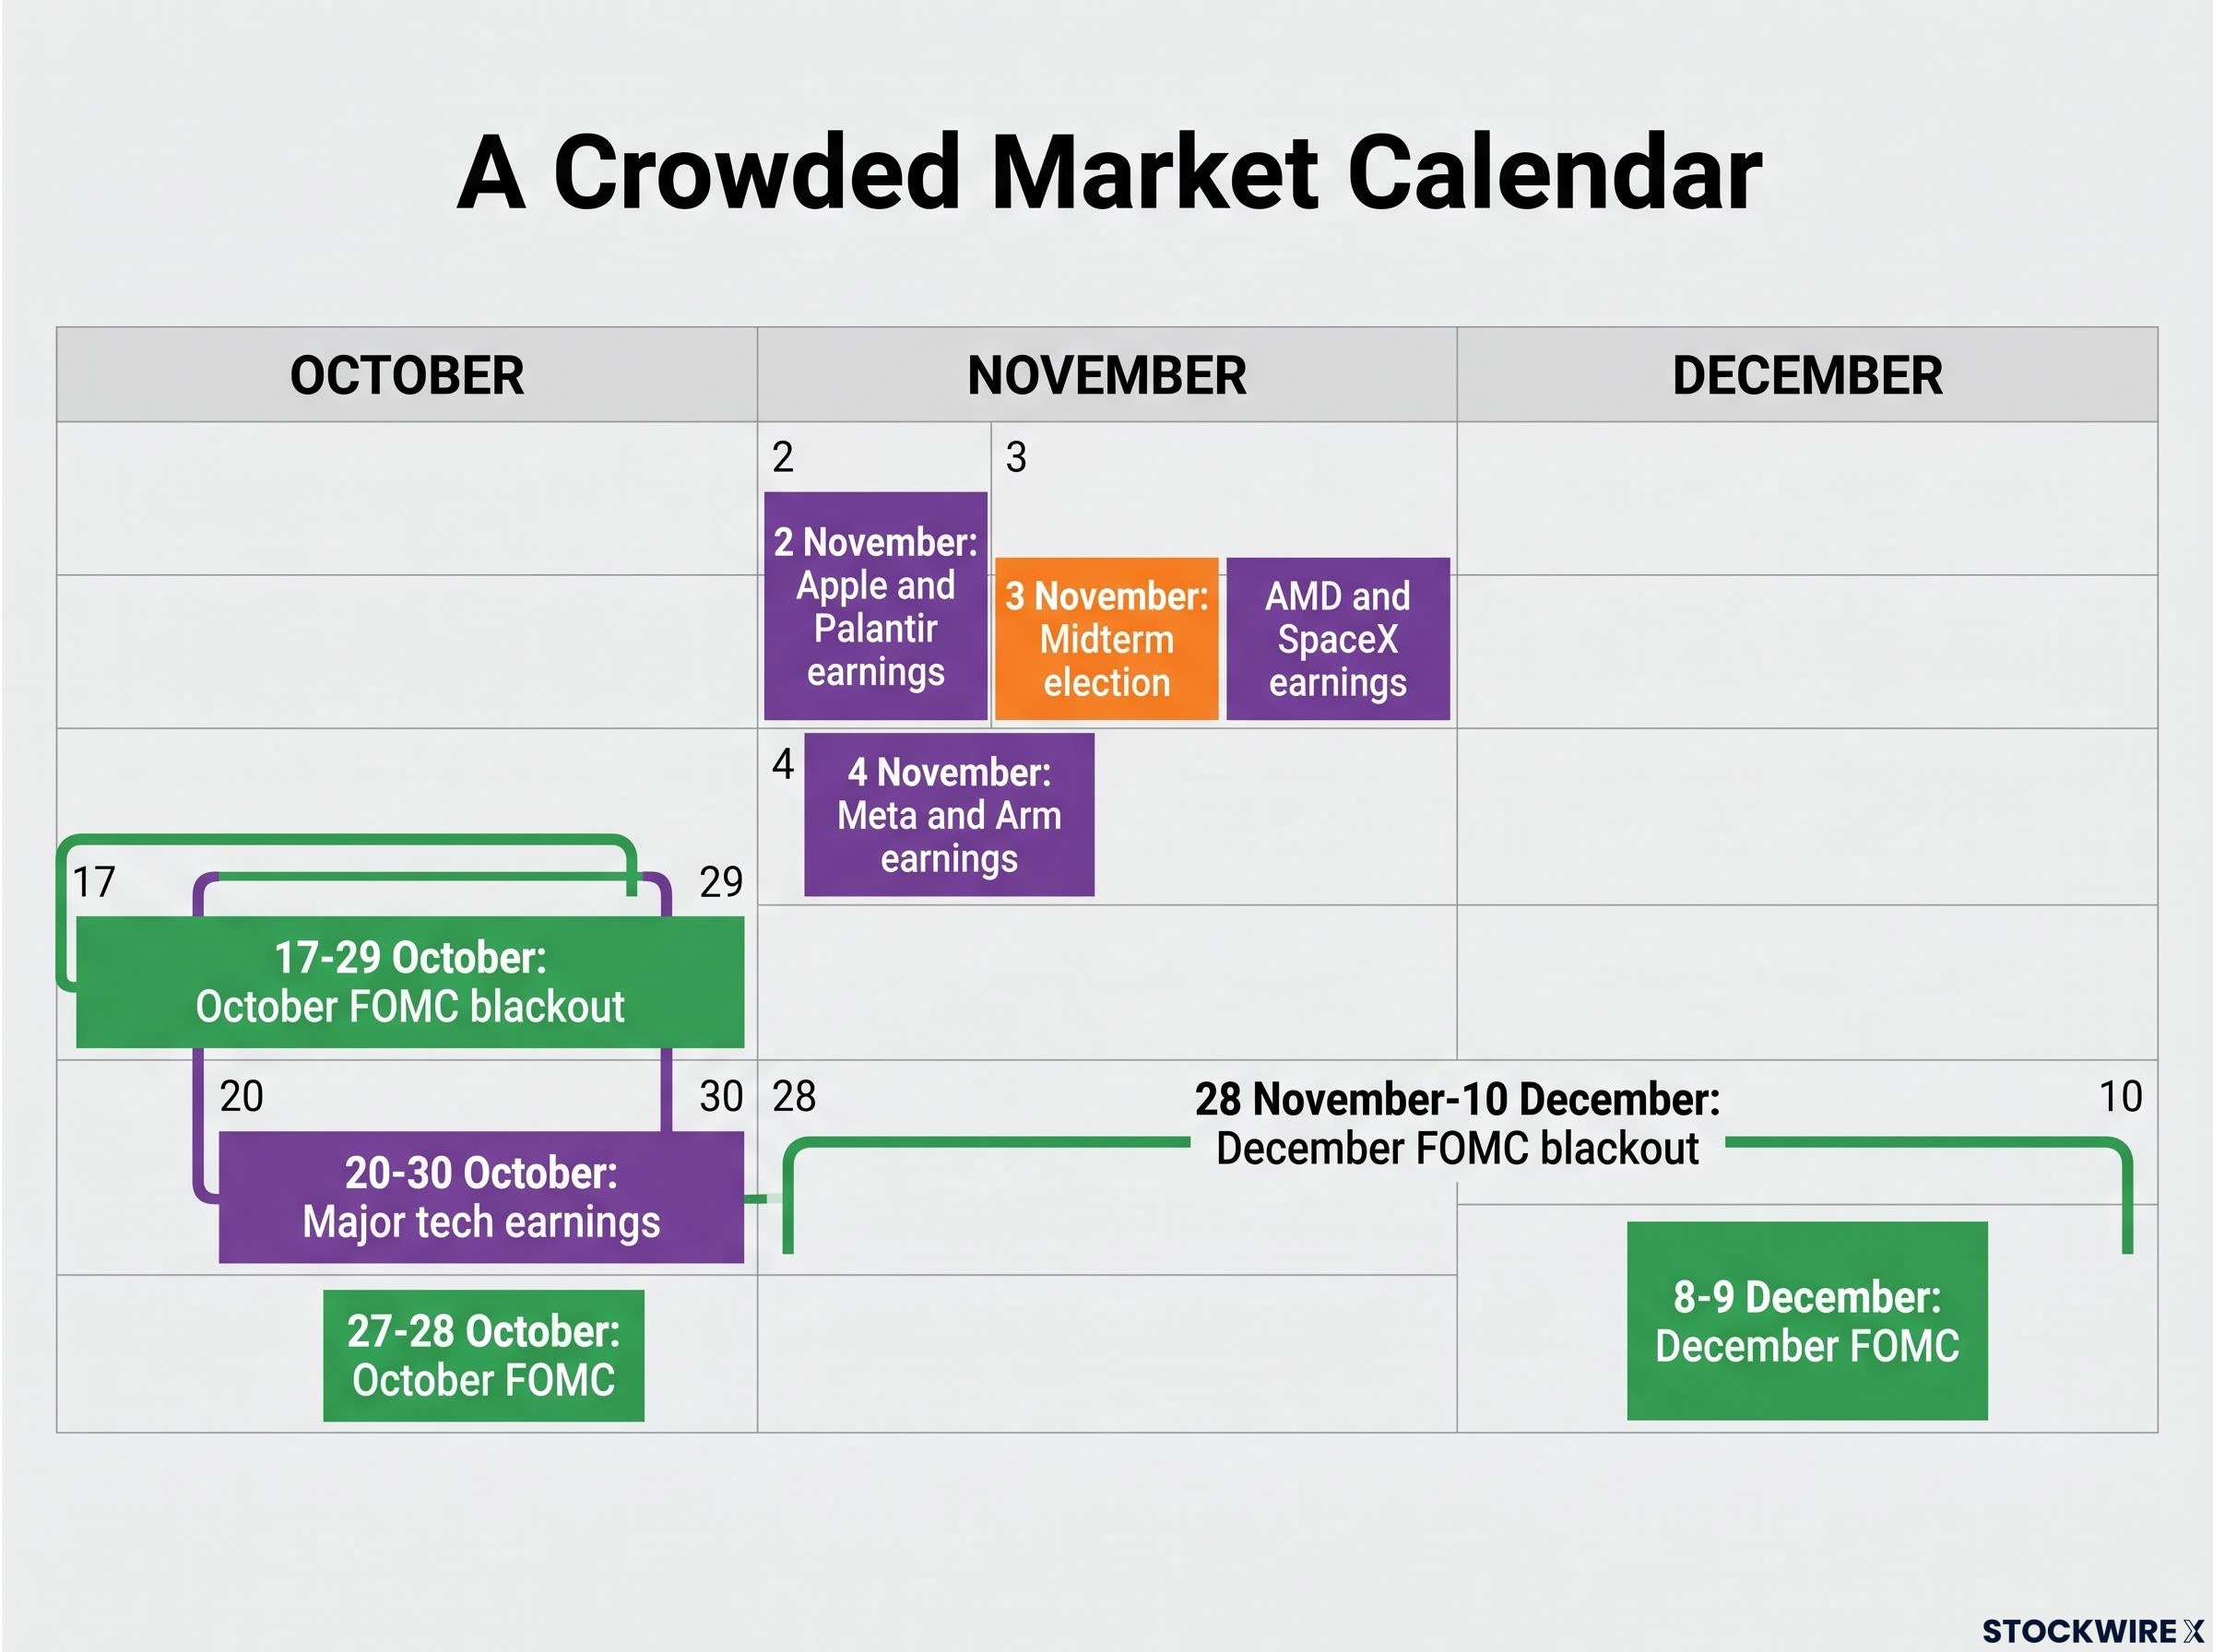
The certification dates sit on top of a calendar that is already full. Here are the overlapping catalysts.
| Event | Date |
|---|---|
| October FOMC blackout | 17-29 October |
| Major tech earnings concentrated (unverified) | 20-30 October |
| October FOMC | 27-28 October |
| Apple and Palantir earnings (unverified) | 2 November |
| Midterm election; AMD and SpaceX earnings (unverified) | 3 November |
| Meta and Arm earnings (unverified) | 4 November |
| December FOMC blackout | 28 November-10 December |
| December FOMC | 8-9 December |
The blackout is the period when Fed officials refrain from public comment before a meeting. The December blackout overlaps the window in which recounts or litigation could still be live.
Against that backdrop, the relative-value logic traders are weighing has two legs and one weak point:
- Short before: Fading an expensive November event premium can work if the result is quickly clear and realised volatility stays below what options implied.
- Long after: Holding December-February exposure can pay off if the result is delayed, contested or litigated, since those contracts retain exposure after November expires.
- Key risk: A rapid, large index move or a contested count could lift November implied volatility sharply before anything resolves.
One point needs to be clear. On 15 October, December-February futures were not cheaper in outright level than November. The case rests on relative value against delay risk, and Purves’s reasoning (a known date, a modest likely index impact) is what supports the short leg. This is analysis of how traders are framing the curve, not a recommendation.
Where the short-before leg can fail
The setup breaks if stress arrives before the count does. With earnings, the Fed and the vote landing within days of each other, a sharp index move could inflate November volatility for reasons unrelated to the election.
Dealer hedging flows can suppress measured volatility ahead of a major event and then release it once positions expire, a mechanical effect that may sharpen any move in November contracts around the vote.
The real bet is on the timing of resolution. A stacked calendar can make a clean read of the election signal impossible, which argues for smaller sizing on the short leg and careful expiry selection on the long one.
Past performance does not guarantee future results. These statements are speculative and subject to change based on market developments.
What a quiet VIX after November 3 does and does not tell you
A mechanically lower spot VIX is not proof that political risk has vanished. It may only mean Election Day has rolled out of a 30-day window.
The unresolved question is the one Purves and McElligott frame from opposite ends: is the market correctly calm, or quietly hedging a tail it will not price openly?
Rather than the spot print, watch the signals that carry information:
- December-February futures relative to November
- State certification dates from 17 November onward
- Pennsylvania’s 0.5% recount trigger
- Mail-ballot litigation
If those stay quiet, the drop was real relief. If they do not, the risk has moved down the curve.
Investors exploring how to express the long-after leg will find our dedicated guide to VIX calls versus SPX puts, which explains why roll cost makes the choice of hedge matter.
This article is for informational purposes only and should not be considered financial advice. Investors should conduct their own research and consult with financial professionals before making investment decisions.