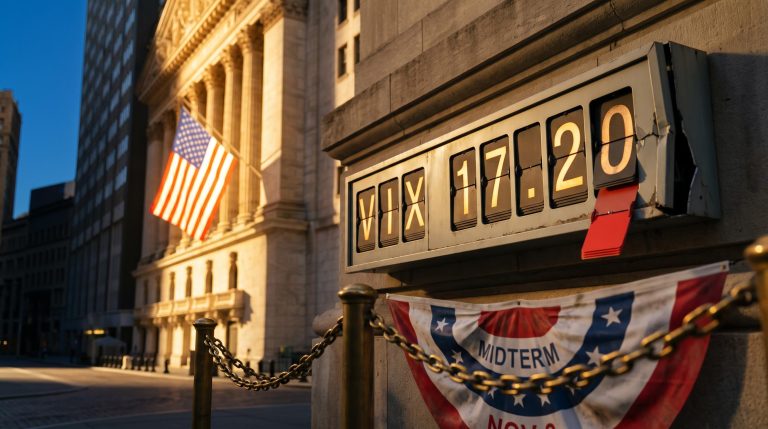
A 9% fall in the Nasdaq looks like a discount. Forty years of data suggest it is closer to a coin with a modest tilt, and which way it tilts depends on what caused the fall. After the 29-30 October selloff, the Nasdaq-100 sits roughly 10% below its peak, which makes buying the Nasdaq dip a live question rather than a theoretical one.
The damage came fast. The Nasdaq Composite dropped 3.7% on 29 October, its worst day since June. The Nasdaq-100 followed with a 3.5% slide on 30 October, its deepest decline since early June.
The triggers were specific. Amazon held its 2026 capital spending near $220 billion while free cash flow swung to about -$42.4 billion. Intel then fell more than 30% in a single session, its largest one-day drop on record. The question for you is whether this is an ordinary correction or the first leg of something longer.
You will come away able to separate crisis declines from routine ones and see the historical odds attached to each. You will also see how one trader turned those odds into a position with a capped loss.
What do 40 years of 9% Nasdaq 100 pullbacks actually show?
How the study was built
The study tracked Nasdaq 100 daily closes from January 1986. A signal fired whenever the index closed at least 9% below its highest close of the previous 20 trading days. That gap from a recent high is called a drawdown, which simply means the percentage fall from a peak.
Signals clustered within 20 days of each other were grouped into one episode so the same selloff was not counted twice. That left 100 distinct episodes through 15 October, spanning 1987, the dotcom collapse, the financial crisis, COVID and 2022.
| Horizon | Average return | Win rate |
|---|---|---|
| 1 week (5 days) | 0.89% | 58% |
| 1 month (21 days) | 0.89% | 59% |
| 3 months (63 days) | 3.58% (median 7.71%) | About 60% |
What the averages hide
The headline sounds reassuring: the index has usually been higher three months later. Look closer and the comfort fades. The median three-month gain of 7.71% sits well above the 3.58% average, because a handful of severe losses drag the mean down.
A win rate near 60% means roughly four in ten dips kept hurting. That makes buying a 9% Nasdaq dip a modest-edge bet rather than a reliable bargain, and you should size any position with that in mind.
Path risk adds another layer. The index can finish higher after three months yet inflict deep losses along the way, which can force you out of leveraged, futures or option positions before any recovery arrives.
The depth of the fall matters too. An earlier study of 6% drawdowns showed roughly a 74% three-month win rate and gains near 6%. The two studies are not directly comparable, but deeper pullbacks appear to lower both average returns and the odds of a gain.
When big ASX news breaks, our subscribers know first
Why does separating crisis from non-crisis corrections change the picture?
A correction is usually defined as a fall of around 10% or more from a recent high. The study went further and sorted each signal by whether it occurred during a broader crisis. That label was applied with hindsight, producing 59 crisis signals and 41 non-crisis signals.
Sorting declines by cause rather than size is the logic behind the cause-first test, which treats a sentiment-driven correction and a fundamentals-driven bear market as different events even when the percentage fall looks identical.
Put the two groups side by side and the blended average starts to look misleading.
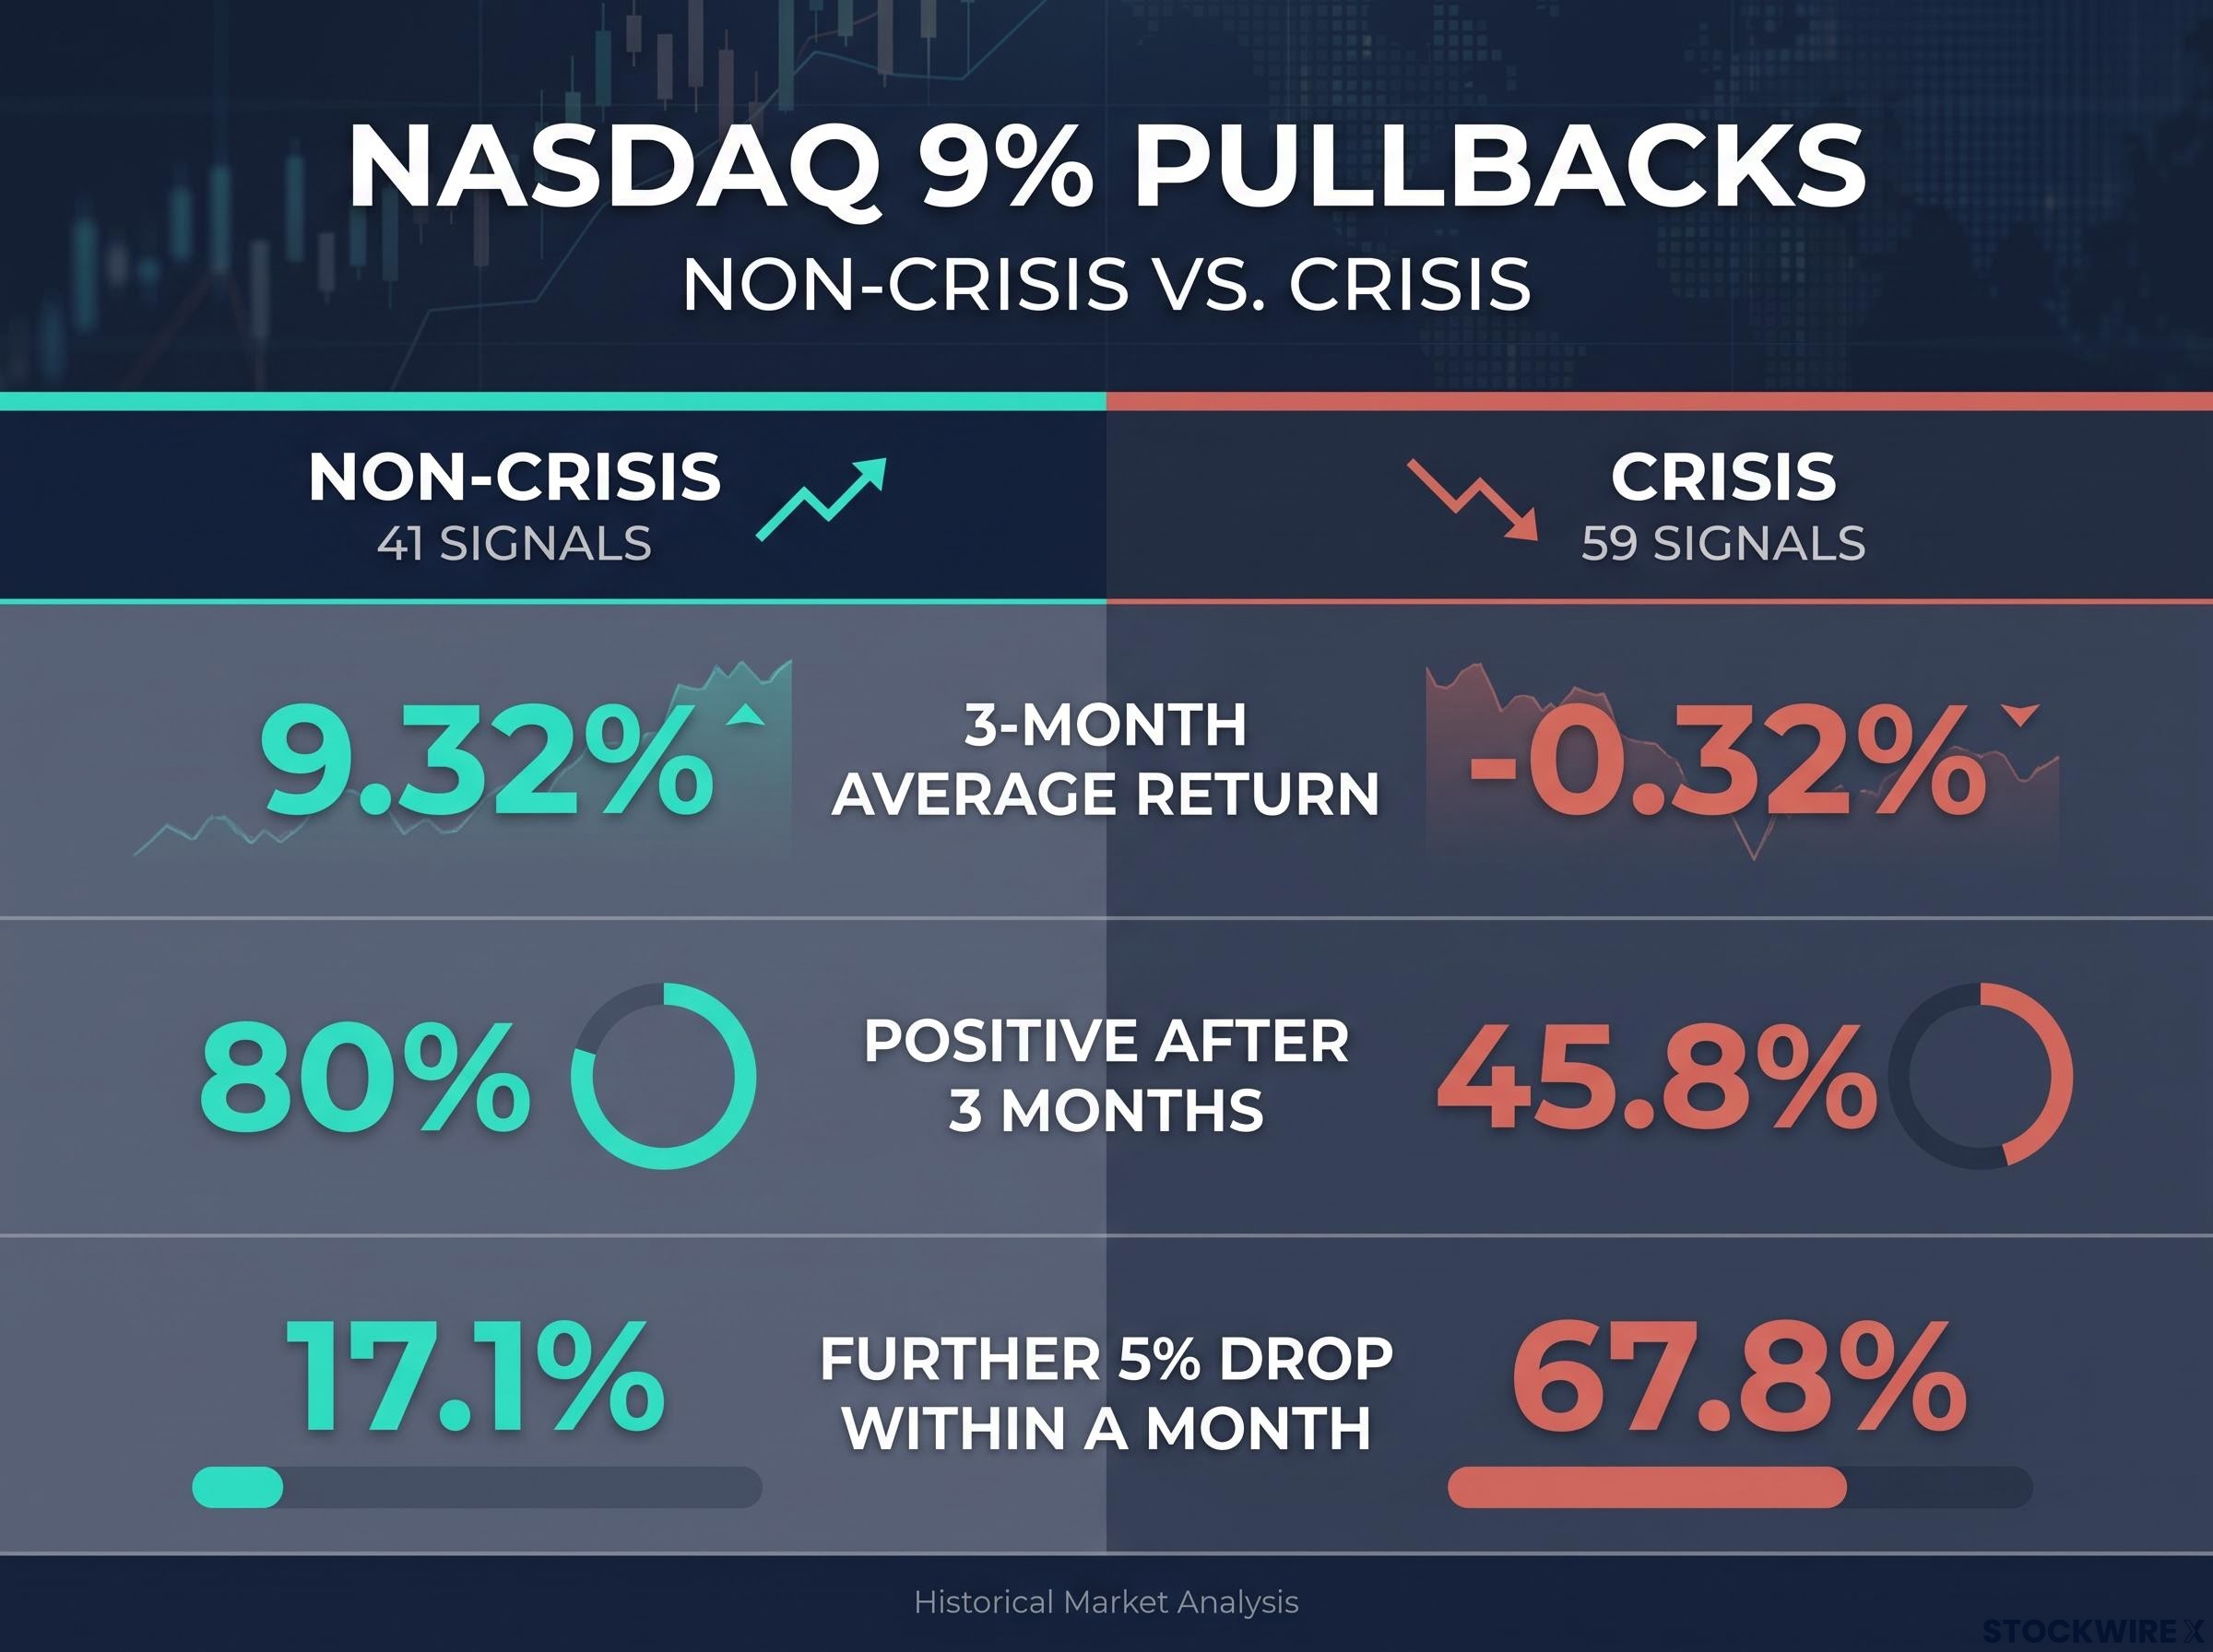
| Measure | Non-crisis | Crisis |
|---|---|---|
| 1-week average | 3.03% | -0.59% |
| 1-month average | 4.7% | -1.75% |
| 3-month average | 9.32% | -0.32% |
| Positive after 3 months | 80% | 45.8% |
| Further 5% drop within a month | 17.1% | 67.8% |
Outside crises, a dip has been a strong buying signal. Inside them, it has been close to a losing trade, with fewer than half of signals in profit after three months.
The 3.58% average is not describing a typical outcome. It is an average of two very different distributions that rarely produce anything near it.
The further-drop figures make that gap practical. Across all 100 episodes, 47% saw another 5% decline within a month, a total drawdown of about 13.6% from the high.
The path-risk gap In crisis episodes, 67.8% suffered a further 5% fall within a month. Outside crises, only 17.1% did.
The mix of signals has also shifted. The earlier 6% study’s 128 observations were mostly non-crisis (90 versus 38), while this deeper threshold catches mostly crisis-related signals.
So the question that sets your odds is not how far the index has fallen. It is what kind of decline this is, and that answer has been worth about 10 percentage points over three months. The catch is that the label is only certain afterwards.
How did the dotcom bust, 2008, COVID, 1998 and 2022 each play out?
Slow grinds: 2000, 2008 and 2022
The dotcom bust produced 26 episodes with an average three-month return of -6.3%. A signal on 31 December 2000 was followed by a 38.2% fall over three months, and an April 2002 signal preceded a loss above 29%. With valuations extreme and many firms unprofitable, the Composite fell about 78% from March 2000 to October 2002 and did not regain its peak until about 2014 on a dividend-adjusted basis.
The financial crisis delivered nine episodes averaging -2.92% over three months. Financial-system stress meant a signal on 4 September 2008 saw a further 17% drop after one month and more than 34% after three.
In 2022, rising interest rates cut the present value of distant profits for growth stocks. The eight episodes averaged -1.58%, and the Nasdaq-100 fell about 35.6% over 13 months before taking roughly another year to recover.
Fast rebounds: 1998 and COVID
The 1998 Russia and Long-Term Capital Management (LTCM) episode saw leveraged positions spill through credit markets until Federal Reserve rate cuts calmed things. Its three episodes averaged a 32.6% three-month gain.
COVID was a sudden liquidation met with rapid monetary and fiscal support. A 25 February 2020 signal lost 15.5% over the next month yet finished 6.3% higher after three months, while a late-March signal gained 33%. The Nasdaq-100 fell about 28.6% and regained its peak in roughly 81 days.
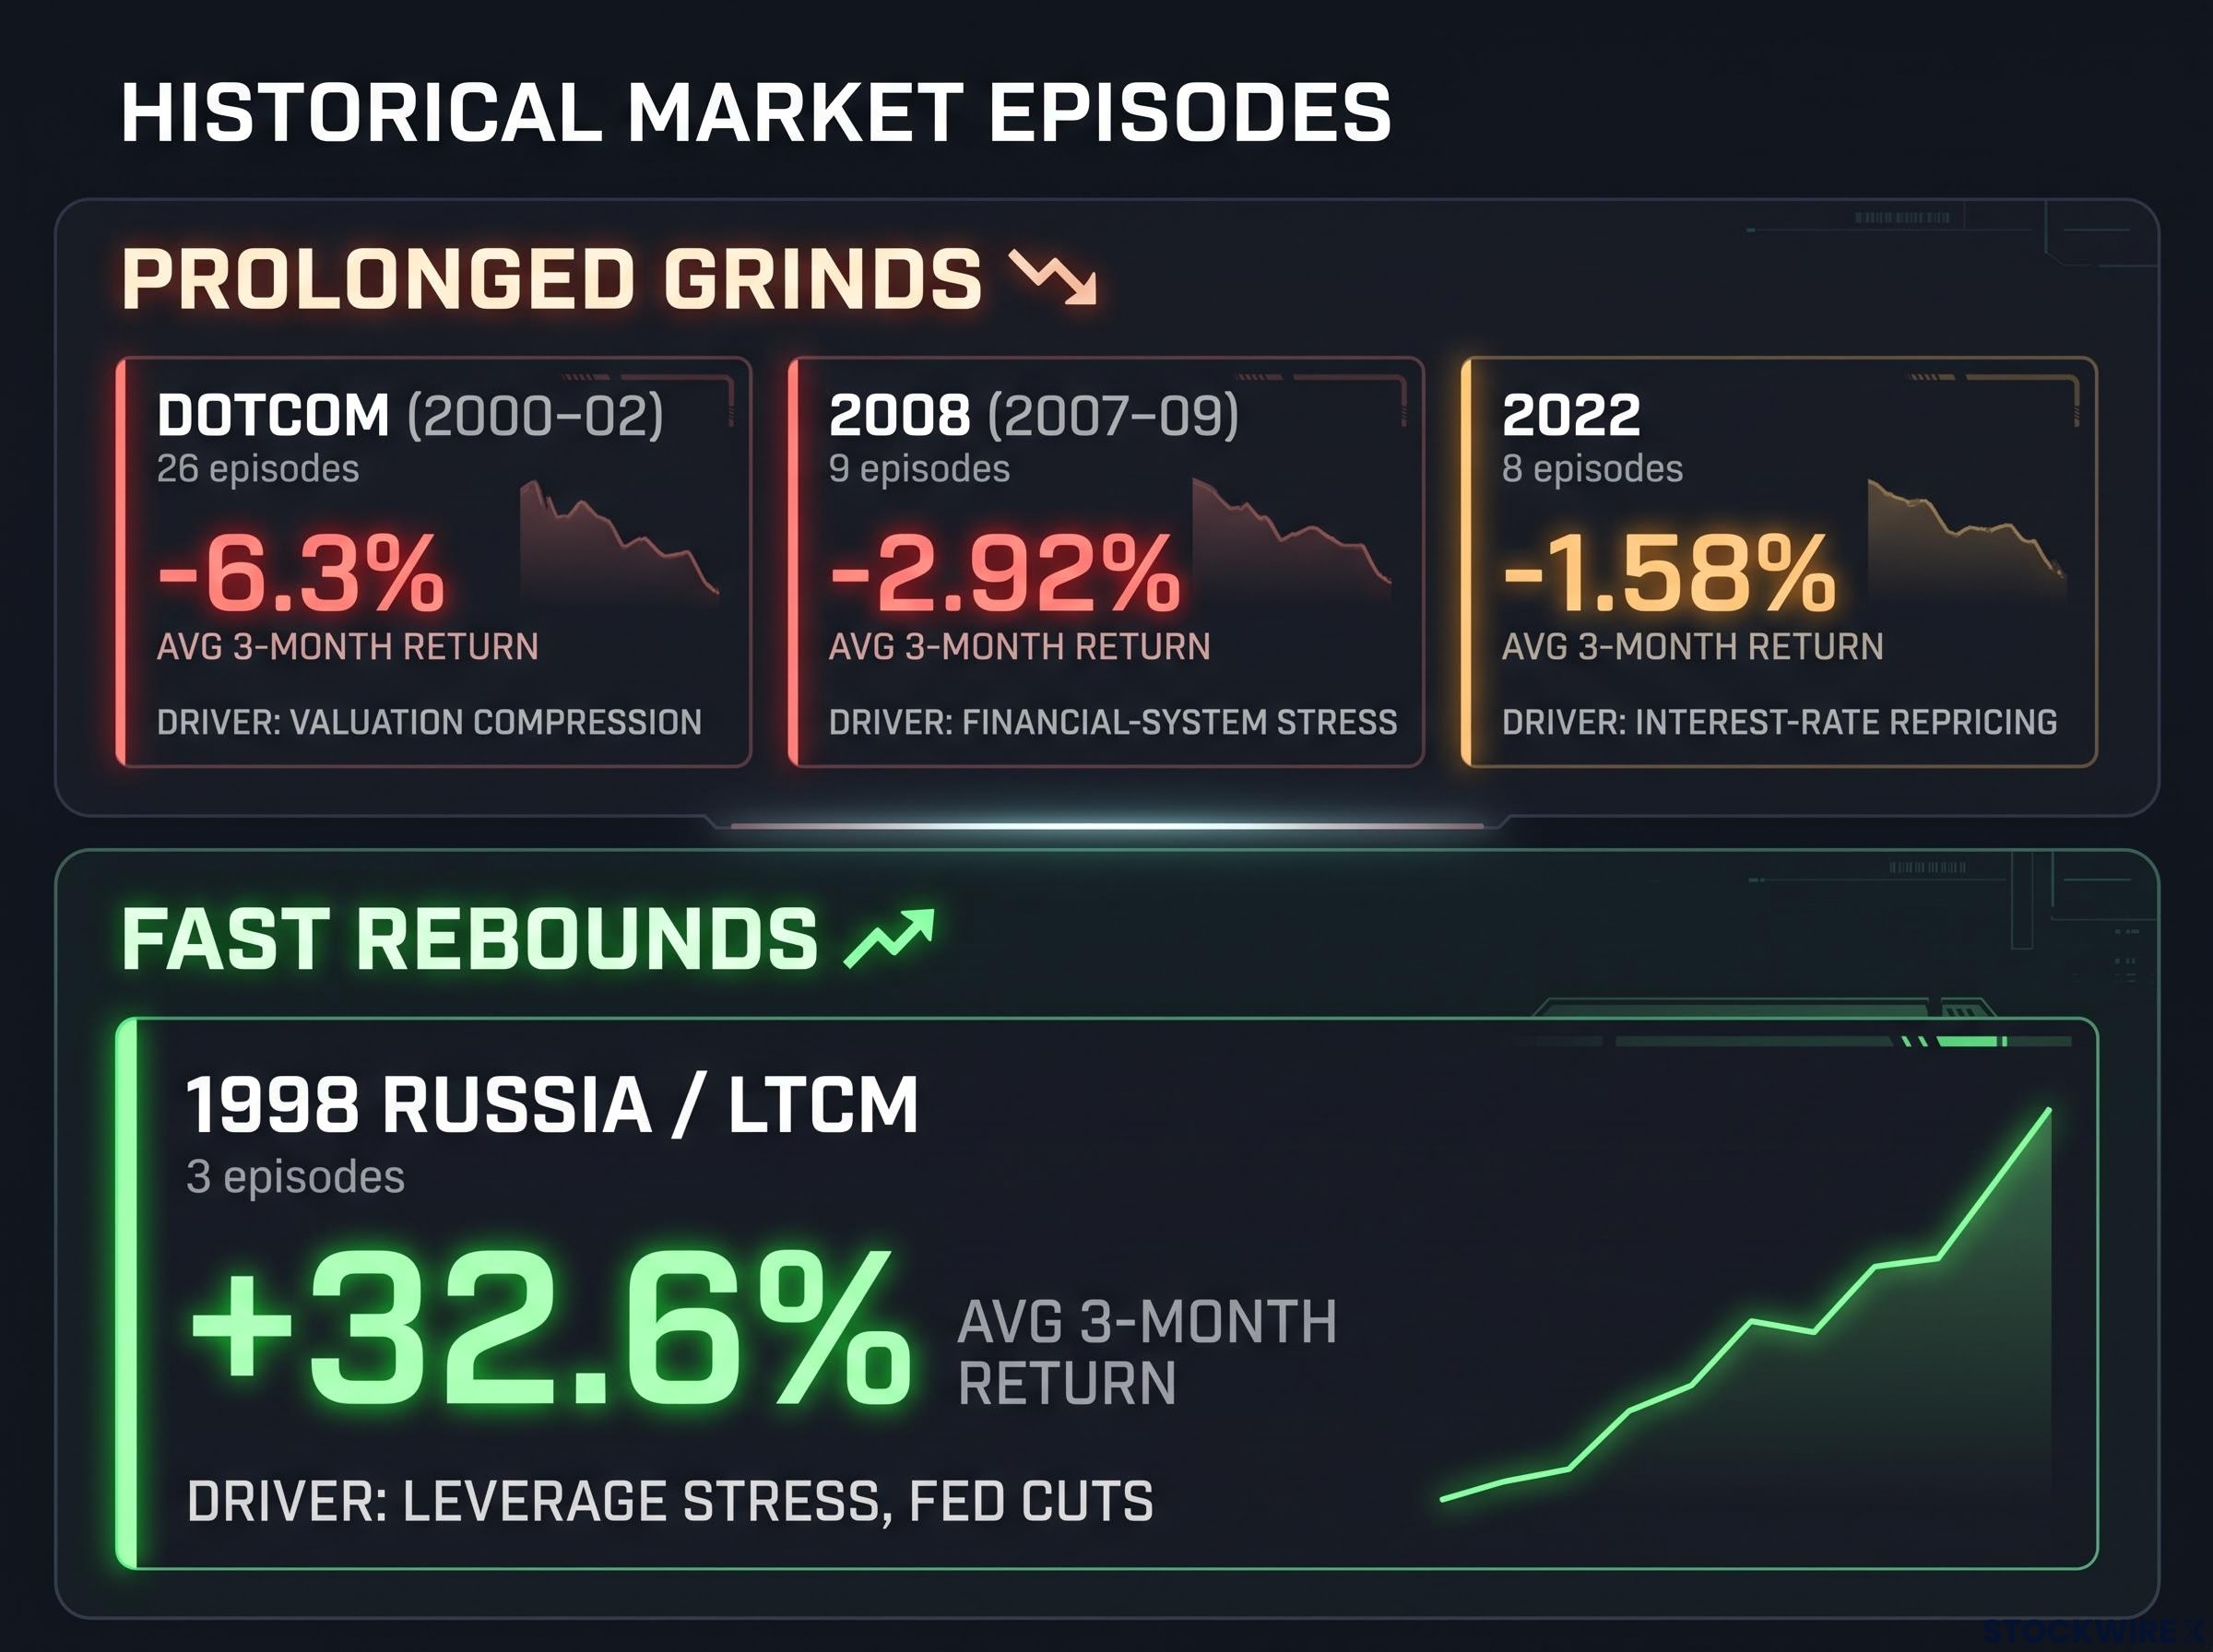
| Episode | Episodes in study | Avg 3-month return | Driver | Outcome type |
|---|---|---|---|---|
| Dotcom (2000-02) | 26 | -6.3% | Valuation compression | Prolonged grind |
| 2008 (2007-09) | 9 | -2.92% | Financial-system stress | Prolonged grind |
| 2022 | 8 | -1.58% | Interest-rate repricing | Prolonged grind |
| 1998 Russia/LTCM | 3 | +32.6% | Leverage stress, Fed cuts | Fast rebound |
| COVID (2020) | Not specified | Varied by signal | Liquidity shock, policy support | Fast rebound |
The pattern is plain once laid out. Liquidity problems reverse when funding returns, but earnings and valuation problems take years to repair. The same 9% signal marked the bottom in 1998 and 2020 and the start of years of pain in 2000, so you cannot read it without knowing what is driving the fall.
How can you tell a crisis from a correction in real time?
Three tests
Since the crisis label only arrives with hindsight, you need live indicators. Three questions do most of the work:
- Credit markets: Are borrowing spreads widening broadly across banks, households and investment-grade companies, or mainly among leveraged AI and data-centre borrowers?
- Liquidity: Are Treasury, funding and dealer markets working normally, or are forced selling, margin calls and financing shortages appearing?
- Earnings revisions: Are analysts cutting forecasts across the economy, or only for companies tied to one spending cycle?
Where today’s selloff sits
Credit is flashing amber. CoreWeave‘s 2032 bonds entered distressed territory, and its credit default swaps (insurance contracts that pay out if a borrower defaults) briefly cost more than 1,000 basis points, according to Reuters on 16 October. The cost of insuring US technology debt against default hit record levels, especially for data-centre operators.
CoreWeave bond stress shows the pattern clearly: its 2032 notes slipped below 78 cents on the dollar and yielded about 14.8% while the equity lagged, a reminder that credit often signals trouble before share prices do.
On 30 October, Reuters reported concern spreading from equities into credit. Yet the original commentator observed that high-yield bond funds JNK and HYG, which slipped again after a Monday-Tuesday recovery, were not near the levels seen a few weeks earlier. Current reporting shows no broad funding seizure like 2008.
The big banks are split. UBS CIO Ulrike Hoffmann-Burchardi sees a possible “mid-cycle capital-expenditures indigestion”, while Morgan Stanley stays constructive but warns that higher capital costs will hit leveraged AI borrowers. Bank of America‘s Michael Hartnett is tactically risk-off through mid-November.
The capital-cycle warning Bank of America’s Sebastian Raedler argues the technology can work while overinvestment, competition and falling prices still deliver poor shareholder returns. Hyperscaler spending expectations are near $1 trillion, up from roughly $330 billion in early 2025.
Concentration sharpens the risk, because the Nasdaq leans heavily on a few mega-cap AI names facing higher capital needs and weaker free cash flow at once. Today’s stress sits in the most AI-dependent borrowers. That is more serious than a valuation wobble but not yet the broad pattern of the crisis episodes, so your job is to watch whether it widens.
What does defined-risk options positioning look like in a dip like this?
Defined-risk toolkit
A defined-risk options trade caps your maximum loss when you open it. Implied volatility, the level of future price swings that option prices are building in, matters here: when it is high, option sellers collect more premium but face larger expected moves.
| Strategy | Construction | Main trade-off |
|---|---|---|
| Iron condor | Sell an out-of-the-money call spread and put spread | Gains from time decay and falling volatility; loses on large moves |
| Vertical spread | Buy one option, sell another strike, same expiry | Short leg funds the long leg but caps gains |
| Credit spread | Sell an option, buy a farther one | Higher premium in high volatility, but bigger expected moves |
| Debit spread | Buy an option, sell a farther strike | Loss limited to premium; needs a timely move |
| Long put / put spread | Buy downside protection, optionally sell a lower put | Expensive in high volatility; spread limits protection |
One trader’s setup
The commentator behind the study chose not to buy the dip outright. Instead, he began building a short iron condor in ES, the S&P 500 futures contract, which has held up better than the Nasdaq. The parameters he described:
- IV rank (where current implied volatility sits within its past range) at 54.2
- About 48 days to expiration
- Short call spread near 7975/8000, short put spread near 7250/7275
- Opened for about $8.40, with an exit target of $4.20 or lower
Each choice traces back to the study. A further 5% drop equals roughly 350-400 points, to around 7200-7300, which guided the put side. Exiting at about 21 days into a 45-day trade gives a holding window near 24 days, close to the study’s one-month horizon, and he admitted the trade could be early given the 47% further-drop odds.
Cboe notes iron condors profit when markets move less than implied volatility suggests, and that implied volatility has exceeded later realised volatility more than 80% of the time. Maximum loss is the spread width minus premium received, and overnight gaps, volatility spikes and thin liquidity can still deliver it. This is educational, not a recommendation: the lesson for you is the process of turning historical odds into a bounded loss and a set time window, not one trader’s strikes.
Path risk is where options drawdowns do their damage: margin calls and rising volatility can push a trader out of a position that would eventually have recovered, which is why defined-risk structures survive more often than naked ones.
Past performance does not guarantee future results. These statements are speculative and subject to change based on market developments.
What the evidence changes, and what it leaves for you to judge
A 9% Nasdaq dip has historically offered a modest edge overall, a strong one outside crises and a poor one inside them. The odds of a further 5% fall are your clearest gauge of how rough the ride may get.
Watch three things: whether credit stress stays confined to AI-linked borrowers, whether financing conditions tighten, and whether earnings cuts spread beyond the capex cycle. Hartnett’s mid-November window is one near-term marker.
Resist borrowing comfort from S&P 500 correction studies such as those from LPL Financial and Carson Group. They measure a different index at a 10% threshold, so they cannot stand in for the Nasdaq 100 evidence.
The decision that matters is sizing. Build any position to survive the path, not just to collect the average.
This article is for informational purposes only and should not be considered financial advice. Investors should conduct their own research and consult with financial professionals before making investment decisions.