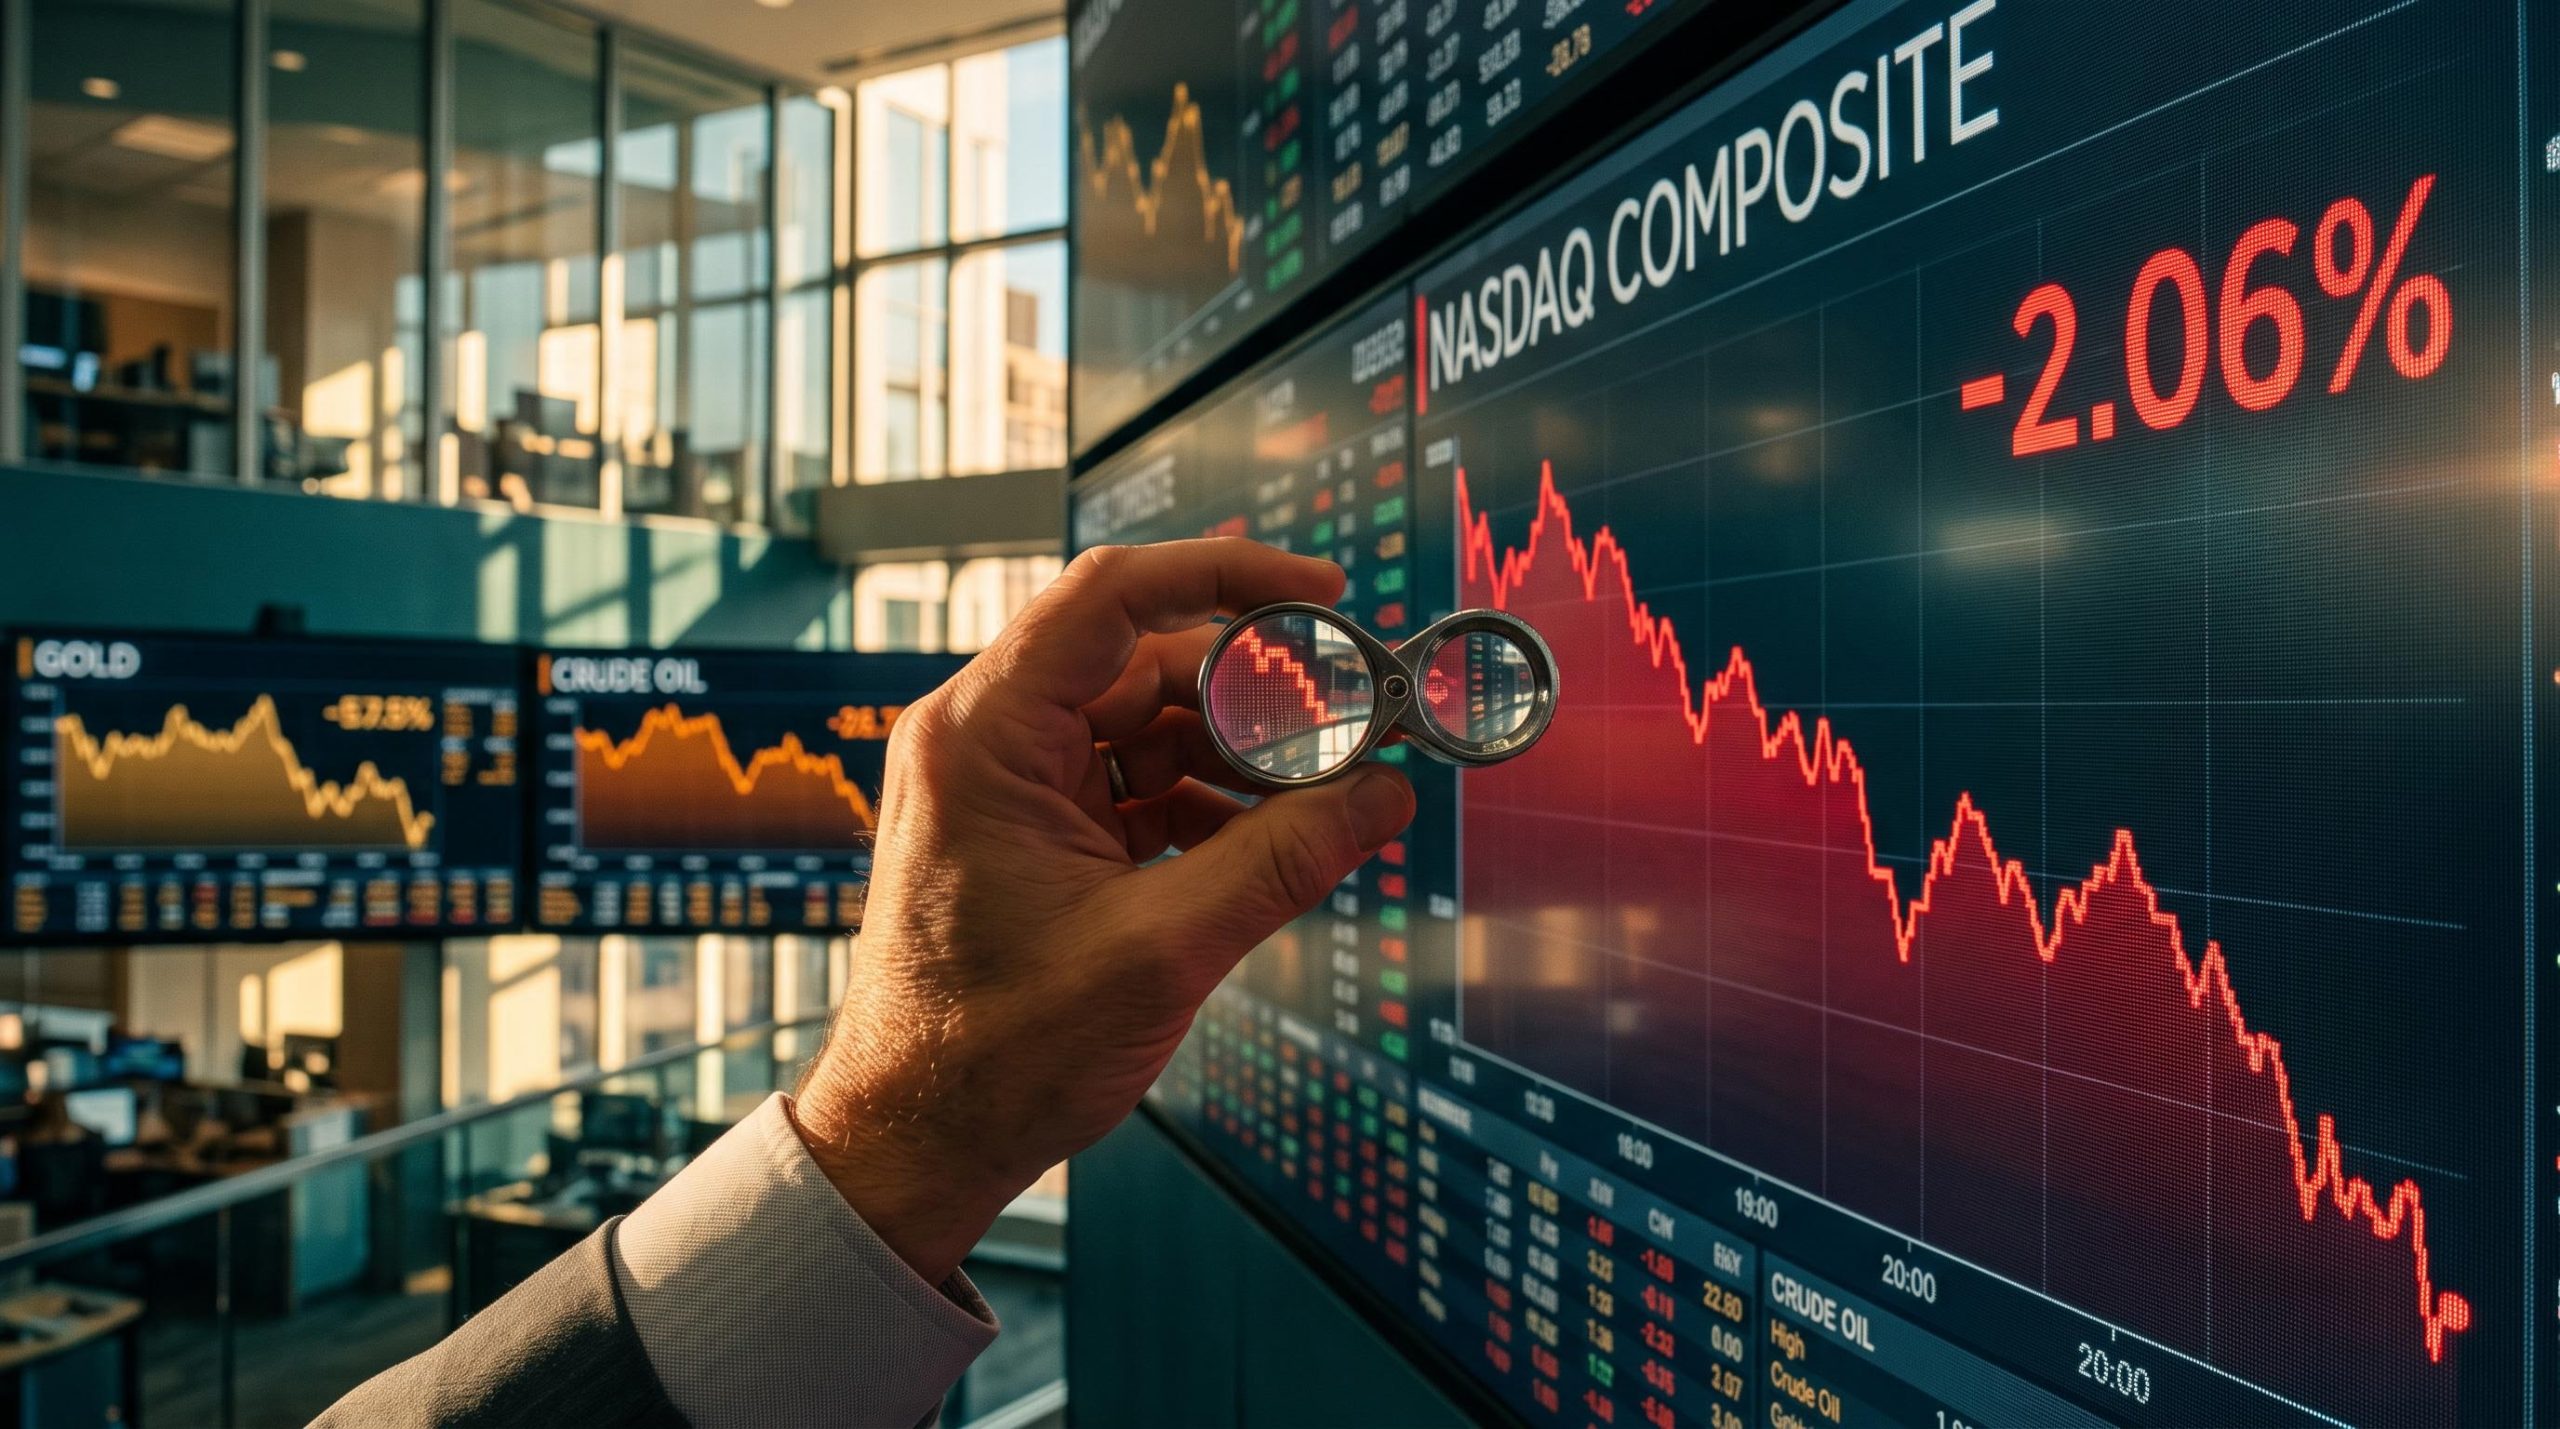
On 22 October 2026, the Nasdaq Composite fell 2.06% while the S&P 500 slipped 1.10%. Technology carried the damage. Yet one veteran trader looked at the tape and called the decline “orderly.” That word is the starting point for a bear market playbook built on reading one market through the others.
The trader is Todd Horowitz of Bubba Trading, who spoke with host Chris on Tasty Live. Horowitz treats equities, bonds, crude oil and gold as a single connected picture. When one moves, he asks what the others are saying about it.
Everything attributed to him here is one trader’s opinion as of 31 October 2026. None of it is a forecast or a recommendation.
You will get his cross-asset reasoning, the counterarguments that push back on each leg, and the risk principles that apply however the market moves next.
Why does one trader call this selloff orderly while the market feels shaky?
His read
Horowitz’s case for calm rests on how the selling is behaving rather than how much it has cost.
- Volatility: He put the VIX (a gauge of expected S&P 500 swings drawn from options prices) at just over 20, down from about 23 the previous Friday.
- Volume: Trading volume was light and nowhere near panic levels.
- Stretch: He said the indexes sat about two standard deviations below their mean. That is a statistical measure of how far prices have strayed from their typical range.
He still expects another 3-4% downside before conditions turn deeply oversold. His short-term buy zones sit at about 28,000 on the Nasdaq and 7,600 on the S&P 500. These are levels he says he is watching, not where the market currently trades. The Nasdaq closed at 26,152.90 on 22 October.
Sell the rally, not the dip Horowitz says he would rather sell into a rebound than buy into weakness. He is not adding shorts now. He would wait for a bounce to sell or a clear level to buy.
The counterpoint
The tidy picture frays at the edges. Reuters linked the selloff to renewed concern about AI costs, weak reactions to Tesla and Meta earnings, and higher oil prices. Equity losses also spilled into forced selling in metals.
That makes the episode look like a hybrid. In volatility terms it is orderly. In the AI and liquidity channels it is not. Natixis said part of the selloff was justified by markets repricing towards tighter policy, but argued the latest rise in yields had overshot.
The lesson for you is that “orderly” describes the pace of selling, not the size of it. A calm VIX does not cap how far prices can fall.
When big ASX news breaks, our subscribers know first
Why do bear-market rallies hit so hard, and why does he sell them?
If the decline is grinding rather than collapsing, Horowitz expects it to be interrupted. He anticipates a sharp, fast relief rally within a day or so. He also says bear markets produce the most violent rallies of any market phase.
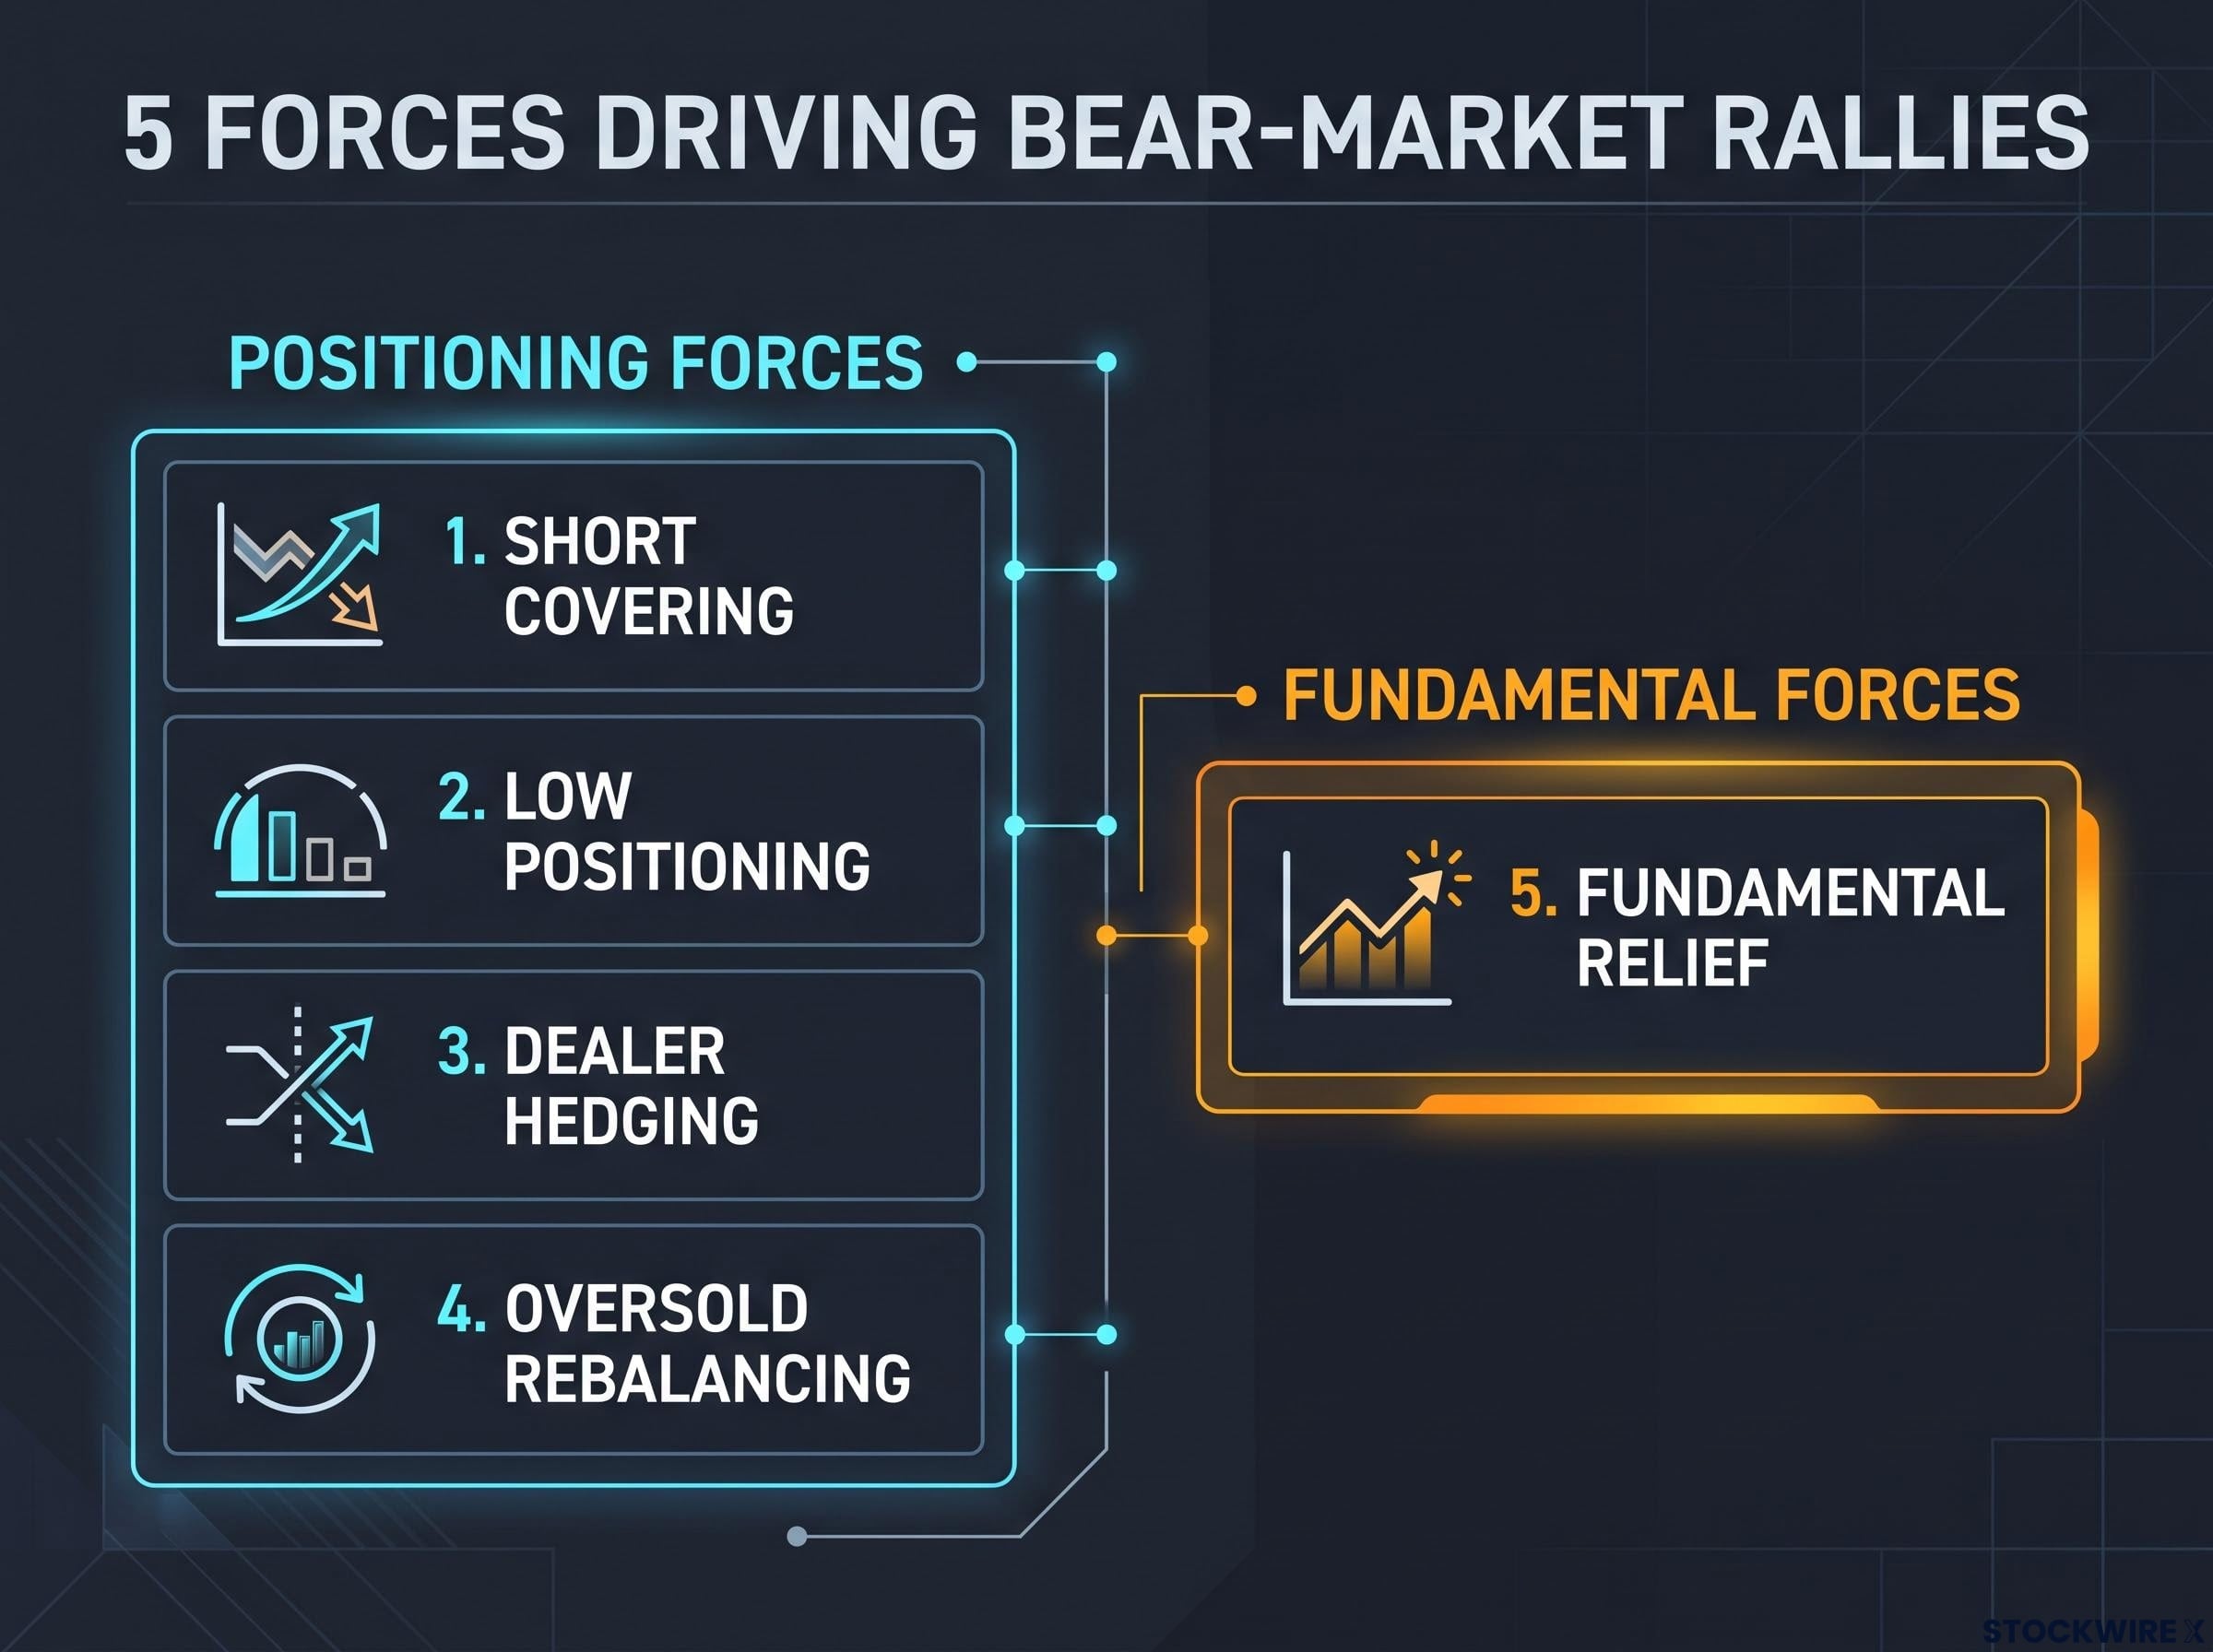
Five forces usually drive those bounces:
- Short covering. Traders who bet on falling prices buy shares back to close their positions, which pushes prices up quickly.
- Low positioning. Fund managers who are underinvested scramble to buy so they do not fall behind their benchmarks.
- Dealer hedging. Banks that sell options adjust their own stock holdings as prices move, and that can amplify a rebound.
- Oversold rebalancing. After a volatility spike, funds with fixed allocation targets buy assets that have fallen below their target weight.
- Fundamental relief. Lower yields, better earnings, softer inflation or a cease-fire signal give buyers a real reason to return.
The first four forces are about positioning. Only the fifth reflects changing fundamentals, and that is why Horowitz treats most bounces as selling opportunities.
Short covering, the forced buying behind a self-reinforcing squeeze, can lift prices sharply without any improvement in the underlying business, which is why a fast bounce says more about positioning than about the end of a selloff.
He adds that traders tend to fail here for two reasons. Their stops are too tight, or their position sizes do not suit them. A violent rally punishes both mistakes.
What the sceptic says
A rally built on short covering can be fierce without marking a durable bottom. The reverse also holds. Natixis argued that a compression in long-term yields could spark a broad catch-up rally, which would fall into the fifth category.
So a fast bounce tells you about positioning, not about whether the selloff is over. Judging what is causing a rally matters more than measuring how big it is.
What does the bond and crude read say about rates and fear?
Rates and the Fed
On 28 October, the US Federal Reserve held its target range at 3.75%-4.00%. The vote was 10-2, with Lisa Cook and Beth Hammack preferring a 25-basis-point hike. Chair Kevin Warsh said inflation remained too high but declined to commit to a future move.
Horowitz reads the hold as election timing. In his view, the Fed skipped a hike to avoid acting just before the vote, and he expects at least one more increase this year. He sees the recent bond bounce, with futures near 107-18 against a high near 108-13 according to the host, as a short squeeze. He is selling 10-year and 30-year futures and says the 10-year yield could reach 6% by year-end.
The market was moving the other way. The 10-year yield fell to about 4.93% as investors sought safety during the selloff. Warsh also said he was “unwilling and unable to call” financial conditions tight.
Crude and the curve
Oil futures are in backwardation. This means contracts for near-term delivery cost more than contracts for later delivery. Horowitz says the front month sits roughly $20 above the contract a year out.
He treats that gap as a fear premium and is short crude. He notes that prices are making lower highs against the roughly $120 peak at the start of the Iran conflict. Brent settled at $117.64 and WTI at $104.12 on 30 October, according to Kitco. Separately, Chris is selling short iron condor calls near 120, a level he notes was not breached in March.
The oil backwardation spread is the market’s own estimate of embedded fear premium, and other analysts have pointed to supply surplus forecasts and OPEC+ changes as reasons that gap could narrow over the coming year.
| Thesis | Horowitz’s view | Counterargument | Source |
|---|---|---|---|
| Fed policy | At least one more hike this year | Warsh declined to pre-commit; the committee split 10-2 | CNBC |
| 10-year yield | 5-6% by year-end | Yield fell to 4.93%; Natixis sees a technical overshoot | Kitco, Natixis |
| Crude | Fear trade, short position | Hormuz flows near 60% of normal sustain the supply premium | Reuters |
| Longer-term oil | Premium fades | Analysts raised 2026 forecasts to $92.88 Brent and $86.60 WTI | Reuters |
Backwardation is not rare. CME found crude in backwardation about 58% of the time since 1985. The curve shape tells you the market is paying extra for barrels now. A short position depends on that premium fading, and it can fail fast if the conflict escalates. Horowitz himself flags the risk of an unexpected weekend event.
Why did gold and silver fall when fear was rising?
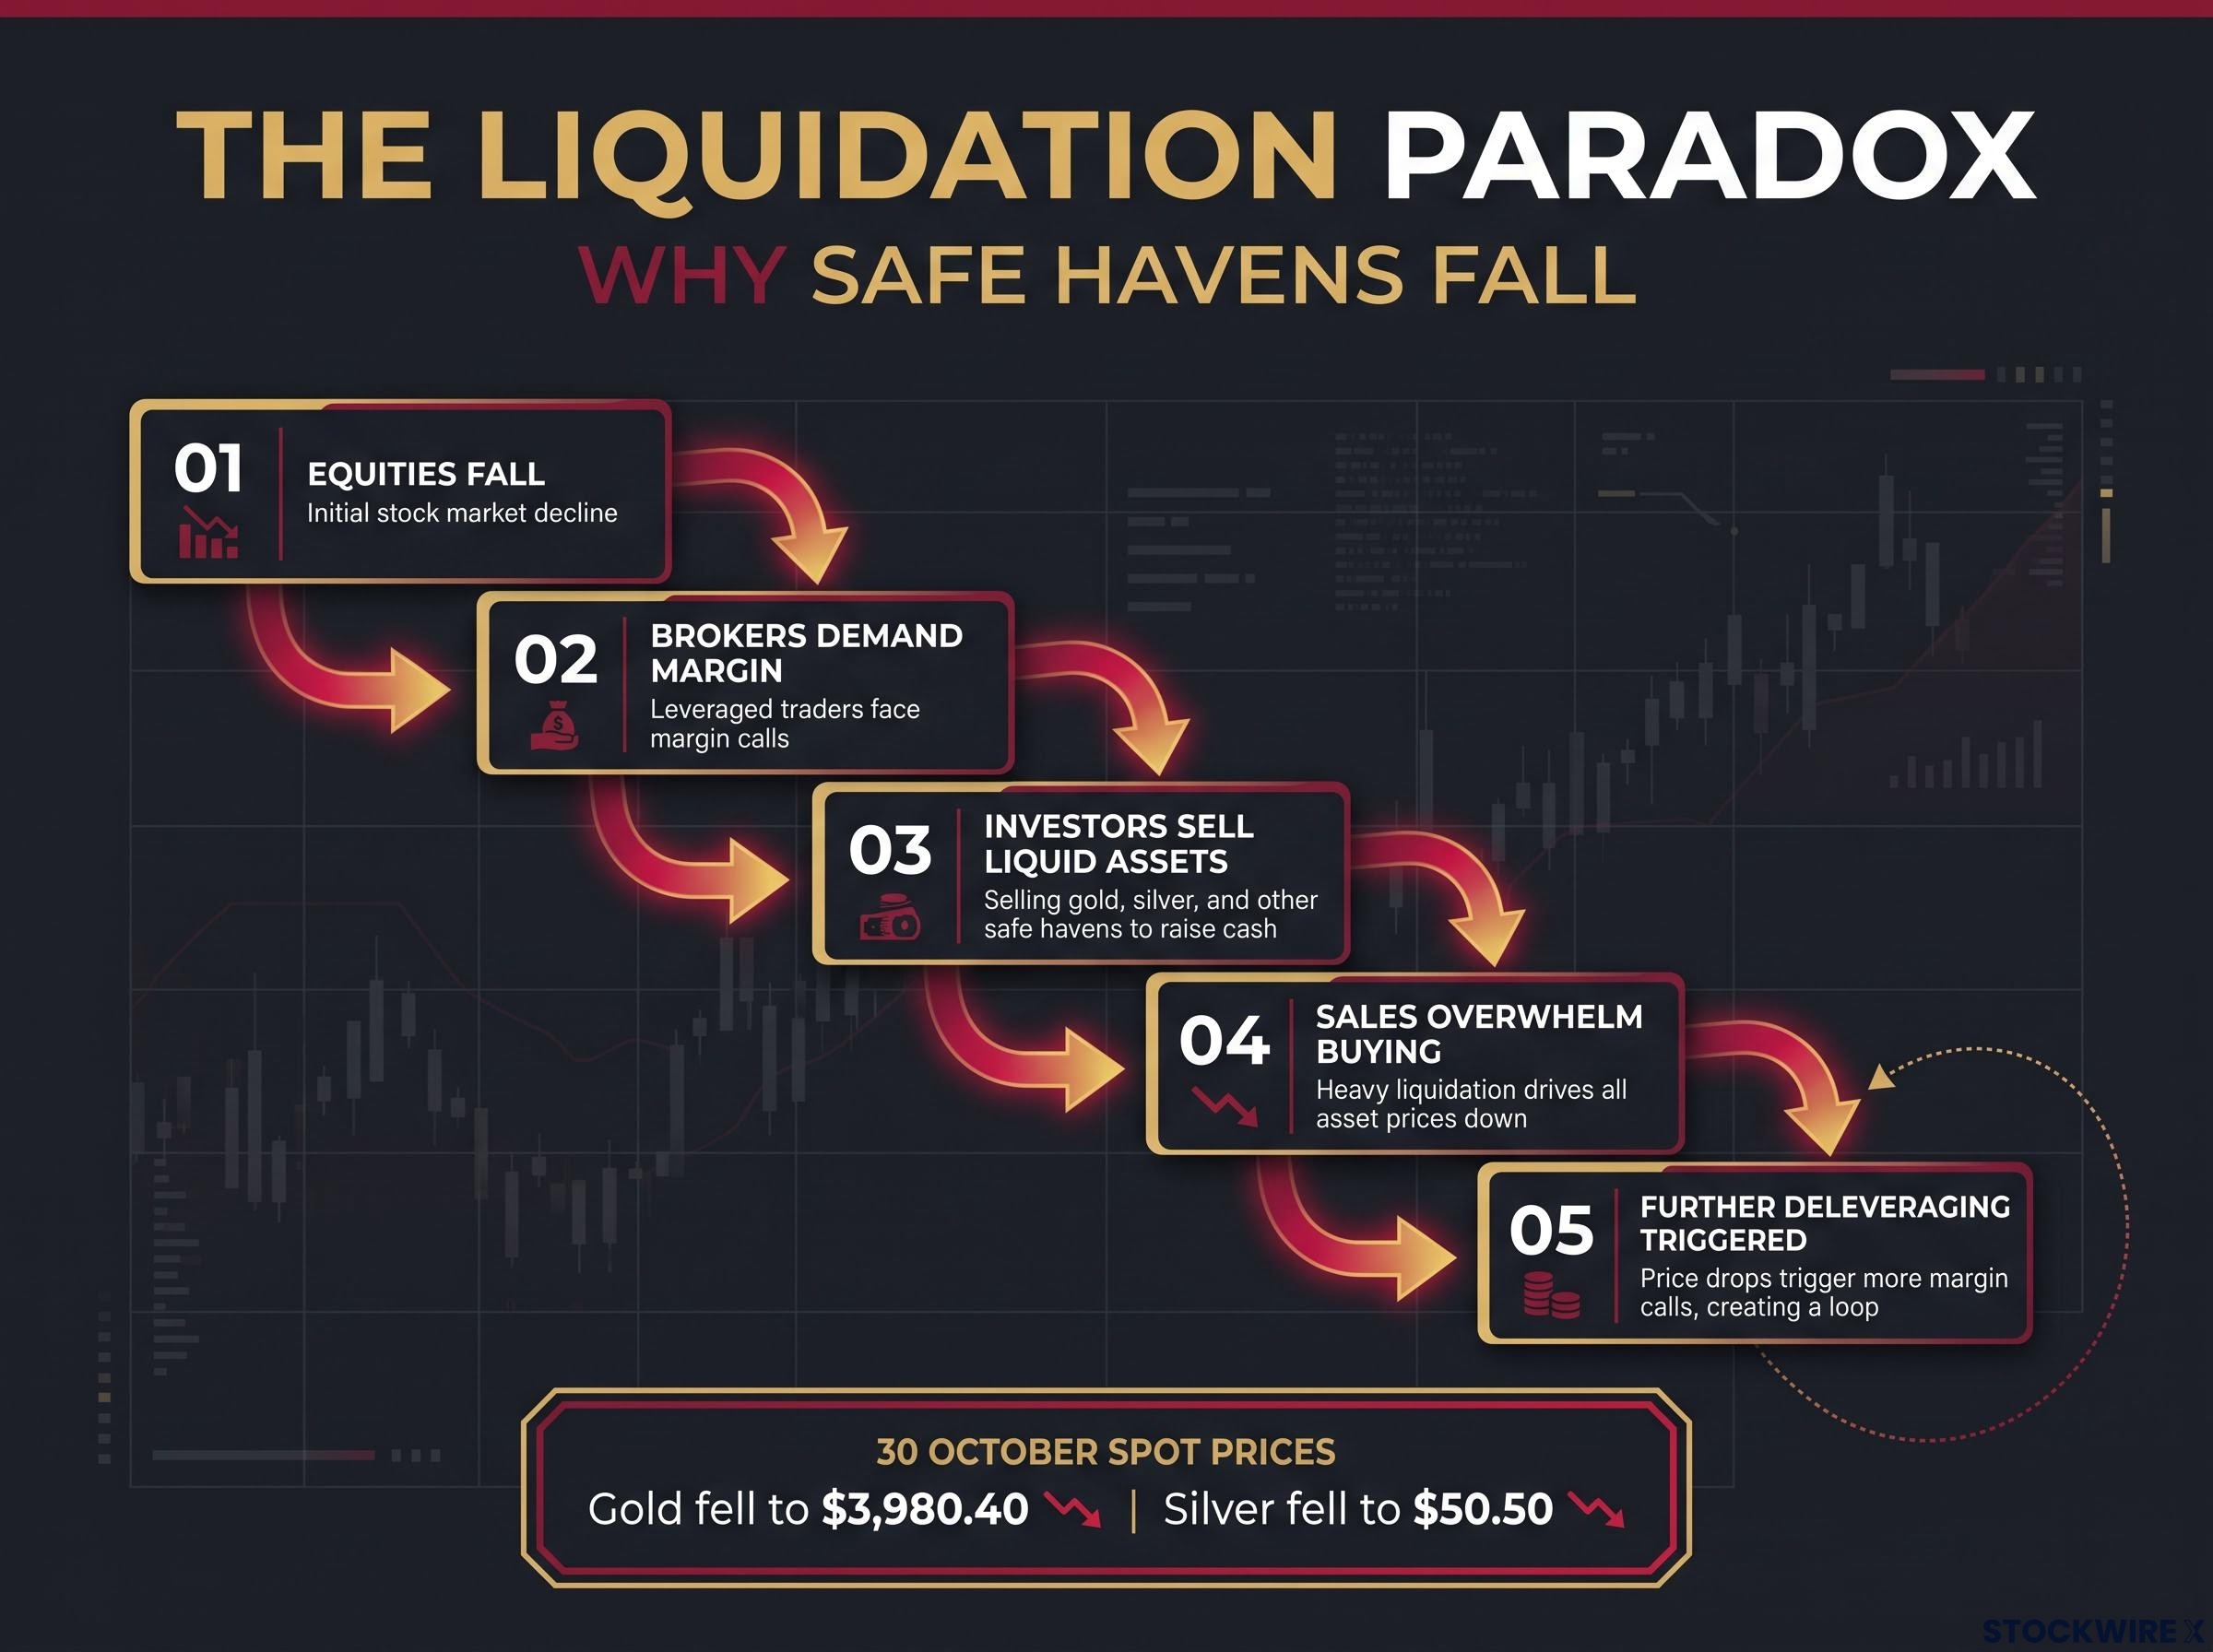
Fear usually lifts safe havens. Instead, spot gold fell 1% to $3,980.40 on 30 October, leaving it down 4.3% for the month, according to Reuters. Silver fell 3.6% to $50.50. Later Kitco prints showed gold near $3,879.90 and silver near $49.015, down 6.06%.
Commentators traced the paradox to forced selling, which works like this:
- Equities and leveraged positions fall.
- Brokers demand more margin, which is cash or collateral to cover losses on borrowed money.
- Investors sell whatever they can sell quickly, including gold ETFs and futures.
- Those forced sales overwhelm safe-haven buying.
- Falling prices trigger further deleveraging and stop-outs.
Horowitz still calls the fall orderly. He had expected $4,000 gold to hold and now sees $3,600 as a possible downside target. Rather than catch a falling knife, he would consider selling put spreads with defined risk and accept the loss if he is wrong.
The 1980 precedent Chris Watling’s October 2026 analysis reported initial declines of about 43% in gold and 77% in silver in 1980. Relief rallies and a more orderly decline followed.
Watling’s comparison is a reference point, not a template. October may prove to be a temporary liquidity event, after which lower yields or central-bank demand could restore the hedging role of gold and silver. A hedge that fails during a squeeze has not necessarily failed for good. It is leverage that turns a safe asset into a source of cash.
Investors exploring longer-horizon positioning will find our deep-dive into precious metals allocation and ratio signals, which sets out the Zurich study findings and why ratio charts are not short-term timing tools.
How does he structure trades and control risk when volatility spikes?
How the structure works
Horowitz’s main tool is the weighted double diagonal. A diagonal means buying a longer-dated option and selling a shorter-dated option of the same type at a different strike price. A double diagonal pairs a put diagonal with a call diagonal. The weighted version adds more contracts to one side to tilt the position towards a view.
Risk is highest when the trade is opened. It shrinks as the short options lose value and premium is collected. The example below is illustrative only, with an index trading at 100.
| Leg | Position | Strike and expiry | Debit or credit |
|---|---|---|---|
| Long put | Buy | 90 strike, 90 days | -$5.00 |
| Short put | Sell | 95 strike, 30 days | +$2.50 |
| Long call | Buy | 105 strike, 90 days | -$4.00 |
| Short call | Sell | 110 strike, 30 days | +$1.50 |
The net debit is $5.00 per share, or $500 per spread. Weighting the downside with two put diagonals and one call diagonal lifts the cost to about $8.00 per share, or $800 for the three-spread package, before commissions.
Sizing and stops
Horowitz’s principles are simple:
- Define your risk before you enter.
- Know your exit.
- Never increase position size to win back losses.
- Trade smaller and more often when markets are volatile.
Tastylive offers a reference of 1%-3% of account value per defined-risk position, falling to 1% or less when volatility is high. One stop method is to reduce a $500 package after a $250-$300 loss.
The tastylive position sizing guidance recommends keeping defined-risk positions to 1%-3% of total account value, and it warns that trading too large does more damage to a portfolio than almost any other mistake.
The structure caps initial risk but does not remove it. Price gaps can jump past stops, falling implied volatility can erode the long options, and risk rises sharply near expiry. It is sizing and exit rules, more than the cleverness of the trade, that decide whether you survive a volatile market.
What a single trader’s playbook can and cannot tell you
Horowitz’s bearish case hangs together. Expensive oil, inflation pressure, an undecided Fed, stretched AI spending and forced liquidation all point the same way. The difficulty is that much of it may already be priced in.
Take the AI debt thread. He says off-balance-sheet AI debt totals trillions. Reuters’ disclosure-based figure was about $1.09 trillion in uncommenced leases across five major companies. Alphabet’s long-term debt rose to about $125.1 billion from $21.6 billion a year earlier (CNBC), and hyperscalers issued about $220 billion of debt in 2026 through 10 August. Yet Alphabet’s bonds sold with a concession of only 10-15 basis points, which shows issuers kept market access.
Four catalysts could flip the picture quickly:
- A cease-fire in the Iran conflict
- Falling long-term yields
- Improving market liquidity
- Credible growth in AI cash flows
Treat this as a worked example of how one experienced trader reasons, not as a set of positions to copy. Test each leg against its counterargument before you borrow any of it. The part that carries over to any market is the habit of defining your risk first.
These views are one trader’s opinions and are general information only, not personal advice. Forward-looking statements about rates, oil and metals are speculative and subject to change as markets develop.
This article is for informational purposes only and should not be considered financial advice. Investors should conduct their own research and consult with financial professionals before making investment decisions.