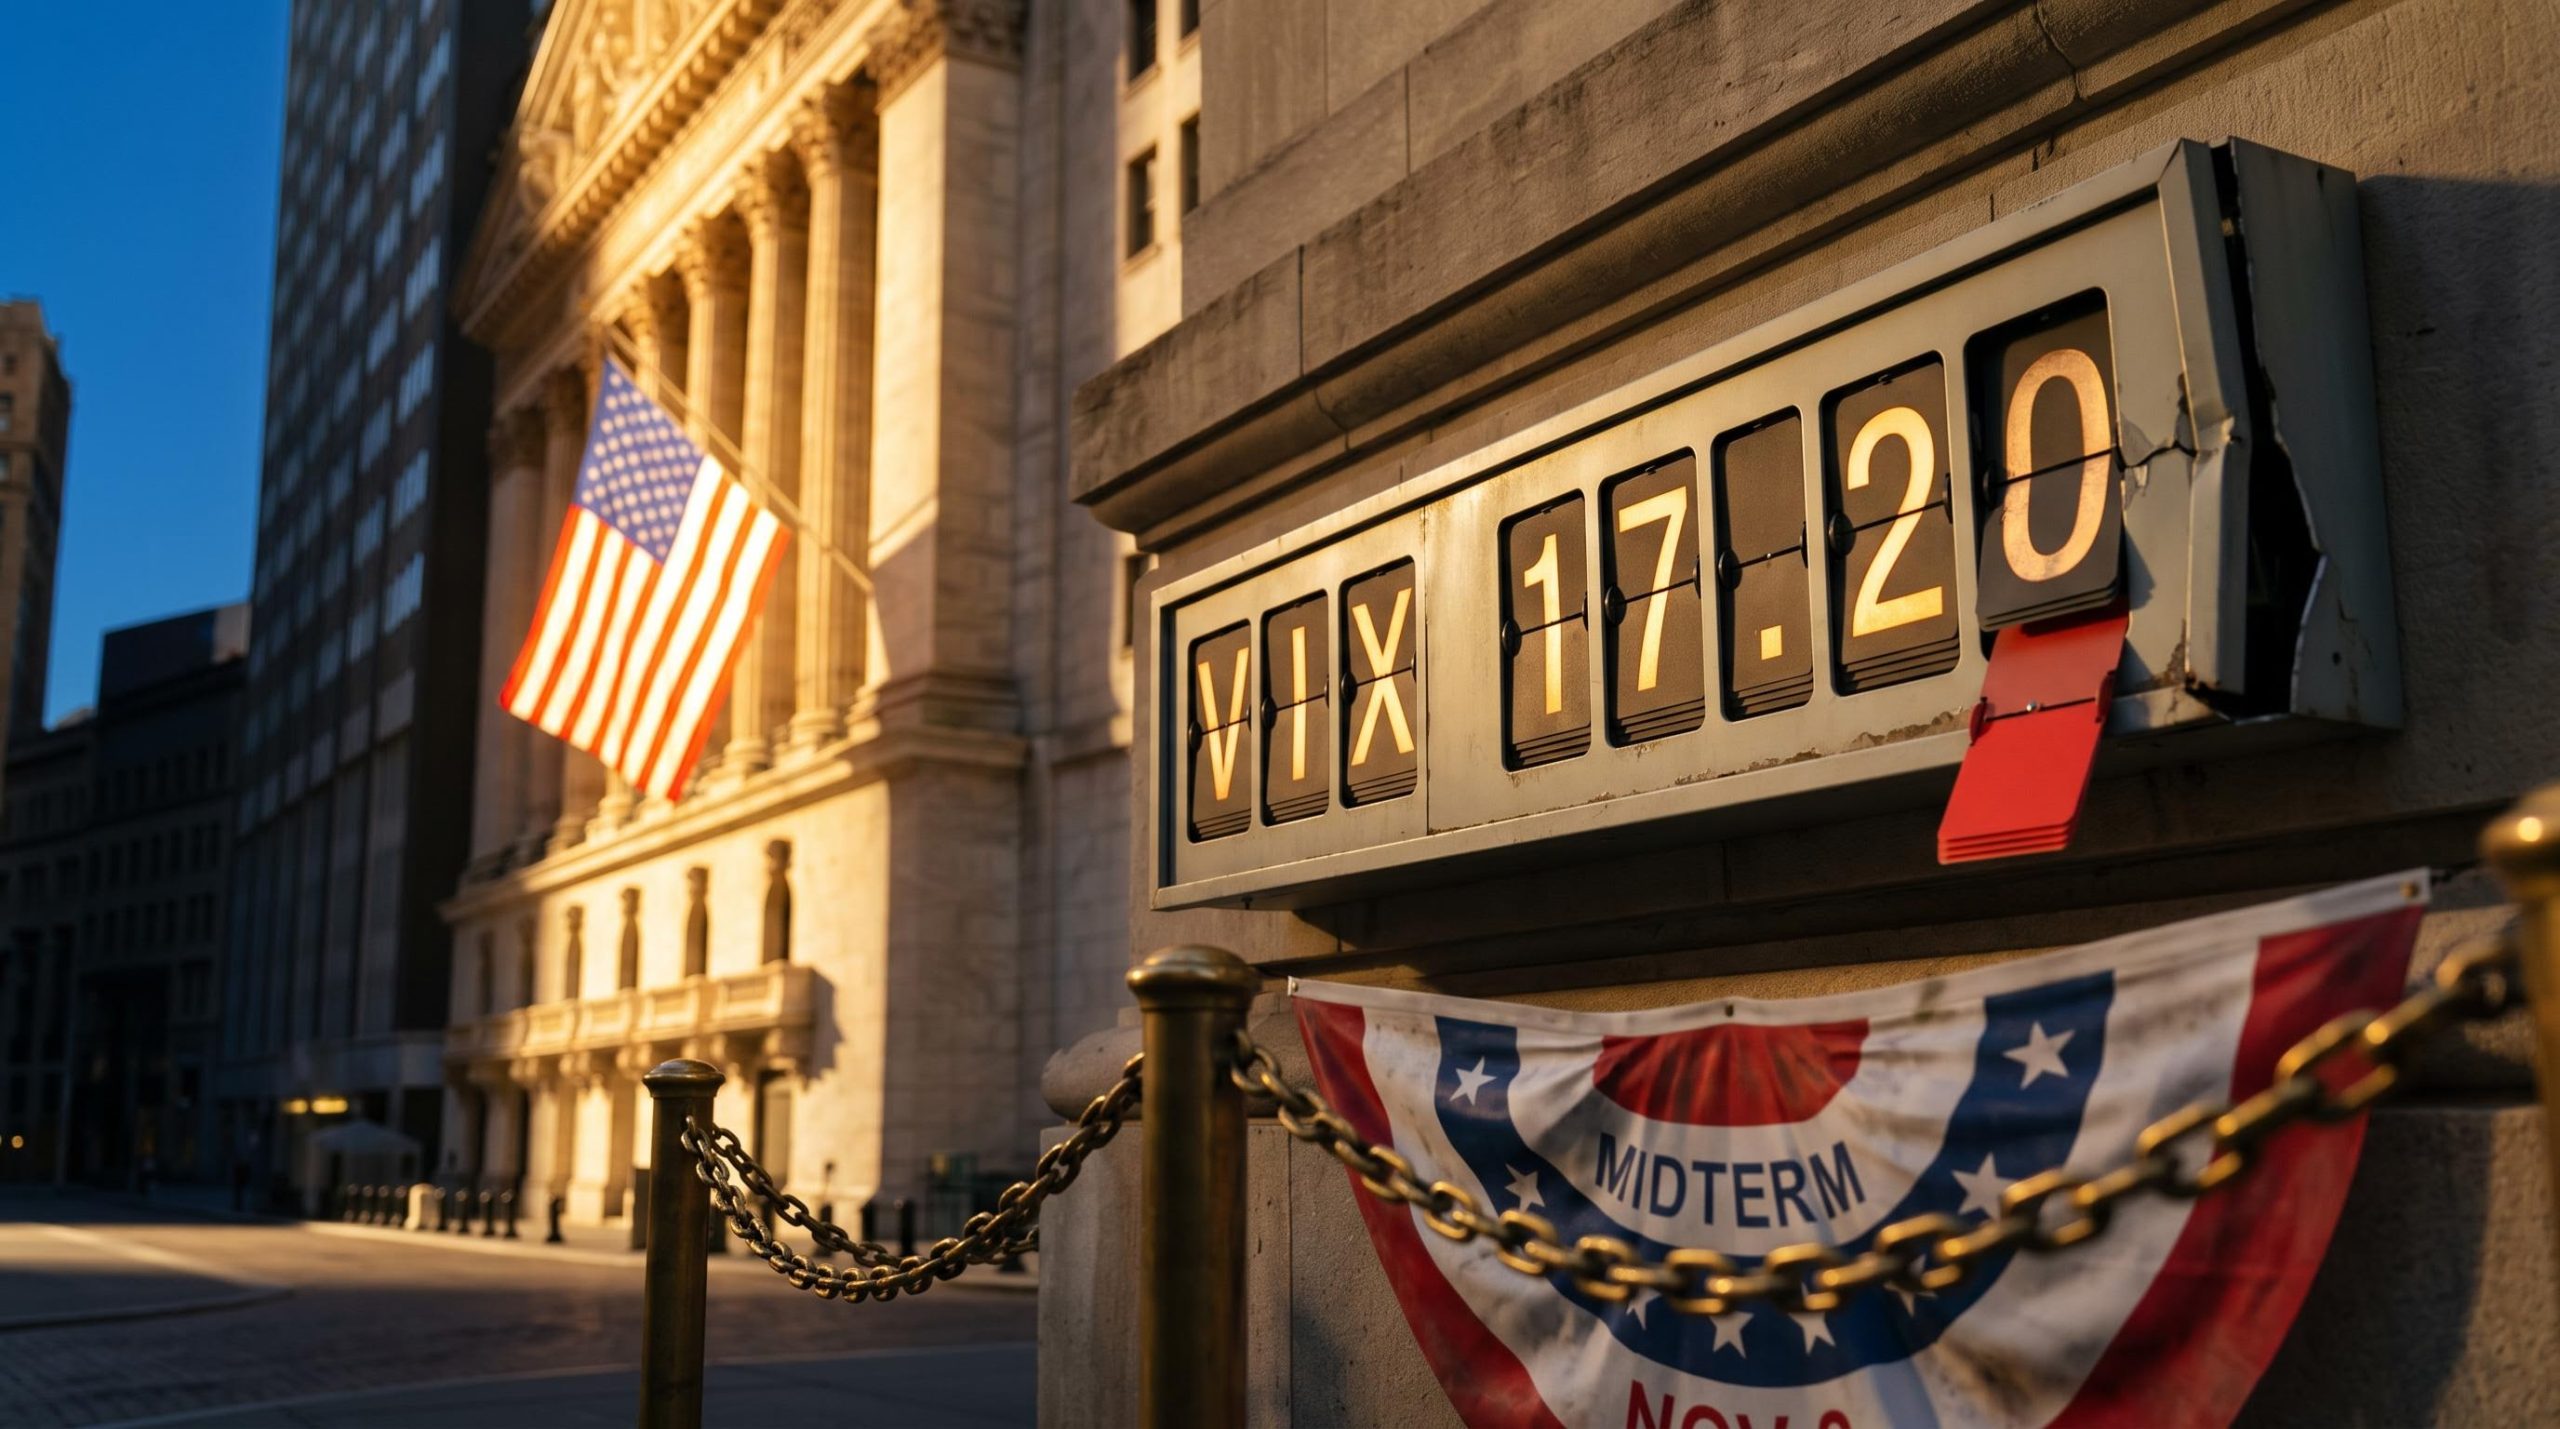
A VIX near 17 looks like a market at ease. On 30 October 2026, the volatility index sat at 17.20, according to Saxo Bank, yet the same report showed Nasdaq volatility up almost 6%. The headline gauge of midterm election volatility missed something important.
This is the final weekend before the 3 November midterms. Jim Carzan, founder of Car Wealth, argues that implied volatility could “unpin” across the Friday-to-Monday gap. Implied volatility is the size of the price swings that options prices suggest traders expect.
Carzan is clear that this is not a crash call. His view is about where volatility is most likely to break loose and which signal shows it first.
Here is how weekend-gap risk works, which signals deserve your attention, and why history makes the thesis less alarming than it first sounds.
Why does the Friday-to-Monday gap matter so much before the midterms?
Nobody wants to buy a falling market just before a weekend full of unknowns. Carzan’s point is that a closed cash market turns that ordinary caution into a structural problem.
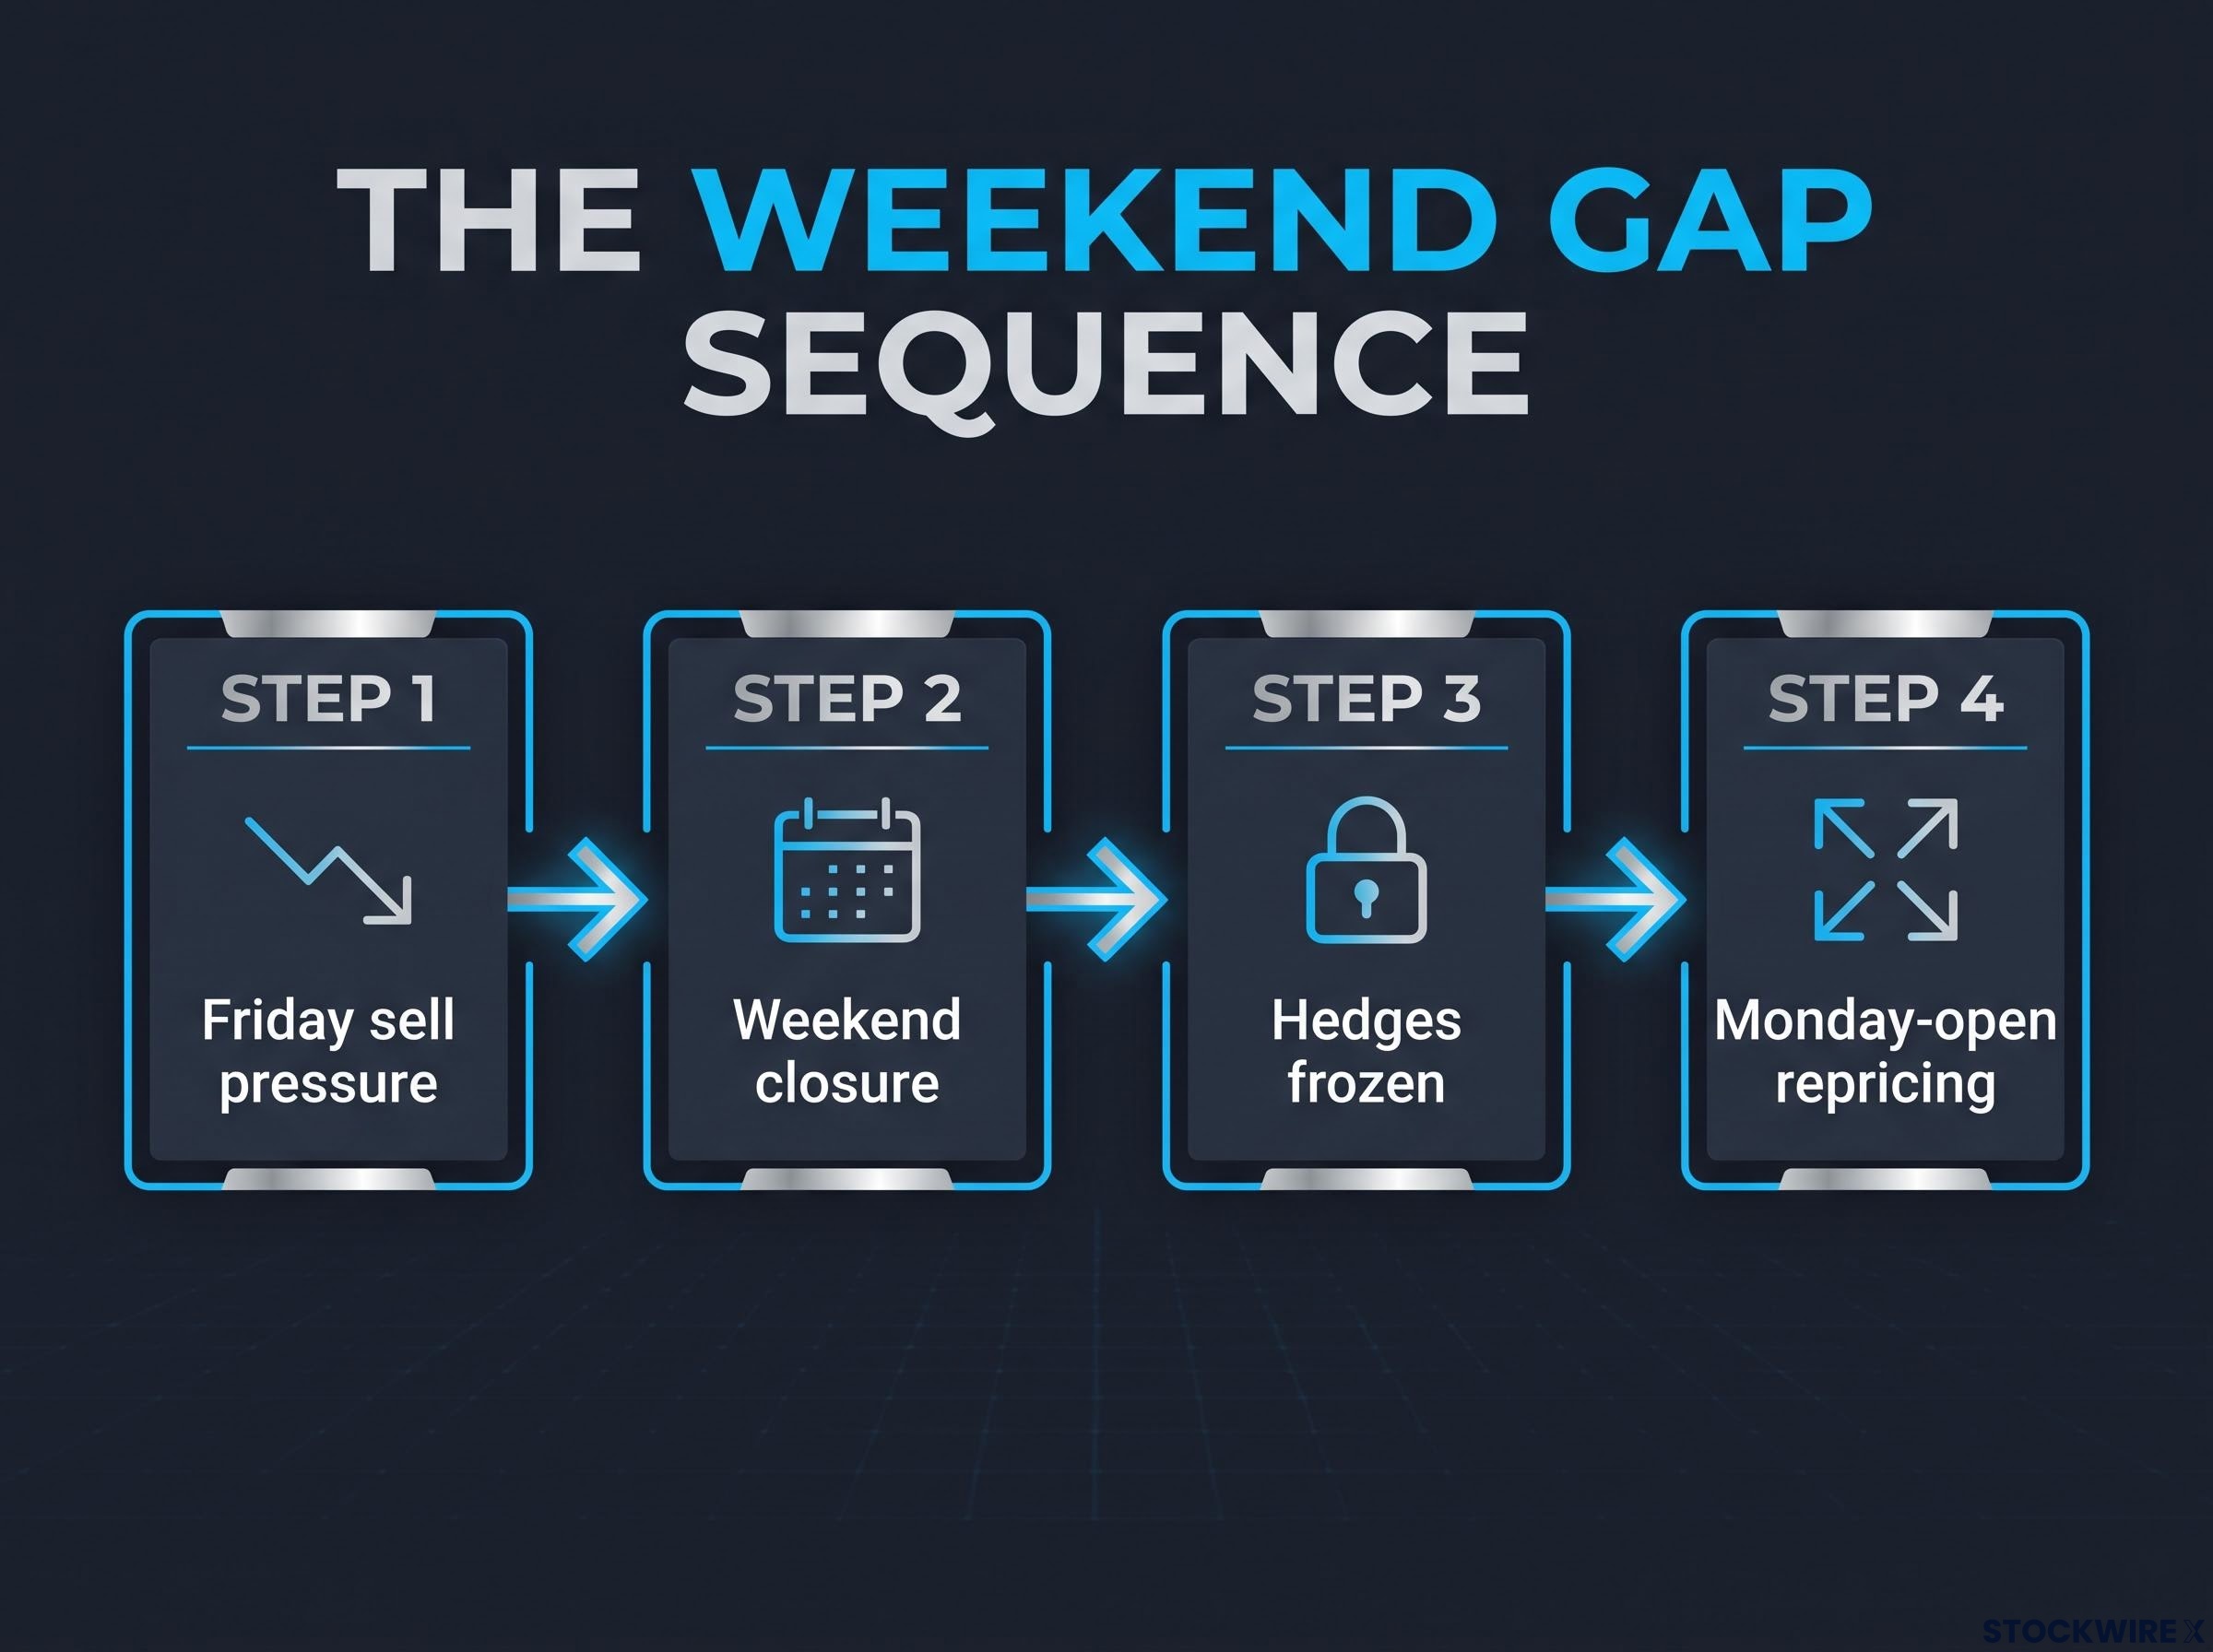
Options reprice the moment trading reopens, but the hedges behind them cannot be adjusted while the stock market is shut. The sequence runs like this:
- Friday sell pressure: Carzan describes Fridays as momentum days, often to the downside.
- Weekend closure: Cash markets stop trading, but news keeps arriving.
- Hedges frozen: Positions cannot be adjusted as risks change.
- Monday-open repricing: Everything catches up at once.
The squeeze hits both sides. Traders who are long gamma (positioned to profit from price moves) still pay theta, the daily time decay of an option, with no chance to trade around moves. Dealers who are short gamma cannot hedge gradually if prices gap, so they may have to trade aggressively at the open.
Carzan says large moves tend to occur from Friday into Monday and that this pre-midterm gap may be somewhat larger than usual. His full quote could not be independently verified. He adds that institutions waiting until Monday to buy can create a liquidity vacuum.
One study supports the pattern, finding Friday weakness and Monday recovery in front-month implied volatility. Its evidence comes from oil (WTI) options, though, not election-week S&P 500 options.
The market’s price tag Man Group estimated, via CNBC, that options priced 4 November S&P 500 volatility at about 1.2 times a normal day, roughly 20% above normal and broadly in line with prior midterms.
What this tells you: a weekend can compress a lot of hedging into one hurried Monday trade, but the market is charging a moderate premium for that risk, not pricing a shock.
When big ASX news breaks, our subscribers know first
How do dealers go from supplying volatility to chasing it?
The weekend problem matters because of how dealers behave. Their positioning decides whether a move gets absorbed or amplified.
Gamma in plain terms
Gamma measures how quickly an option’s sensitivity to price changes as the market moves. For dealers, it determines which way they must trade to stay hedged.
| Feature | Positive gamma | Negative gamma |
|---|---|---|
| Dealer hedging behaviour | Buy after declines, sell after rallies | Sell into declines, buy into rallies |
| Effect on moves | Counter-trend, stabilising | Trend-following, reinforcing |
| Typical market texture | Calm, prices “pinned” near heavily traded strikes | Wider intraday ranges, gap-and-go moves |
When dealers flip
Carzan says dealers aim to stay flat. While they hold plenty of volatility, they offer it freely. Once that inventory is gone and volatility rises, they become buyers, and liquidity can vanish quickly.
When dealers move to short gamma, liquidity thins quickly; Goldman Sachs documented S&P 500 top-of-book depth collapsing to $4.1 million from a $13.7 million average, so smaller orders can move prices several points.
Dealers tend to become volatility buyers when:
- Customer demand becomes one-sided, especially for puts.
- A price move turns gamma from stabilising to destabilising.
- Inventory or risk limits are reached.
- Bid-ask spreads widen and positions become hard to hedge.
- A gap prevents gradual delta hedging.
August 2024 showed how fast this can happen. The Bank for International Settlements (BIS) found that market makers widening option quotes, particularly for puts, amplified the VIX surge on 5 August 2024. The VIX is calculated from quotes, so wider quotes lifted it to nearly 66, up about 180%, the largest one-day rise in the BIS study. Cboe noted it was back near 15 by mid-August.
The read for you is that implied volatility can climb while stocks fall because dealer behaviour feeds on itself. Treat gamma maps with care, though: they are model-dependent estimates of a possible flow, not a forecast of direction.
Why is fixed-strike implied volatility a better gauge than the VIX alone?
If dealer stress builds at specific strikes, a broad index can blur it. This week’s data shows how.
The VIX is a model-free estimate of 30-day S&P 500 variance, built from a wide strip of out-of-the-money options. That breadth is useful, but it can hide:
- Which strikes are attracting protection
- Whether downside puts are repricing faster than at-the-money options
- Concentration in particular expiries, including election or weekend dates
- Effects from widening quotes and shifting skew
Admiral Markets put the VIX at 16.97 on 28 October, with the S&P 500 about 1.3% below its October record. By 30 October, Saxo reported the front VIX future had moved above the December contract overnight after Amazon and Intel results, a brief inversion. The November contract also carried a premium tied to the December Fed decision.
The VIX futures curve matters because its shape, not the spot level, shows how long markets expect stress to last; a brief inversion around a discrete event such as a Fed date is usually noise rather than a regime change.
Beneath the headline SpotGamma reported that fixed-strike implied volatility at strikes such as 6,600 and 7,000 had risen even though the headline VIX did not fully reflect that repricing.
That is what Carzan means by unpinning: fixed-strike implied volatility, measured at a set strike price, rising meaningfully.
He also offers a check on over-reaction. Options volume moves with volatility but not one-to-one, and volatility stays within a normal band about 95% of the time.
What this tells you: read the VIX level, futures curve, front-end expiry volatility, skew and fixed-strike implied volatility together. No single spike should drive your decisions.
Which warning signs point to unpinning, and when does calm mislead?
Carzan cites a list of reasons to hedge despite the apparent calm. Not all of them hold up to independent checking.
The warning signs, sorted by evidence
| Warning sign | Source of claim | Independently corroborated? |
|---|---|---|
| Disappointing big tech earnings | Carzan; Reuters, Saxo | Yes |
| AI leaders calling for a slowdown | Carzan | AI spending stress corroborated |
| No guidance from incoming Fed figure (Warsh) | Carzan | Not found in searched sources |
| Musk and Zuckerberg moving earnings earlier | Carzan | Not independently confirmed |
| SpaceX and Tesla merger talk | Carzan | Not found in searched sources |
| Significant cyber incident last week | Carzan | Not found in searched sources |
The tech stress is real. On 22 October, the S&P 500 fell 1.19% to 7,664.77 and the Nasdaq Composite dropped 2.58% to 26,008.86, its steepest daily fall since early June, according to Reuters. On 29-30 October, the Nasdaq Composite and Nasdaq 100 each fell about 1.4%, while the S&P 500 slipped 0.3%.
How calm becomes false calm
Low realised volatility encourages premium selling, carry trades and leverage. Structured products that sell options can suppress implied volatility until losses, barrier breaches or redemptions reverse the flow.
After August 2024, Reuters quoted Michael Purves of Tallbacken Capital Advisors saying short-volatility traders were forced out during the spike, then returned to bets on calm. The VIX hit an intraday high of 60.13 on 7 April 2025, per Reuters.
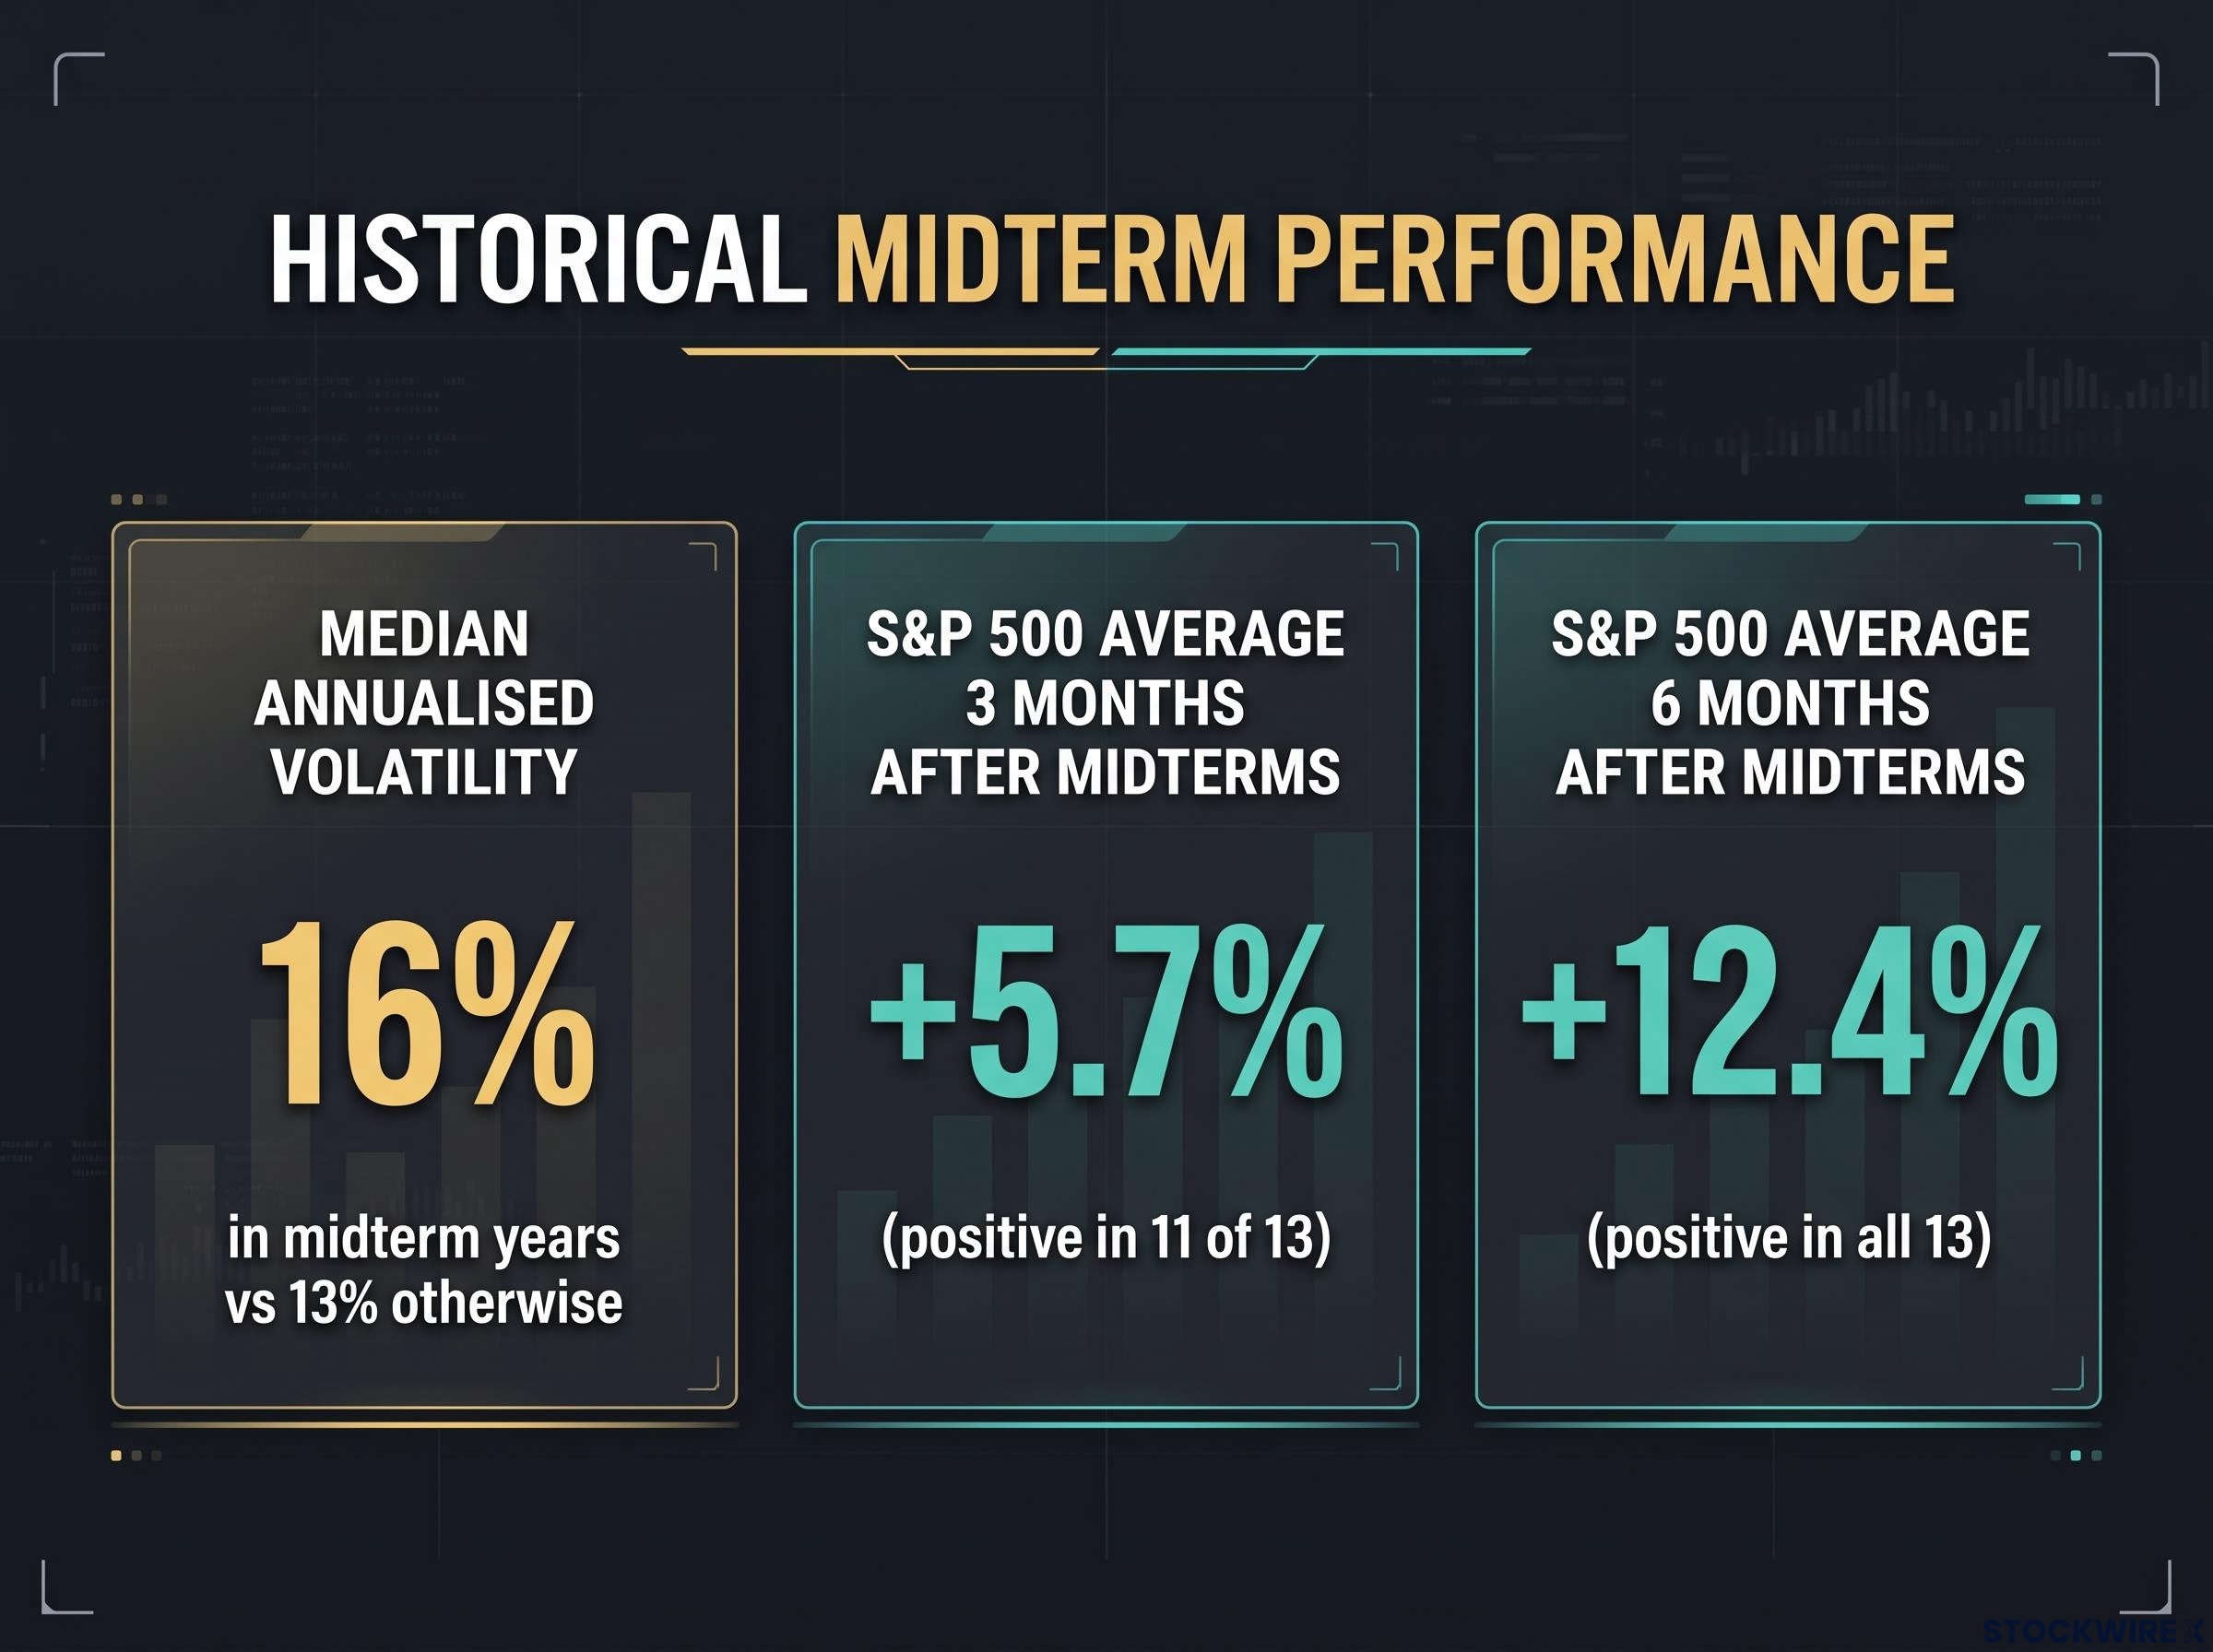
History pushes back on the alarm, though. Capital Group found median annualised volatility near 16% in midterm years since 1970, versus 13% otherwise. Schwab’s Michael Townsend, via CNBC, said the S&P 500 averaged +5.7% in the three months after midterms (positive in 11 of 13) and +12.4% over six months (positive in all 13). Past performance does not guarantee future results.
What this tells you: a quiet VIX can reflect positioning rather than low risk, but pre-election tension has usually resolved favourably. Base hedging decisions on verified signals, not on the full list.
This article is for informational purposes only and should not be considered financial advice. Investors should conduct their own research and consult with financial professionals before making investment decisions. These statements are speculative and subject to change based on market developments and company performance.
What to watch after Friday’s close, and what history says about the aftermath
Carzan’s thesis is a map of where volatility is most likely to break loose, not a crash forecast. Set the structural weekend-gap risk beside the 1.2x election-day pricing and a strong post-midterm return record, and you get a market charging a fair premium for real but limited risk.
Your watch list is short:
- Fixed-strike implied volatility at key strikes such as 6,600 and 7,000
- Any renewed front-end inversion in VIX futures
- Widening put quotes
- Signs of a delayed or contested count, the main election-specific tail risk
Monday’s open will show whether the gap stays a premium or turns into a repricing.
A falling spot VIX after 3 November may be purely mechanical, because the 30-day window drops Election Day, while certification and possible recounts in key states keep political risk alive into late November.